
ARCH-501 · Lesson 6 of 12 · 22 min
Representation strategy
By the tenth week the four theses are designed and largely resolved. What remains is to show them, and Leclerc insists that showing is itself a design problem with a strategy of its own. A representation strategy decides which drawings, models, images and words will carry the argument, for which readers, at what scale and in what order. It is written before the final production begins, because production without a strategy fills boards with the drawings that were easiest to make rather than the ones the argument needs.
'Every drawing on your wall should be there because someone needs it to follow your argument,' Leclerc says. 'If you cannot say who, take it down.'
Who reads a thesis
A thesis has more readers than its committee, and each reads differently. The committee reads for the argument and its evidence: the question, the methods, the design and whether the design answers the question. Visiting critics at the final review, who see the work for the first time, read for clarity: can they grasp the thesis in the first two minutes? The community, for theses like Ingrid's and Wren's, reads for what the work means for their lives and whether it represents them fairly. City staff, utilities and other professionals read for whether the proposal is realistic. Future students, who will find the thesis in the school's archive, read for method: how was this done, and could I do something like it?
Ingrid draws a matrix of her readers against the kinds of drawing she could make, and marks each cell as essential, useful or rarely needed. The matrix shows something she had not expected: the drawings her committee needs and the drawings her community needs overlap less than she thought. The committee needs the simulation charts and the details; the community barely needs them. The community needs the night perspective of the warm room and the diagram of how the check-in team works; the committee finds them useful but not essential. Only the district plan and the model are essential to everyone.
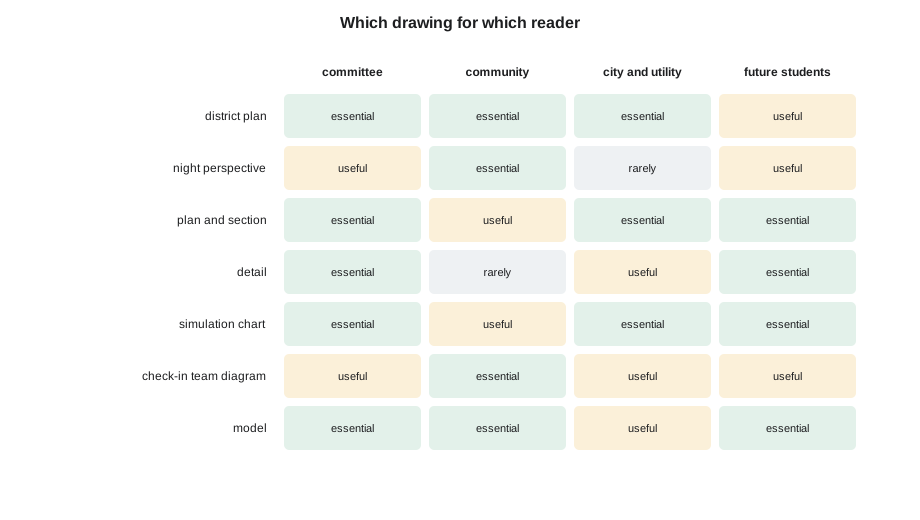
Her conclusion is that she needs two sets of material from the same work: the boards and models for the final review, and a plain-language community report, required by her results-return protocol, that goes to the hub before anything is shown at school. The two share the district plan, the model photographs and the night perspective, but the report replaces the charts with sentences and the details with photographs of the felt screens being tried out at the hub.
Choosing drawing types
Each kind of drawing does something the others cannot. A plan shows relationships and distances; a section shows height, light, air and what is above and below; a detail shows how something is made; an axonometric shows a three-dimensional arrangement without perspective's distortion; a perspective shows how a place feels to someone standing in it; a diagram shows a process or an idea stripped of everything else; a chart shows numbers; a model shows a whole that can be walked around. Leclerc asks each student to match each step of their argument to the drawing type that makes it best.
Ingrid's argument has five steps: the district has vulnerable people and too few warm places; a network of small familiar places can keep them warm; the pavilion and its store make the network last; the gym and hall become dignified warm rooms; and the network can be kept alive by the people who use it. The first step is best made by a district plan at night, with the zones of need, the existing buildings and the dark gaps between them. The second by the network plan and a diagram over the four days of an outage. The third by the pavilion plan and section with the store, and by the survivability chart. The fourth by the gym section at night and a large perspective of a felt room. The fifth by a diagram of the check-in team's year: recruiting in September, updating the list in October, a practice night in November, monthly reserve checks through winter.
Scale and the board
Representation strategy also decides scales, because scale decides what can be read. A district plan small enough to fit a board may lose the stops on the path; a pavilion section large enough to show the store may not fit beside the gym. Ingrid checks each planned drawing against the size of a board.
# Representation strategy: will each drawing fit its board at a scale the audience can read?
board_w, board_h = 36, 48           # one board, in
margin = 1.5
drawings = [  # (drawing, real width, real height in ft, scale denominator)
    ("district plan", 5600, 5600, 2400),
    ("pavilion plan", 80, 42, 48),
    ("gym section with warm room", 118, 30, 48),
    ("heat store detail", 13, 8, 12),
    ("site section along the lit path", 2600, 65, 480),
]
for name, w, h, scale in drawings:
    pw, ph = w * 12 / scale, h * 12 / scale   # size on paper, in
    fits = pw <= board_w - 2 * margin and ph <= board_h - 2 * margin
    print(f"{name:32s} at 1:{scale:<5} {pw:6.1f} x {ph:6.1f} in  {'fits' if fits else 'too big'}")
# The long section is redrawn as a folded strip across two boards, or at half the scaledistrict plan at 1:2400 28.0 x 28.0 in fits pavilion plan at 1:48 20.0 x 10.5 in fits gym section with warm room at 1:48 29.5 x 7.5 in fits heat store detail at 1:12 13.0 x 8.0 in fits site section along the lit path at 1:480 65.0 x 1.6 in too big
Four of the five fit. The long section along the lit path, from the church hall to the gym, is far too long at a scale where the stops and people can be read. She has two choices: draw it at half the scale, losing the people, or fold it into a strip across two boards, with the path continuing from one to the next. She chooses the strip, because the path is the thread that joins her network and deserves to run across the wall.
Representing people
A thesis about people must represent them, and representation can do harm. Ingrid's results-return protocol already forbids anything that identifies a household. Her representation strategy adds three more rules, drawn from her reading in Morningstar's course on culture and community and from Flett's advice. People in her perspectives are drawn as the district's people actually are: older, of many backgrounds, some with walkers or wheelchairs, families with children and pets, not the young, fit figures that drawing software supplies by default. No one is drawn as helpless; people in the warm room are cooking, talking, reading to children and checking on each other, as her interviews described. And no image shows a scene that an Elder or a participant has asked her not to show, such as the fire circle in use, which Flett asks her to draw empty, ready for people, rather than with a gathering in it.
Wren faces a similar question with the clean-up crews, who in her first drawings were anonymous figures with hoses. After a conversation with the city's crew supervisor, she draws them as named people with the tasks they described: the supervisor checking the terrace drains, two crew members on the hoses, a volunteer serving coffee.
Images that tell the truth
Leclerc warns against images that promise more than the design does. A night perspective of the warm room that shows a soft, even glow everywhere misrepresents a room lit only by low light strips and a bright desk. A rendering of the pavilion in summer sun hides the building's real job in January. Ingrid's night perspective is drawn by hand over a model photograph, deliberately dim, with the bright desk in the middle and the snow outside the high windows. Okonkwo, shown a draft, tells her it is the first image of a shelter he has seen that makes him want to be there rather than pity those who are.
Charts must tell the truth too. Ingrid's survivability chart shows the case without the store as well as the cases with it, so that the reader can see what the store does, and it shows the 100-person case, which is less flattering than the 155-person case. Callum's histogram shows every specimen, including the weakest. Joon-ho shows the floor without slots as well as with them.
Writing the strategy down
The representation strategy is written as a single page, pinned beside the strategy sentence from the first week. Ingrid's lists her readers, the five steps of her argument with the drawing that makes each, the scales, the boards and models, the community report, and her rules for representing people. Leclerc reads it and asks one question: 'What will a visiting critic see in the first two minutes?' Ingrid answers: the district at night, dark, with the network lit up across it. She moves that drawing to the top left of her first board.
Worked problem
Will it fit the board?
Ingrid wants to show the gym in section, 118 ft long, on a board 36 in wide with margins of 1.5 in on each side. What is the largest standard scale at which it fits: 1/4 in = 1 ft (1:48), 1/8 in = 1 ft (1:96) or 1/16 in = 1 ft (1:192)?
Show solution
- Usable width: 36 − 2 × 1.5 = 33 in.
- At 1:48, the section is 118 × 12 ÷ 48 = 29.5 in long.
- That is less than the usable width, so it fits.
- The larger scales would be needed only for details; the smaller ones would lose the people.
Answer: 1/4 in = 1 ft fits, with 3.5 in to spare.
Exercise 6: a representation strategy
- List your readers and what each reads for.
- Draw a matrix of readers against drawing types, and mark what each reader needs.
- Break your argument into steps and match each to the drawing type that makes it best.
- Check the scale of every planned drawing against the board, and decide what to do with those that do not fit.
- Write rules for representing people and places truthfully, and test your images against them.
Self-check
- Can you say who needs every drawing on your wall?
- What will a visiting critic understand in the first two minutes?
Order and sequence on the wall
A representation strategy also decides the order in which the drawings are met, because a wall of boards is read in a sequence, like a book, even when the reader is free to wander. Leclerc asks the students to test their sequence by standing at the review room door and imagining a visiting critic walking along the wall without the student present. Where does the eye go first? Which drawing comes second? Is there a point where the argument jumps, so that the critic must look back to understand?
Ingrid's first sequence put the pavilion on the first board, because it was the most finished drawing she had. The door test showed the problem at once: a critic meeting the pavilion first would take the thesis for a building project and read the network as an afterthought. She moved the district at night to the first board and the pavilion to the third, so that the critic meets the question, then the network, and only then the building that serves it. The order of the boards now follows the order of the argument, and the pavilion arrives as an answer rather than as a premise.
The same test applies to a single board. Each of Ingrid's boards has one large drawing that carries its claim and two or three smaller ones that support it, placed so that the eye moves from the large drawing to the small ones and from left to right. Captions sit below the drawings they describe, never beside a different drawing, and every board has the same margins and title position so that the four read as one set. Small decisions like these are rarely noticed when they are right and always noticed when they are wrong.
Finally, the strategy decides what will be projected and what will be printed. Ingrid projects only three things during her presentation: the opening image of the district at night, the survivability chart, enlarged so that the panel can read its numbers, and the final slide of targets and results. Everything else stays on the wall, where the panel can look at it during the discussion. A presentation that projects every board divides the panel's attention between the screen and the wall and leaves them reading neither.
Common mistakes
MistakeProducing the drawings that are easiest to make.
InsteadPlan the drawings the argument needs before production begins.
MistakeMaking one set of material for every reader.
InsteadCheck what each reader needs; a community report may differ from the boards.
MistakeDrawing generic figures from software libraries.
InsteadDraw the people the design is for, as they are.
MistakeRendering a scene brighter and kinder than the design.
InsteadShow the place as it will be at its hardest time.
MistakeShowing only flattering charts.
InsteadShow the hard case and the case without the design move, so its effect can be seen.
Summary and key terms
- A representation strategy decides which drawings, models, images and words carry the argument, for which readers, at what scale and in what order.
- A thesis has several readers: committee, visiting critics, community, professionals and future students; each needs different material.
- Ingrid's matrix shows that her committee and community need different drawings, so she makes boards and a plain-language community report.
- Each step of the argument is matched to the drawing type that makes it best; drawings are checked against the board for scale.
- People are represented truthfully and with dignity, and images and charts show the hard case.
- Representation strategy
- A plan for which drawings, models, images and words will carry an argument, for which readers.
- Axonometric
- A three-dimensional drawing that keeps parallel lines parallel, without perspective.
- Community report
- A plain-language account of research results written for the people who took part.
- Reader matrix
- A table of readers against drawing types showing what each reader needs.
- Strip section
- A long section split across several boards so that it can be read at a useful scale.
- Visiting critic
- A reviewer who sees the work for the first time at the final review.
Practice problems
Work each problem on paper first, then reveal the answer to check.
Who reads a thesis besides the committee?
Show answer
Visiting critics, the community, city staff and other professionals, and future students.
Which drawings did Ingrid's matrix show as essential to everyone?
Show answer
The district plan and the model.
Why did Ingrid fold the path section into a strip?
Show answer
At a readable scale it was far too long for one board, and the path deserved to run across the wall.
What three rules did Ingrid add for representing people?
Show answer
Draw the district's people as they are; show no one as helpless; do not show scenes participants ask not to be shown.
Why is Ingrid's night perspective deliberately dim?
Show answer
The room is lit only by low strips and a bright desk; a soft glow everywhere would misrepresent it.
What will a visiting critic see first on Ingrid's wall?
Show answer
The district at night, dark, with the network lit across it.
Lesson quiz · 5 questions
Score 60% or more to complete this lesson.
Create a free account to save your progress, take quizzes and earn a certificate.