
ARCH-250 · Lesson 1 of 12 · 25 min
Climate and comfort
On the first Monday of the winter term, Professor Ruth Abernathy meets the four students at the Kestrel Point warming hut at eight in the morning. It is minus 17 °F and the wind is coming off the frozen river. The hut they detailed in their first year, now finished, has its stove going. Abernathy hands each of them a small infrared thermometer and a notebook. 'Measure everything,' she says. 'The air near the stove, the air at the door, the glass, the floor, the bench, your own hands.' Ten minutes later the notebooks hold a dozen numbers that seem to contradict each other: the air near the ceiling is warm, the floor is cold, the inside of the glass is colder still, and Ingrid, sitting beside the window, insists she is freezing even though the thermometer on the wall reads a comfortable temperature. 'Good,' says Abernathy. 'Now you know why this course exists. Comfort is not one number, and a building is not a box of warm air. It is a set of surfaces, flows and people, and this term you will learn to design all three.'
Abernathy is a building scientist. She spent ten years measuring the energy use of farmhouses and schools across the Prairies before she came to teach, and she still carries a data logger in her coat pocket. Her course is about the parts of architecture that people feel before they see: warmth and coolness, fresh air, daylight, electric light, sound and silence. It covers the climate a building sits in, the physics of heat, light and sound, and the passive strategies that let architecture do most of the work before any machine is switched on. In the second course of the sequence, the students will study the mechanical and electrical systems that handle what passive design cannot.
Passive first: three tiers of design
Environmental designers often describe their work in three tiers. The first tier is the basic form and fabric of the building: its orientation, shape, insulation, airtightness and windows. The second tier is passive systems that use natural energy, such as sun-facing glass, thermal mass, natural ventilation and daylight. The third tier is mechanical and electrical equipment: furnaces, heat pumps, fans, chillers and lamps. Decisions in the first tier are made early, mostly by the architect, and they last as long as the building. Decisions in the third tier are made later, mostly by engineers, and the equipment is replaced every fifteen to thirty years. A building that gets the first two tiers right needs smaller, cheaper and simpler machines, uses less energy for its whole life, and stays habitable when the power fails.
Abernathy puts it more bluntly. 'The engineer can heat any building you give her,' she says. 'The question is how big the furnace has to be, how much the gas or electricity will cost for sixty years, and what happens to the people inside during a three-day ice storm. Those answers are in your hands, not hers.'
The climate of the two cities
Every environmental decision starts with climate. Minneapolis has one of the most extreme climates of any large city in the United States. It lies near the middle of the continent, far from any ocean that might moderate its temperatures, and cold Arctic air flows south across the Prairies without any mountains to stop it. Winters are long, very cold and dry, with clear skies and bright snow for weeks at a time. Summers are short, warm and often humid, with thunderstorms and occasional heat waves. The difference between the coldest and warmest months is more than 60 °F.
Climate data come from weather stations, usually at the airport, and are published as normals: averages over thirty years. Designers use monthly mean temperatures, the extremes used for sizing equipment (called design temperatures), heating and cooling degree-days, solar radiation, wind speed and direction, humidity and precipitation. Climate is also changing: winters are warming faster than summers, and the national codes have begun to use climate data that look ahead rather than only backward. A building designed now will still be standing in 2090, and its designers should test it in the climate of the future as well as the past.
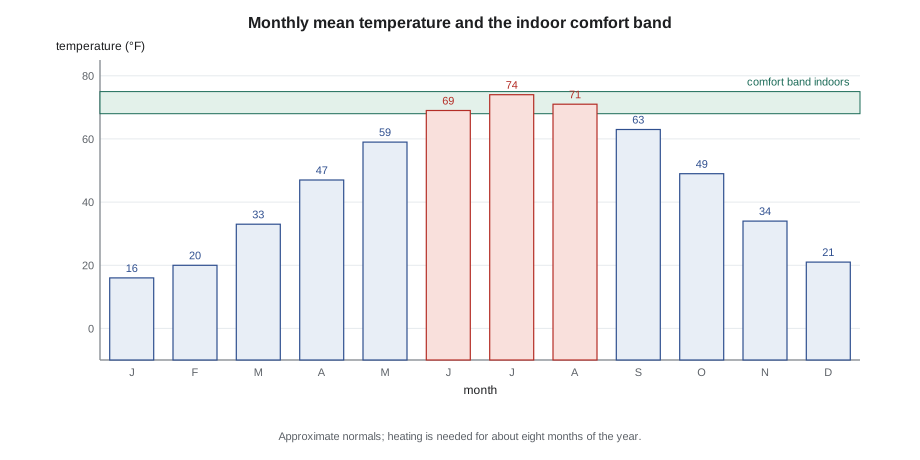
| Month | Mean temperature | Character |
|---|---|---|
| January | about 16 °F | Coldest month; clear, dry, bright snow |
| April | about 47 °F | Rapid thaw; long days arrive |
| July | about 74 °F | Warmest month; humid, thunderstorms |
| October | about 49 °F | Cooling quickly; first snow |
| Annual | about 46 °F | Heating dominates the energy use of most buildings |
Degree-days
A heating degree-day is a simple measure of how cold a climate is over a season. For each day, take the difference between a base temperature, usually 65 °F, and the mean outdoor temperature, counting only days that are colder than the base. Add up the differences over the year. A city with 7,500 heating degree-days needs roughly twice as much heating as one with half that number, for the same building. Cooling degree-days are counted the same way above a base temperature. Degree-days are rough, because buildings gain heat from the sun, lights and people and so do not need heating until the outdoor temperature falls well below the base, but they are a quick way to compare climates and to estimate seasonal energy use.
# Rough heating and cooling degree-days from monthly mean temperatures
temps = [16, 20, 33, 47, 59, 69, 74, 71, 63, 49, 34, 21]      # January to December, in degrees F
days = [31, 28, 31, 30, 31, 30, 31, 31, 30, 31, 30, 31]
base_heat = 65
base_cool = 65
hdd = sum(max(0, base_heat - t) * d for t, d in zip(temps, days))
cdd = sum(max(0, t - base_cool) * d for t, d in zip(temps, days))
print(f"Heating degree-days (base {base_heat}): about {hdd:,.0f}")
print(f"Cooling degree-days (base {base_cool}): about {cdd:,.0f}")
cold = [i + 1 for i, t in enumerate(temps) if t < base_heat - 9]
print("Months needing heating in a typical building:", cold)Heating degree-days (base 65): about 7,347 Cooling degree-days (base 65): about 585 Months needing heating in a typical building: [1, 2, 3, 4, 10, 11, 12]
Monthly means give a lower figure than the published value, because they hide the cold snaps within each month, but the order of magnitude is right. The calculation also shows that heating is needed in about eight months of the year. Cooling, by contrast, is a modest demand: the numbers are small, and a building with good shading and ventilation can often avoid mechanical cooling altogether in houses, although large buildings with many people and machines inside will need it.
The body as a heat engine
The human body produces heat all the time. A person sitting quietly produces about 100 watts, roughly the output of an old incandescent lamp, and a person walking briskly about 250 watts. To keep its core near 37 degrees Celsius (98.6 °F), the body must lose that heat at the same rate as it makes it, no faster and no slower. It loses heat in four ways: by convection to the surrounding air, by radiation to the surrounding surfaces, by evaporation of sweat and moisture from the lungs, and, to a small extent, by conduction to whatever it touches. Comfort is the condition in which this balance is reached without effort: no shivering, no sweating and no part of the body too warm or too cold.
The metabolic rate is measured in met units, where 1 met is the heat production of a seated, relaxed person, about 58 watts per square meter of skin. Clothing insulation is measured in clo units, where 1 clo is a typical business suit and 0.5 clo is light summer clothing. A child playing in a gym may be at 3 met in 0.5 clo; a librarian at a desk at 1.1 met in 1.0 clo. The same room cannot be comfortable for both, which is why the hub's hall and library will need different conditions.
The six factors of comfort
Thermal comfort depends on six factors. Four belong to the environment and two to the person.
- Air temperature, the temperature of the air around the body.
- Mean radiant temperature, the average temperature of the surfaces the body sees, weighted by how much of the view each one fills.
- Humidity, the amount of water vapor in the air, which affects how easily sweat evaporates.
- Air speed, which increases heat loss by convection and evaporation and is felt as a draft or a breeze.
- Metabolic rate, set by activity.
- Clothing insulation.
Architects control the mean radiant temperature more than anyone else on the team. A person beside a large, poorly insulated window in January sees a surface far colder than the room air and loses heat by radiation to it, so she feels cold even when the thermostat reads 72 °F. That is what happened to Ingrid in the warming hut. The cure is not more heat in the air, but warmer surfaces: better windows, insulated walls and floors, or a radiant heater facing the cold surface. A useful approximation, for still air, is the operative temperature, the average of the air temperature and the mean radiant temperature.
Standards: PMV, PPD and the adaptive model
The main North American comfort standard is ASHRAE Standard 55, Thermal Environmental Conditions for Human Occupancy, most recently issued in 2023; it is widely used in Canada as well as the United States, alongside the international standard ISO 7730. Both are built on the work of the Danish engineer P. O. Fanger, who in 1970 published a model that predicts the average thermal sensation of a large group of people from the six factors. The predicted mean vote, or PMV, is a number on a seven-point scale from minus 3 (cold) through 0 (neutral) to plus 3 (hot). The predicted percentage dissatisfied, or PPD, estimates how many people in the group would be uncomfortable. Even at a PMV of zero, about 5 of every 100 people are dissatisfied, because people differ. Standards usually aim for a PMV between minus 0.5 and plus 0.5, which corresponds to fewer than 10 of every 100 people dissatisfied.
Field studies in the 1990s showed that people in naturally ventilated buildings, who can open windows and adjust their clothing, accept a wider range of indoor temperatures than the PMV model predicts, and that the range shifts with the recent outdoor weather. This led to the adaptive comfort model, now part of ASHRAE 55 for occupant-controlled, naturally conditioned spaces. In practice, it means that a well-designed building with operable windows can stay comfortable in summer at temperatures that would draw complaints in a sealed office.
# Predicted mean vote (PMV) and percentage dissatisfied (PPD), ISO 7730 method
import math

def pmv(ta, tr, vel, rh, met, clo):
    pa = rh * 10 * math.exp(16.6536 - 4030.183 / (ta + 235))     # partial pressure of water, Pa
    icl = 0.155 * clo
    m = met * 58.15
    fcl = 1 + 1.29 * icl if icl <= 0.078 else 1.05 + 0.645 * icl
    hcf = 12.1 * math.sqrt(vel)
    taa, tra = ta + 273, tr + 273
    tcla = taa + (35.5 - ta) / (3.5 * icl + 0.1)
    p1 = icl * fcl; p2 = p1 * 3.96; p3 = p1 * 100; p4 = p1 * taa
    p5 = 308.7 - 0.028 * m + p2 * (tra / 100) ** 4
    xn, xf = tcla / 100, tcla / 50
    for _ in range(150):
        if abs(xn - xf) <= 0.00015:
            break
        xf = (xf + xn) / 2
        hc = max(hcf, 2.38 * abs(100 * xf - taa) ** 0.25)
        xn = (p5 + p4 * hc - p2 * xf ** 4) / (100 + p3 * hc)
    tcl = 100 * xn - 273
    loss = (3.05e-3 * (5733 - 6.99 * m - pa) + max(0, 0.42 * (m - 58.15))
            + 1.7e-5 * m * (5867 - pa) + 0.0014 * m * (34 - ta)
            + 3.96 * fcl * (xn ** 4 - (tra / 100) ** 4) + fcl * hc * (tcl - ta))
    return (0.303 * math.exp(-0.036 * m) + 0.028) * (m - loss)

def ppd(v):
    return 100 - 95 * math.exp(-0.03353 * v ** 4 - 0.2179 * v ** 2)

def to_c(t):
    return (t - 32) * 5 / 9

cases = [
    # name                             air    radiant  air speed  RH   met  clo
    ("reader in the middle of the room", 72, 70, 0.1, 30, 1.1, 1.0),
    ("same reader beside a cold window",  72, 61, 0.15, 30, 1.1, 1.0),
    ("after a better window is fitted",   72, 68, 0.1, 30, 1.1, 1.0),
    ("child playing in the hall",         64, 64, 0.2, 35, 3.0, 0.5),
]
for name, ta, tr, v, rh, met, clo in cases:
    ta_c, tr_c = to_c(ta), to_c(tr)
    p = pmv(ta_c, tr_c, v, rh, met, clo)
print(f"{name:34s} operative {(ta + tr) / 2:5.1f} F PMV {p:+.2f} PPD {ppd(p):4.0f} of 100")reader in the middle of the room operative 71.0 F PMV -0.30 PPD 7 of 100 same reader beside a cold window operative 66.5 F PMV -0.91 PPD 22 of 100 after a better window is fitted operative 70.0 F PMV -0.42 PPD 9 of 100 child playing in the hall operative 64.0 F PMV +0.56 PPD 12 of 100
The reader in the middle of the room is close to neutral. Moved to the window, with the same air temperature, she feels slightly cool and the predicted share of dissatisfied people roughly doubles, all because of the cold glass. A better window, with a warmer inner surface, brings her most of the way back. The child in the hall is comfortable in cooler air because he is producing three times as much heat; if the hall were heated like the library, he would be too warm. A note of caution: the PMV model was developed for adults in steady conditions, and it is less reliable for children, older people and people moving in and out of rooms, so designers treat its numbers as a guide rather than a verdict.
Humidity and the psychrometric chart
Air always contains some water vapor, and how much it can hold depends on its temperature: warm air can hold far more than cold air. Relative humidity is the amount of vapor in the air as a fraction of the most it could hold at that temperature. The dew point is the temperature at which the air would become saturated if it were cooled; any surface colder than the dew point will collect condensation. The psychrometric chart plots these properties together: dry-bulb temperature along the bottom, the amount of moisture up the side, and curves of relative humidity sweeping across. Designers use it to show the comfort zone and to see what happens to air as it is heated, cooled, humidified or dried.
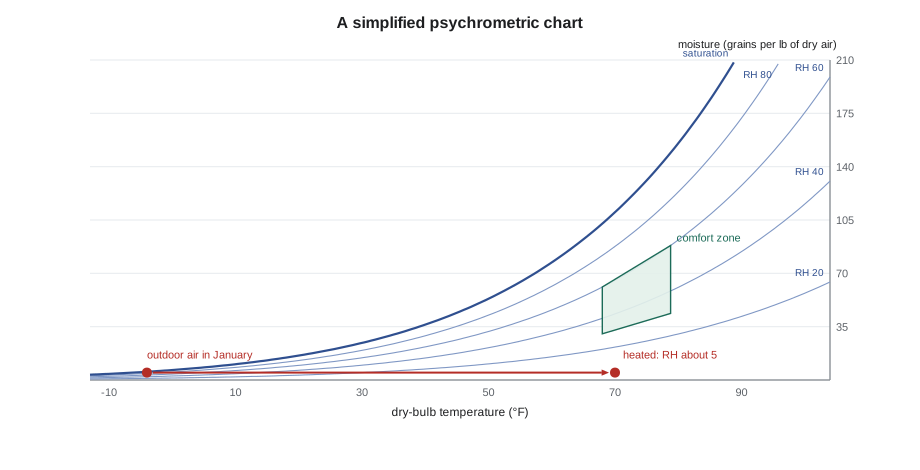
In a cold climate the chart explains two winter problems at once. Outdoor air at minus 13 °F holds very little water, even when it is saturated. Heated to room temperature, the same air has a relative humidity of only a few points, which dries skin and eyes and makes static shocks. Adding moisture helps comfort but raises the dew point, so that windows and the cold corners of walls may collect condensation and, inside walls, mold. Indoor humidity in winter is therefore a balance: high enough for comfort, around 30 to 40 of every 100 points in most buildings, but low enough to keep the envelope dry. Summer brings the opposite problem: warm, humid air that makes sweating ineffective and must be dried by cooling it below its dew point.
Local discomfort
Even when the whole-body balance is right, people complain about local discomfort, and many of these complaints trace back to design.
- Drafts, especially at the ankles and neck, caused by cold air falling down tall windows or leaking through gaps.
- Radiant asymmetry, when one side of the body faces a much colder or warmer surface than the other, such as a large window or a low, hot ceiling.
- Cold or warm floors, felt through the feet, important in daycares where children sit and play on the floor.
- Vertical temperature differences, when warm air collects near the ceiling and the head is much warmer than the feet.
In the warming hut, all four were present: the cold glass, the drafty door, the cold floor slab and the warm air pooling under the roof. Each has an architectural answer, which the students will develop through the term.
Worked problem
A reading seat beside a window
The library of the community hub will have a long window seat facing south across the greenway. The librarian wants it to be the favorite place to read in January. The room will be heated to 70 °F. The window manufacturer says that with a double-glazed unit the inner surface of the glass will be at about 52 °F on the design cold day, and with a triple-glazed unit at about 61 °F. About a third of the reader's view is window; the rest of the room's surfaces are close to air temperature. Estimate the operative temperature for each option.
Show solution
- Mean radiant temperature is roughly the view-weighted average of surface temperatures: two thirds at 70 °F and one third at the glass temperature.
- Double glazing: (2 × 70 + 52) / 3 ≈ 64 °F. Operative temperature ≈ (70 + 64) / 2 ≈ 67 °F.
- Triple glazing: (2 × 70 + 61) / 3 ≈ 67 °F. Operative temperature ≈ (70 + 67) / 2 ≈ 68.5 °F.
- The triple-glazed window makes the seat feel about 1.5 °F warmer without any extra heating, and it reduces the cold downdraft along the glass.
Answer: The window choice changes the comfort of the seat as much as turning up the thermostat would, and it saves energy instead of using it.
Exercise 1: a comfort survey
This exercise takes about one week.
- Choose a room you use every day, at home or at school, and measure air temperature, surface temperatures, humidity and, if you can, air speed at three places in it at the same time of day on three days.
- Estimate the mean radiant temperature and operative temperature at each place.
- Note your clothing and activity, and record how comfortable you felt on the seven-point scale.
- Plot the room's conditions on a psychrometric chart and mark the comfort zone.
- Identify the main source of any discomfort and propose an architectural cure.
Common mistakes
MistakeTreating the thermostat reading as the comfort of the room.
InsteadConsider surface temperatures, humidity, air speed, clothing and activity as well.
MistakeDesigning every room for the same temperature.
InsteadSet conditions by activity: a gym, a library and a daycare need different temperatures.
MistakeIgnoring cold windows because the heating can cope.
InsteadSpecify windows with warm inner surfaces and place heat where the cold surfaces are.
MistakeHumidifying winter air without thinking about the envelope.
InsteadKeep indoor humidity moderate and make the envelope airtight so that moist air cannot reach cold surfaces.
MistakeUsing past climate data only.
InsteadTest designs against future climate data as well as the historical record.
Summary and key terms
- Environmental design works in three tiers: form and fabric, passive systems, and mechanical equipment; the first two are mainly the architect's.
- Minneapolis has a continental climate with long, cold, dry winters and short, warm, humid summers; heating dominates.
- Degree-days compare the severity of climates and help estimate seasonal energy use.
- Comfort depends on air temperature, mean radiant temperature, humidity, air speed, activity and clothing.
- PMV and PPD predict the comfort of a group; the adaptive model allows wider ranges in naturally ventilated buildings.
- Heating cold air lowers its relative humidity; adding moisture raises the risk of condensation on cold surfaces.
- Degree-day
- A measure of how much, and for how long, the outdoor temperature falls below (or rises above) a base temperature.
- Mean radiant temperature
- The average temperature of the surfaces around a person, weighted by how much of the view each fills.
- Operative temperature
- A combined measure of air and radiant temperature, roughly their average in still air.
- Met
- A unit of metabolic rate equal to that of a seated, relaxed person.
- Clo
- A unit of clothing insulation; 1 clo is a typical business suit.
- PMV
- Predicted mean vote, the average thermal sensation of a group on a scale from −3 to +3.
- Dew point
- The temperature at which air becomes saturated and condensation begins.
Practice problems
Work each problem on paper first, then reveal the answer to check.
A room has air at 72 °F and a mean radiant temperature of 64 °F. What is the approximate operative temperature?
Show answer
About 68 °F, the average of the two.
Why does heated winter air feel dry?
Show answer
Cold outdoor air holds little moisture; heating it raises the amount it could hold, so its relative humidity falls sharply.
A city has about twice as many heating degree-days as another. What does this suggest?
Show answer
The same building would need roughly twice as much heating energy there.
Name two kinds of local discomfort and one design cure for each.
Show answer
Drafts from cold windows (better glazing or heat below the window); cold floors (insulated slab or floor heating).
Why might a child in a gym be comfortable in a cooler room than a reader in a library?
Show answer
The child's metabolic rate is much higher, so the body produces more heat.
Lesson quiz · 5 questions
Score 60% or more to complete this lesson.
Create a free account to save your progress, take quizzes and earn a certificate.