
APT-210 · Lesson 9 of 12 · 19 min
Inventory software and reports
▶ Video coming soon A video version of this lesson is on the way.
On Friday, November 6, Rolf printed the October month-end reports and spread them across the table in his office. There were six: the monthly parts recap, stock status, the aging report, the lost sales report, the adjustment report and the open special orders. He asked Talia to sit with him. "The system knows everything that happened last month," he said. "It just doesn't know what it means. That's our job. Let's read these the way you'd read a vehicle's scan data: look for what's out of range, then ask why."
Every modern parts department runs on a dealer management system, or DMS: software that handles parts, service, vehicle sales and accounting for the whole dealership (APT-110 lesson 9). Aftermarket stores and heavy equipment dealers use similar systems. This lesson covers the inventory side of that software: what it records, the settings that drive it, the main reports, and how to read them to make better decisions.
What the system records
For every part number, the DMS keeps a part record, sometimes called a master record, with three kinds of information:
| Kind | Examples |
|---|---|
| Description and pricing | Part number, description, source, cost, list price, price codes, supersession links |
| Location and stocking | Bin and overflow locations, ABC class, minimum, maximum, reorder point, phase-in and phase-out status |
| History | On hand, on order, on back order, sales by month for 12 to 24 months, last sale date, last receipt date, lost sales |
The transaction history behind each part records every movement: each sale, receipt, return, transfer, adjustment and count, with the date, quantity, document number and the person who entered it. When the on-hand quantity looks wrong, the history usually explains why (lesson 7).
The manufacturer also sends price and parts updates to the DMS, often weekly or monthly, with new parts, new prices and new supersessions. These updates change costs and list prices automatically, so a part's price on Tuesday may differ from its price on Monday. Parts technicians should always quote from the current system price, not from memory.
Settings that drive the system
Much of the DMS's inventory work is automatic, controlled by settings the parts manager chooses. The most important are:
- Stocking rules: how many months of sales history the system looks at, how many sales are needed before a part is phased in, and how long without sales before a part is phased out (lessons 3 and 6).
- Order settings: the days of supply to keep, the lead time for each source, the safety stock, and how the suggested order is calculated.
- Classification: how the system assigns ABC classes and other codes.
- Lost sale rules: whether and how lost sales count toward stocking decisions.
- Pricing rules: the price matrix and discounts for each type of customer (APT-130 lesson 4).
A system is only as good as its settings. A phase-in rule that is too loose fills the shelves with parts that sold once. A lead time that is too short leaves the department out of stock. The parts manager reviews the settings at least once a year, and whenever results suggest they are wrong. Many manufacturers also run inventory management programs that suggest or set these values for their dealers.
The monthly parts recap
The monthly recap, or parts financial statement, summarizes the department's results for the month and the year to date. It shows sales and gross profit by type of customer (shop, wholesale, retail, warranty, internal), the inventory value, and key measures such as turns and fill rate. The general manager and the manufacturer both review it.
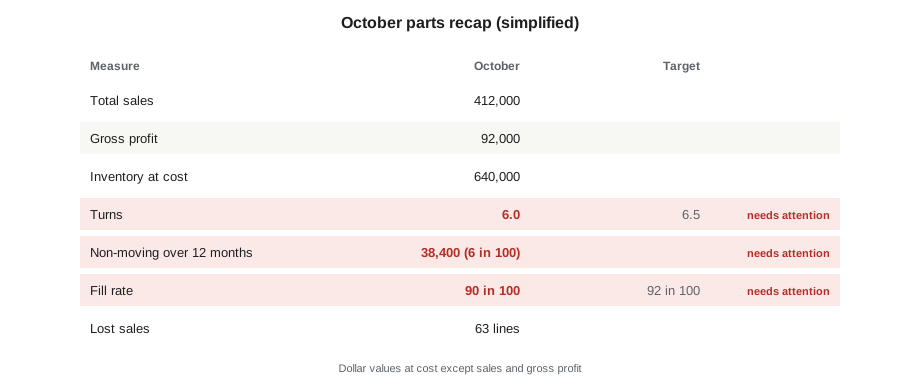
Rolf's habit was to read the recap from the bottom up: first the measures that were off target, then the numbers behind them. In October, turns were 6.0 against a target of 6.5, non-moving stock was 6 in 100 of the inventory, and the fill rate was 90 in 100 against 92. All three pointed at the same thing: some money was tied up in the wrong parts.
Stock status
The stock status report lists each part with its on-hand, on-order and back-order quantities, its stocking settings and its recent sales. It is the working report for checking whether settings fit demand. Useful ways to filter it are:
- Parts with on hand above the maximum, which show overstock, often from a one-time large order or a return.
- Parts with on hand at zero but with recent sales, which show stock-outs.
- Parts with negative on hand, which show errors (lesson 7).
- Parts whose settings were changed by hand, which may need review.
- Parts on back order from the supplier, with the expected dates.
The aging report
The aging report groups the inventory by how long since each part last sold, usually in bands such as 0 to 3, 4 to 6, 7 to 9, 10 to 12 and over 12 months (lesson 6). Its total by band shows how healthy the inventory is; its detail lists the parts to act on.
| Months since last sale | Value at cost | Share of inventory |
|---|---|---|
| 0 to 3 | 512,000 dollars | 80 in 100 |
| 4 to 6 | 57,600 dollars | 9 in 100 |
| 7 to 9 | 19,200 dollars | 3 in 100 |
| 10 to 12 | 12,800 dollars | 2 in 100 |
| Over 12 | 38,400 dollars | 6 in 100 |
| Total | 640,000 dollars | 100 in 100 |
The bands between 7 and 12 months are the ones to watch most closely, because those parts can still be returned or transferred before they become truly non-moving. Rolf asked Sasha to review the 7-to-12-month list every month and to flag parts for the next return window.
Lost sales
A lost sale is recorded when a customer asks for a part the department does not have and does not order it (lesson 1). Most systems let counter staff record a lost sale with a few keystrokes, and some record one automatically when a quote is not turned into a sale. The lost sales report lists these by part, with the number of times each was asked for.
Lost sales are important for two reasons. First, they show demand the sales history does not, because a part that is never in stock never sells and so never seems to be needed. Second, they show fill rate problems directly. In October, the report listed 63 lost sale lines. Rolf sorted them by part number and found that 11 parts had been asked for three or more times. Those 11 became candidates for phase-in.
The report is only useful if lost sales are recorded honestly and consistently. Some counter staff skip it when they are busy, which hides demand. Others record lost sales for parts no customer could reasonably expect to be in stock, which inflates it. Rolf's rule was simple: record it if a reasonable customer expected the part to be on the shelf and left without it.
Other useful reports
| Report | What it shows | How it is used |
|---|---|---|
| Adjustment report | Every change to on hand outside normal transactions | Find error patterns and possible theft (lesson 8) |
| Open special orders | Parts ordered for customers, with deposits and dates | Follow up, and catch parts that were never picked up (lesson 10) |
| Open back orders | Supplier back orders with expected dates | Tell customers, find other sources |
| Returns eligibility | Parts eligible for the manufacturer return program | Plan each return window (lesson 6) |
| Emergency order report | Emergency orders, costs and reasons | Find parts that should be stocked (lesson 4) |
| Cycle count results | Counts, matches and accuracy | Track accuracy over time (lesson 7) |
Reading reports well
Reports turn data into decisions only when someone reads them with questions in mind. Rolf taught Talia four habits:
- Compare to a target or to last month. A number alone means little; a change or a gap from a target is a signal.
- Look at the biggest items first. Sort by value, not by part number. A few large items usually explain most of a problem.
- Check the detail before acting. A part with a big overstock may be a special order waiting for pickup, not a mistake.
- Write down the action and the owner, and check next month that it was done.
Most systems can also export reports to a spreadsheet for sorting and charts. A spreadsheet is useful for one-off analysis, but the DMS remains the record. Changes to stock settings, prices or quantities must be made in the DMS, not in a copy.
Data security matters too. The DMS holds customer names, addresses and vehicle information as well as parts data. Reports that include customer details should not be emailed outside the dealership or left on the counter, and staff should use their own login so the history shows who did what.
Rolf's October actions
By the end of the hour, Rolf's notes on the October reports listed six actions: phase in 11 parts with repeated lost sales, prepare a return of eligible parts from the over-12-month list, lower the maximum on 40 parts with on hand well above the maximum, investigate nine negative on-hand parts, chase three special orders more than 30 days old, and review the lead time for the Tessaro regional warehouse, which had been slower in October than the system assumed. Each action had a name beside it. Talia's name was beside the special orders.
A worked look at the stock status report
On the stock status report, Rolf asked Talia to filter for parts with on hand above the maximum and to sort the result by the value of the extra stock. Forty parts appeared. The top line was a set of floor mats with 24 on hand against a maximum of 6. The history showed why: a fleet customer had ordered 20 sets and then canceled after they arrived. The next lines were three batteries bought on a pre-season promotion, a coolant bought in bulk, and a brake rotor whose maximum had been raised by hand the year before and never lowered.
Each line had a different fix. The floor mats might go back to the supplier under the return program or be offered to the fleet customer's other branches. The batteries and the coolant would sell down during the winter if no more were ordered. The rotor's maximum needed to be put back under the system's control. The report itself did not say any of this; reading the detail did.
Talia noticed something else. Several of the parts on the overstock list were also on the lost sales report under a different number, a newer supersession. Customers were asking for the new number, the system was recording a lost sale, and the old stock sat on the shelf. Linking the two numbers in the system turned the old stock back into stock that could be sold.
Keeping reports useful
Departments often run more reports than anyone reads. A report that is printed every month and filed without action costs paper and time. Rolf kept the list short: six reports each month, reviewed in a fixed order, with an action list at the end. He also asked the dealer system's support team to set up saved filters for the views he used most, such as overstock by value and 7-to-12-month aging, so that they took seconds to run.
When a report shows something unexpected, the first question is whether the report is right. A sudden jump in non-moving stock might be real, or it might be a price update that raised the cost of many slow parts at once. A drop in the fill rate might be real, or it might be a change in how lost sales were recorded. Checking a few lines of detail before reacting avoids chasing problems that are not there.
Learning the system
Every dealer system is different, and parts technicians learn their own system mostly on the job. Talia found three habits useful. She kept a notebook of the screens and reports she used, with the steps for each. She asked the system's built-in help or the vendor's training material before asking a co-worker, so she understood the reason as well as the keystrokes. And she practiced in the system's training or test area, where one existed, before trying something new on live data. Within a few weeks she could run every report on Rolf's list herself.
Reports also help the department talk with the rest of the dealership. The service manager understands a list of special orders older than 30 days far better than a general complaint about clutter, and the general manager understands an aging report with a total far better than a feeling that the shelves are full. Clear reports turn opinions into facts that everyone can work from.
Common mistakes
MistakeReading a report without a target or comparison.
InsteadCompare each number with a target or last month.
MistakeSorting by part number.
InsteadSort by value to see the biggest items first.
MistakeChanging settings in a spreadsheet copy.
InsteadMake every change in the DMS, which is the record.
MistakeSkipping lost sale entries when busy.
InsteadRecord every reasonable lost sale; it shows hidden demand.
MistakeSharing reports with customer details carelessly.
InsteadKeep customer data inside the dealership and use your own login.
Summary and key terms
- The DMS keeps a part record and a transaction history for every part number.
- Settings such as stocking rules, lead times and classifications drive the system's automatic work.
- The monthly recap summarizes sales, gross profit, inventory and key measures.
- The stock status report checks settings against demand; the aging report shows how long parts have sat.
- Lost sales show demand the sales history cannot.
- Read reports against targets, biggest items first, check detail before acting, and record actions with owners.
- Dealer management system (DMS)
- Software that runs a dealership's parts, service, sales and accounting.
- Part record
- The system's record of a part number, with its description, pricing, settings and history.
- Transaction history
- The list of every movement of a part.
- Monthly recap
- A monthly summary of the parts department's financial results and measures.
- Stock status report
- A report of each part's quantities, settings and sales.
- Aging report
- A report grouping stock by time since last sale.
- Lost sales report
- A report of parts customers asked for that were not in stock.
Practice problems
Work each problem on paper first, then reveal the answer to check.
Name the three kinds of information in a part record.
Show answer
Description and pricing, location and stocking, history.
Which report would show parts with on hand above the maximum?
Show answer
The stock status report.
In an aging report, 25,600 dollars of a 640,000-dollar inventory is over 12 months. What share is that?
Show answer
4 in 100.
Why are lost sales important for stocking decisions?
Show answer
They show demand for parts that never sell because they are never in stock.
Where should changes to stock settings be made?
Show answer
In the DMS, not in a spreadsheet copy.
Lesson quiz · 5 questions
Score 60% or more to complete this lesson.
Create a free account to save your progress, take quizzes and earn a certificate.