
APT-210 · Lesson 11 of 12 · 30 min
Calculating inventory metrics
▶ Video coming soon A video version of this lesson is on the way.
A few days after the October reports, Rolf gave Talia a blank sheet with six boxes drawn on it and the year's figures for the department. "Walter asks me for these every quarter," he said. "So does Tessaro. I want you to be able to work every one of them out by hand, so you know what the system is doing when it prints them. Then you'll know when it's wrong." The six boxes were labeled turns, months of supply, GMROI, obsolescence, fill rate and first-time fill.
Earlier lessons introduced these measures one at a time. This lesson brings them together, with the formulas, a complete worked set for Linmore Tessaro, and the most common mistakes in calculating and reading them. Every measure answers a simple question. Turns and months of supply ask whether the inventory is the right size. GMROI asks whether it earns enough. Obsolescence asks whether it is healthy. Fill rate and first-time fill ask whether it serves customers.
The figures needed
All of the measures come from a small set of figures, most of them on the monthly recap (lesson 9). For Linmore Tessaro's last 12 months, they were:
| Figure | Value |
|---|---|
| Parts sales, 12 months | 4,944,000 dollars |
| Cost of parts sold, 12 months | 3,840,000 dollars |
| Gross profit, 12 months | 1,104,000 dollars |
| Average inventory at cost | 640,000 dollars |
| Non-moving stock, over 12 months | 38,400 dollars |
| Requests for stock parts, sample month | 412 lines; 371 filled from stock |
| Requests at first contact, sample month | 1,780 lines; 1,612 filled at once |
Two rules matter before any calculation. First, inventory is always measured at cost, never at list price. Second, inventory should be an average over the period, not a single month-end figure, because one month can be unusually high or low (lesson 5). Using list price or a single unusual month are the two most common reasons two people get different answers for the same department.
Inventory turns
Turns measure how many times the inventory is sold and replaced in a year.
Worked problem
Turns
Cost of parts sold was 3,840,000 dollars and average inventory 640,000 dollars. What are the turns?
Show solution
- Turns:
- \[3{,}840{,}000 \div 640{,}000 = 6.0\]
Answer: The department turns its inventory 6.0 times a year. Walter's target was 6.5. Manufacturers often publish targets for their dealers; many fall somewhere around 5 to 8 a year for a franchised dealer, but the right target depends on the make and the market.
A common error is to divide sales by inventory instead of cost of sales by inventory. That gives 4,944,000 ÷ 640,000, about 7.7, which looks better than the truth because sales include the gross profit.
Months of supply
Months of supply turns the same idea around: how many months the current inventory would last at the current rate of sales, if nothing more were bought.
Worked problem
Months of supply
Using the same figures, what is the months of supply?
Show solution
- Cost of parts sold per month:
- \[3{,}840{,}000 \div 12 = 320{,}000\]
- Months of supply:
- \[640{,}000 \div 320{,}000 = 2.0\]
Answer: The inventory would last about 2.0 months. Months of supply and turns always agree: 12 ÷ 6.0 = 2.0.
Months of supply also works for a single part. A part with 40 on hand that sells 12 a month has 40 ÷ 12, about 3.3 months of supply. If its maximum is meant to be about one month, it is overstocked.
GMROI
Gross margin return on inventory investment, or GMROI, measures how many dollars of gross profit the department earns in a year for each dollar of inventory, at cost. It combines profit and turns in one number, and many managers consider it the best single measure of inventory performance.
Worked problem
GMROI
Gross profit was 1,104,000 dollars and average inventory 640,000 dollars. What is the GMROI?
Show solution
- GMROI:
- \[1{,}104{,}000 \div 640{,}000 = 1.725\]
Answer: The department earns about 1.73 dollars of gross profit a year for each dollar of inventory. GMROI rises when the department either earns more margin on its sales or carries less inventory for the same sales.
GMROI can also be found from margin and turns. Gross margin is 1,104,000 ÷ 4,944,000, about 0.223. The ratio of sales to inventory is 4,944,000 ÷ 640,000, about 7.725. Multiplied together they give about 1.725, the same answer. This shows the two levers: price and margin on one side, inventory size on the other.
Obsolescence
The obsolescence ratio, sometimes called the non-moving ratio, is the share of the inventory that has not sold for a set period (lesson 6).
Worked problem
Obsolescence ratio
Non-moving stock over 12 months was 38,400 dollars, with inventory at 640,000 dollars. What is the ratio?
Show solution
- Ratio:
- \[38{,}400 \div 640{,}000 = 0.06\]
Answer: Six in every 100 dollars of inventory had not sold in more than a year. The period used (9 months, 12 months) must be stated, because the ratio changes with it.
Fill rate and first-time fill
Fill measures look at customers instead of dollars. There are two common versions, and it matters which one is being used.
- Fill rate (sometimes called stock fill) is the share of requests for stock parts that were filled from stock. It measures whether the stocking settings work.
- First-time fill is the share of all requests that were filled at the first contact, from stock or from another immediate source. It measures the customer's experience.
Worked problem
Two fill measures
In a sample month, the department had 412 lines for stock parts and filled 371 from stock. Across all requests, it had 1,780 lines and filled 1,612 at first contact. What are the two measures?
Show solution
- Fill rate:
- \[371 \div 412 \approx 0.90\]
- First-time fill:
- \[1{,}612 \div 1{,}780 \approx 0.906\]
Answer: The fill rate is about 90 in 100 and first-time fill about 91 in 100. The two measures happen to be close here, but they measure different things.
Fill rates depend heavily on what is counted. Some departments count lines, others count pieces, and some leave out requests for parts that are not normally stocked. Comparing a fill rate with another department's is only fair if both use the same definition. Lost sales that are not recorded (lesson 9) also make fill rates look better than they are.
Putting the measures together
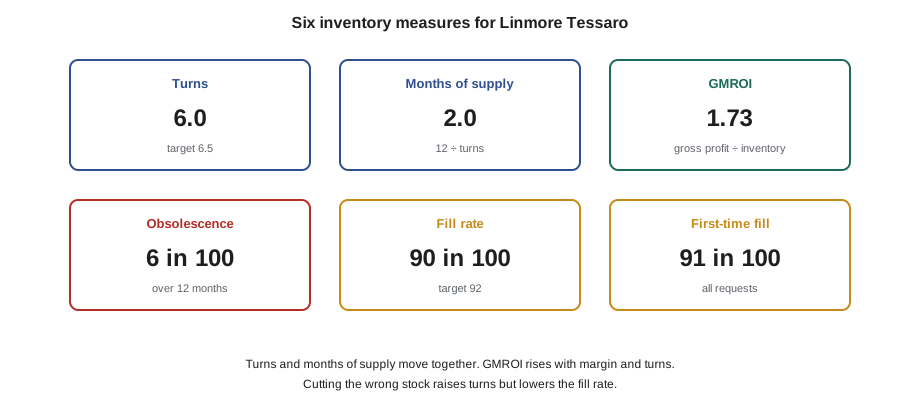
The measures pull against each other, and that is what makes inventory management a balance (lesson 1). Cutting inventory raises turns and GMROI, but if the cuts are made in the wrong parts, the fill rate falls and customers go elsewhere. Adding inventory raises the fill rate, but if the new stock is the wrong parts, turns fall and obsolescence rises. A department that looks at only one measure can make another one worse without noticing.
The best improvements raise turns and fill rate together, by moving money from parts that do not sell into parts that do. That is what Rolf's October actions were designed to do: return non-moving parts, lower maximums on overstocked parts, and phase in parts with repeated lost sales.
Worked problem
The effect of a return
Suppose the department returns the 31,200 dollars of eligible parts from lesson 6 and nothing else changes. If average inventory falls by that amount over the next year, what happens to turns and GMROI?
Show solution
- New average inventory:
- \[640{,}000 - 31{,}200 = 608{,}800\]
- New turns:
- \[3{,}840{,}000 \div 608{,}800 \approx 6.31\]
- New GMROI:
- \[1{,}104{,}000 \div 608{,}800 \approx 1.81\]
Answer: Turns would rise from 6.0 to about 6.3 and GMROI from about 1.73 to about 1.81, with no change in sales, because the parts returned were not selling.
Common mistakes
Talia's first attempt at the six boxes had two errors. She used the September month-end inventory of 668,000 dollars instead of the 12-month average, which made turns look lower than they were. And she divided sales by inventory for turns. Rolf did not mind. "Everybody does that once," he said. "The trick is to check that your answers fit together. If turns is six, months of supply has to be two. If they don't agree, something's wrong."
Comparing with targets and with other stores
Each measure means more when it is compared with something. Three comparisons are useful. The first is the department's own history: is this month better or worse than the same month last year, and what is the trend over the last 12 months? The second is the department's target, set by the dealer or the manufacturer. The third is other stores: many manufacturers and dealer groups publish averages for similar dealers, sometimes split by size or region.
Comparisons with other stores need care. A store in a rural area that sells parts for older vehicles and heavy farm use will usually have lower turns and more slow stock than a city store that sells mainly maintenance parts for newer vehicles. A store with a large wholesale business may have different margins. Rolf compared Linmore Tessaro with the district average from Tessaro's quarterly report, but he always read the comparison alongside the store's mix of customers.
| Measure | Linmore Tessaro | Target | Better when |
|---|---|---|---|
| Turns | 6.0 | 6.5 | Higher |
| Months of supply | 2.0 | About 1.8 | Lower |
| GMROI | 1.73 | Set by the dealer | Higher |
| Obsolescence, over 12 months | 6 in 100 | Under 5 in 100 | Lower |
| Fill rate | 90 in 100 | 92 in 100 | Higher |
| First-time fill | 91 in 100 | Set by the dealer | Higher |
Measures over time
A single month's measures can be distorted by a large order, a return, a price update or a busy week. Most departments look at a rolling 12-month figure for turns and GMROI, so that each month adds the newest month and drops the oldest, and the trend shows clearly. Fill rates are often tracked weekly or monthly, because they respond quickly to stocking changes.
Rolf's rule for reading a trend was to wait for three months in the same direction before deciding it was real. One month of falling turns could be a large pre-season order. Three months in a row meant something had changed. He also wrote a short note on the monthly report for any unusual event, such as a large return or a price update, so that anyone reading the figures later would understand a sudden step up or down.
Using the measures to set priorities
The measures are most useful when they point to action. Low turns with a high obsolescence ratio point to returns and phase-out. Low turns with a low obsolescence ratio point to maximums that are too high on active parts. A low fill rate with many lost sales points to phase-in. A low fill rate with few lost sales recorded may mean the lost sales are simply not being entered. Talia wrote these four pairs on the back of Rolf's sheet, and he told her to keep it.
Checking the system's figures
Most dealer systems calculate these measures automatically, but the definitions they use are not always obvious. Some systems calculate turns from the month-end inventory instead of an average; some count fill rate by pieces instead of lines; some leave out special orders. The only way to know is to check one month by hand, as Talia did, and compare. If the hand calculation and the system disagree, the reason is usually a definition, and the fix is to write down which definition the department uses so that everyone reads the reports the same way.
Talia's corrected sheet matched the system's figures for turns, months of supply and GMROI. Her fill rate came out slightly lower than the system's, and the reason turned out to be that the system left out requests for parts that were not normally stocked. Rolf added a line to the monthly report explaining the definition, so that Walter would read the number correctly.
A quick check of every answer
Before handing in the sheet, Talia ran four checks that Rolf had shown her. Turns multiplied by months of supply should equal 12. GMROI should be close to gross margin multiplied by the ratio of sales to inventory. The fill rate should be below 1, and lower if many lost sales were recorded. And every inventory figure on the sheet should be at cost. Any answer that failed a check was worked again before it went to Walter. The checks take a minute and catch most of the mistakes described in this lesson.
Common mistakes
MistakeUsing list price for inventory.
InsteadAlways use inventory at cost.
MistakeUsing sales instead of cost of sales for turns.
InsteadTurns = cost of parts sold ÷ average inventory at cost.
MistakeUsing one month-end inventory figure.
InsteadUse the average inventory over the period.
MistakeComparing fill rates with different definitions.
InsteadCheck what each measure counts before comparing.
MistakeImproving one measure without watching the others.
InsteadLook at all six together.
Summary and key terms
- Turns = cost of parts sold ÷ average inventory at cost.
- Months of supply = inventory at cost ÷ monthly cost of parts sold; it equals 12 ÷ turns.
- GMROI = gross profit ÷ average inventory at cost; it combines margin and turns.
- Obsolescence ratio = non-moving stock ÷ inventory, for a stated period.
- Fill rate measures stock requests filled from stock; first-time fill measures all requests filled at first contact.
- The measures pull against each other; the best changes move money from slow parts into parts that sell.
- Turns
- The number of times inventory is sold and replaced in a year.
- Months of supply
- How many months the inventory would last at the current rate of sales.
- GMROI
- Gross profit earned in a year for each dollar of average inventory at cost.
- Obsolescence ratio
- The share of inventory that has not sold for a set period.
- Fill rate
- The share of requests for stock parts filled from stock.
- First-time fill
- The share of all requests filled at the first contact.
Practice problems
Work each problem on paper first, then reveal the answer to check.
Cost of sales is 2,400,000 dollars and average inventory 480,000 dollars. What are the turns?
Show answer
5.0.
What is the months of supply for the same department?
Show answer
12 ÷ 5.0 = 2.4 months.
Gross profit is 600,000 dollars and average inventory 480,000 dollars. What is the GMROI?
Show answer
1.25.
Non-moving stock is 24,000 dollars of a 480,000-dollar inventory. What is the obsolescence ratio?
Show answer
0.05, or 5 in 100.
Of 500 stock requests, 460 were filled from stock. What is the fill rate?
Show answer
0.92, or 92 in 100.
Lesson quiz · 5 questions
Score 60% or more to complete this lesson.
Create a free account to save your progress, take quizzes and earn a certificate.