
AI-350 · Lesson 4 of 12 · 24 min
Efficient networks, evaluation and calibration
Lesson 3 explained how convolutional networks are built and trained, and how transfer learning makes them practical with modest data. Building a vision system that works in the field requires more: choosing an architecture that fits the device and latency budget, assembling and splitting datasets so that evaluation is honest, measuring performance in ways that match the application, making the model's confidence trustworthy, handling rare classes and anomalies, and checking that the model keeps working when the cameras, lighting or population change. This lesson covers efficient architectures for edge devices, dataset practice, evaluation metrics for classification, calibration, class imbalance and anomaly detection, and robustness testing.
Efficient architectures
Many vision models run on phones, cameras, drones, vehicles and factory controllers with limited compute, memory and power, often within a strict latency budget such as 33 ms per frame for 30 frames per second. Efficient architectures reduce computation with a few key ideas:
- Depthwise separable convolutions (MobileNet, 2017) split a standard convolution into a depthwise convolution, which filters each channel separately with its own \(k \times k\) kernel, and a pointwise 1 × 1 convolution, which mixes channels. For a 3 × 3 kernel this cuts computation by about 8 to 9 times with a modest loss of accuracy.
- Inverted residual blocks with linear bottlenecks (MobileNetV2) expand channels, apply a depthwise convolution, and project back down, with a residual connection.
- Compound scaling (EfficientNet, 2019) scales depth, width and input resolution together by fixed ratios, rather than one at a time, giving better accuracy for a given compute budget.
- Neural architecture search automates the search for efficient designs on a target device.
# Parameters and multiply-accumulate operations (MACs): standard versus depthwise separable convolution
def standard(h, w, cin, cout, k):
    params = k * k * cin * cout
    return params, params * h * w

def separable(h, w, cin, cout, k):
    dw = k * k * cin                  # depthwise: one k x k filter per input channel
    pw = cin * cout                   # pointwise: 1 x 1 convolution mixing channels
    return dw + pw, (dw + pw) * h * w

for h, cin, cout in ((112, 32, 64), (56, 128, 128), (14, 512, 512), (7, 1024, 1024)):
    p1, m1 = standard(h, h, cin, cout, 3)
    p2, m2 = separable(h, h, cin, cout, 3)
    print(f"{h:3d}x{h:<3d} {cin:4d}->{cout:<4d}: standard {p1 / 1e3:7.1f}k params {m1 / 1e6:7.1f}M MACs | separable {p2 / 1e3:6.1f}k params {m2 / 1e6:6.1f}M MACs | {m1 / m2:4.1f}x fewer")
# Rough latency on a device sustaining 200 GMAC/s with 30% utilization, for whole networks
for name, gmacs in (("ResNet-50", 4.1), ("MobileNetV2", 0.30), ("EfficientNet-B0", 0.39), ("ViT-B/16", 17.6)):
print(f"{name:16s} {gmacs:5.2f} GMACs per image -> about {gmacs / (200 * 0.3) * 1000:6.1f} ms per image")112x112 32->64 : standard 18.4k params 231.2M MACs | separable 2.3k params 29.3M MACs | 7.9x fewer 56x56 128->128 : standard 147.5k params 462.4M MACs | separable 17.5k params 55.0M MACs | 8.4x fewer 14x14 512->512 : standard 2359.3k params 462.4M MACs | separable 266.8k params 52.3M MACs | 8.8x fewer 7x7 1024->1024: standard 9437.2k params 462.4M MACs | separable 1057.8k params 51.8M MACs | 8.9x fewer ResNet-50 4.10 GMACs per image -> about 68.3 ms per image MobileNetV2 0.30 GMACs per image -> about 5.0 ms per image EfficientNet-B0 0.39 GMACs per image -> about 6.5 ms per image ViT-B/16 17.60 GMACs per image -> about 293.3 ms per image
Depthwise separable layers need about 8 to 9 times fewer operations and parameters. Whole-network compute differs by more than an order of magnitude between MobileNetV2 and ResNet-50, and by more again for a ViT-Base, which is why mobile and embedded systems use efficient CNNs or small, distilled transformers. These latency figures are only rough guides: real speed depends on memory bandwidth, how well the operations map to the hardware, batch size and the runtime, so models should be benchmarked on the target device. Quantizing to 8-bit integers, pruning and knowledge distillation (AI-340, Lesson 10) reduce cost further, and runtimes such as TensorRT, Core ML, TensorFlow Lite and ONNX Runtime optimize models for specific hardware.
Building datasets
Data quality usually matters more than architecture. Good practice for vision datasets:
- Cover the real conditions: cameras, viewpoints, lighting, weather, seasons, backgrounds and object variations that the deployed system will see, including rare but important cases.
- Write clear labeling guidelines with examples of edge cases, measure agreement between annotators, and review a sample of labels. Label noise of a few percent is common in large datasets and can be found by examining training examples the model gets confidently wrong.
- Split data so that evaluation is honest. Images from the same video, patient, product batch, location or day are highly correlated; if some go to training and others to testing, the test score is inflated. Split by these groups, not by individual images, and remove near-duplicates across splits.
- Keep a held-out test set that is not used for any decision during development, and a separate validation set for model selection and tuning.
- Document the dataset: sources, collection dates, consent, demographics where relevant, labeling process and known limitations (datasheets for datasets).
Worked problem
Leakage in a medical imaging split
A team training a skin lesion classifier has 12,000 images from 3,000 patients, about four per patient, and splits the images randomly 80/20. The test accuracy is 94%, but in a pilot at a new clinic it drops to 81%. What went wrong, and how should the split be made?
Show solution
- Random image-level splitting put images of the same patient, and often the same lesion, in both training and test sets, so the model partly recognized patients and lesions it had already seen.
- Split by patient so that all images of a patient are in one set; better still, hold out an entire clinic or time period to estimate performance on new sites.
- Check for other leakage: rulers, ink markings or camera types correlated with the diagnosis.
Answer: Patient-level and site-level splits give realistic estimates; image-level random splits inflate accuracy when images are correlated. The drop at the new clinic also reflects distribution shift, which only external validation reveals.
Evaluating classifiers
Accuracy alone can mislead, especially with imbalanced classes: a defect detector that always predicts "good" is 99% accurate if 1% of parts are defective. Better tools:
- The confusion matrix, counting predictions against true classes, shows which classes are confused with which.
- Precision, recall and F1 for each class (AI-210), and their macro-average across classes, which weights rare classes equally.
- Top-5 accuracy for problems with many similar classes, such as ImageNet's 1,000 categories.
- ROC and precision-recall curves, and the area under them, for binary decisions with an adjustable threshold. In screening applications, the threshold is chosen for a target sensitivity (recall) or false positive rate rather than maximum accuracy.
- Performance by subgroup: camera, site, lighting condition, skin tone, age group. Aggregate metrics can hide poor performance on important subgroups.
- Confidence intervals, from bootstrap resampling of the test set, so that small differences between models are not over-interpreted.
Calibration
A classifier is calibrated if its confidence matches its accuracy: among all predictions made with 80% confidence, about 80% should be correct. Calibration matters whenever decisions use the confidence, for example to send uncertain cases to a person, to combine model outputs with other evidence, or to report risk to a doctor. Modern deep networks are often overconfident, because training drives the cross-entropy loss down by inflating logits. Calibration is measured with a reliability diagram, plotting accuracy against confidence in bins, and summarized by the expected calibration error:
Temperature scaling, the simplest and most effective fix, divides all logits by a single temperature \(T > 1\) learned on a validation set by minimizing the negative log-likelihood. It softens the probabilities without changing which class is predicted, so accuracy is unchanged.
import numpy as np

# Calibration: expected calibration error (ECE) before and after temperature scaling
rng = np.random.default_rng(0)
n, K = 5000, 10
true = rng.integers(0, K, n)
logits = rng.normal(0, 1, (n, K))
logits[np.arange(n), true] += rng.normal(2.2, 1.2, n)     # signal toward the true class
logits *= 3.0                                              # an overconfident network: logits too large

def softmax(z):
    z = z - z.max(axis=1, keepdims=True)
    e = np.exp(z)
    return e / e.sum(axis=1, keepdims=True)

def ece(p, y, bins=15):
    conf = p.max(axis=1); pred = p.argmax(axis=1); acc = pred == y
    edges = np.linspace(0, 1, bins + 1); total = 0.0
    for a, b in zip(edges[:-1], edges[1:]):
        m = (conf > a) & (conf <= b)
        if m.any():
            total += m.mean() * abs(acc[m].mean() - conf[m].mean())
    return total, acc.mean(), conf.mean()

val, test = np.arange(0, 2500), np.arange(2500, n)
def nll(T, idx):
    p = softmax(logits[idx] / T)
    return -np.log(p[np.arange(len(idx)), true[idx]] + 1e-12).mean()
Ts = np.linspace(0.5, 5, 451)
T_best = Ts[np.argmin([nll(T, val) for T in Ts])]
for T, label in ((1.0, "uncalibrated"), (T_best, f"temperature T = {T_best:.2f}")):
    e, acc, conf = ece(softmax(logits[test] / T), true[test])
print(f"{label:22s}: accuracy {acc:.3f}, mean confidence {conf:.3f}, ECE {e:.3f}")uncalibrated : accuracy 0.666, mean confidence 0.810, ECE 0.144 temperature T = 1.92 : accuracy 0.666, mean confidence 0.644, ECE 0.038
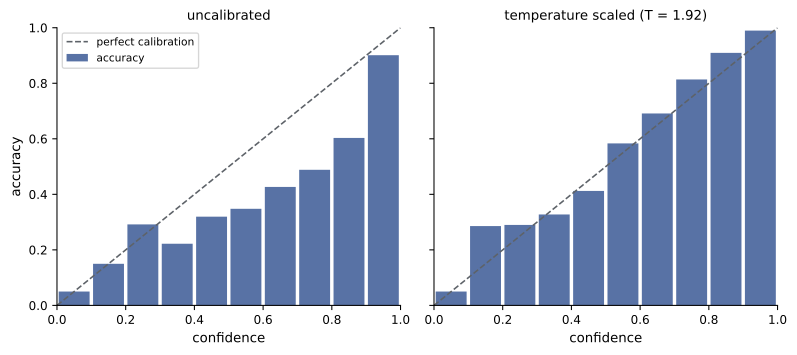
The uncalibrated model claims 81% average confidence but is right only 67% of the time; after temperature scaling with \(T \approx 1.9\), confidence and accuracy nearly match and the ECE falls from 0.14 to 0.04. Calibration should be checked again after deployment, because distribution shift typically makes models overconfident on unfamiliar inputs.
Imbalanced classes and rare defects
Many vision problems are severely imbalanced: defects, diseases, safety incidents and wildlife sightings are rare. Techniques to cope:
- Collect more rare examples deliberately, and use augmentation or synthetic data (rendered 3D models, copy-paste of defects onto good images, generative models, Lesson 8).
- Reweight the loss by class frequency, oversample rare classes, or use the focal loss (Lesson 6), which down-weights easy examples.
- Choose the decision threshold for the required recall, not 0.5.
- Evaluate with per-class recall, precision-recall curves and costs that reflect the consequences of each error type.
When defects are so rare or varied that they cannot be collected, anomaly detection learns only what normal looks like and flags anything different. Approaches include autoencoders that reconstruct normal images well and anomalies poorly, and methods that compare features of a test image with a memory bank of features from normal images (for example PatchCore), which localize anomalies to image patches. Anomaly detection is widely used in manufacturing inspection, where a few hundred images of good parts may be all that is available at launch.
Robustness and distribution shift
Models fail when deployment conditions differ from training conditions, a problem called distribution shift: new cameras with different color processing, a different lens or resolution, seasonal changes, dirty lenses, motion blur, new product variants, or a different patient population. Benchmarks such as ImageNet-C (corruptions such as noise, blur, fog and JPEG compression) and ImageNet-R (renditions such as paintings and cartoons) show that accuracy can fall dramatically under such shifts. Practical defenses:
- Collect training data from the deployment environment and update it over time.
- Use augmentation that simulates expected corruptions: blur, noise, compression, brightness and color changes.
- Start from large, diverse pretrained models, which are generally more robust (Lesson 7).
- Test explicitly on held-out sites, cameras and conditions before deployment, and monitor input statistics and prediction confidence in production to detect drift.
- Design the system so that uncertain predictions are routed to people, and so that failures are safe.
Common mistakes
MistakeSplitting correlated images randomly between training and test sets.
InsteadSplit by patient, video, site or batch, and remove near-duplicates.
MistakeReporting accuracy alone on imbalanced data.
InsteadReport per-class precision and recall, PR curves and subgroup results.
MistakeTreating softmax outputs as calibrated probabilities.
InsteadMeasure calibration and apply temperature scaling on validation data.
MistakeEstimating latency from MACs alone.
InsteadBenchmark on the target device and runtime.
MistakeEvaluating only on data from the training sites.
InsteadTest on new sites, cameras and conditions, and monitor drift.
Summary and key terms
- Depthwise separable convolutions, inverted residuals and compound scaling make networks efficient for edge devices.
- Datasets must cover real conditions, have clear labels, and be split by correlated groups to avoid leakage.
- Confusion matrices, per-class metrics, PR curves, subgroup results and confidence intervals give a full picture.
- Deep networks are often overconfident; ECE measures this and temperature scaling corrects it without changing accuracy.
- Imbalance is handled with targeted data, reweighting, thresholds and anomaly detection.
- Distribution shift degrades performance; diverse data, augmentation, external testing and monitoring defend against it.
- Depthwise separable convolution
- A depthwise filter per channel followed by a 1 × 1 channel-mixing convolution.
- MAC
- A multiply-accumulate operation, a measure of compute.
- Compound scaling
- Scaling depth, width and resolution together.
- Data leakage
- Information from the test set influencing training, inflating results.
- Macro-average
- An average of per-class metrics weighting each class equally.
- Calibration
- Agreement between predicted confidence and actual accuracy.
- Expected calibration error
- The weighted average gap between confidence and accuracy across bins.
- Temperature scaling
- Dividing logits by a learned constant to calibrate probabilities.
- Anomaly detection
- Detecting inputs that differ from learned normal data.
- Distribution shift
- A difference between training and deployment data.
Practice problems
Work each problem on paper first, then reveal the answer to check.
MACs of a 3 × 3 standard convolution, 64 to 64 channels, on 56 × 56?
Show answer
\(9 \times 64 \times 64 \times 3{,}136 = 115.6\) million.
MACs of the depthwise separable version?
Show answer
\((576 + 4{,}096) \times 3{,}136 = 14.7\) million.
Frame budget for 30 frames per second?
Show answer
About 33 ms.
Why split medical images by patient?
Show answer
Images of one patient are correlated; mixing them inflates test results.
Accuracy of always predicting "good" with 2% defects?
Show answer
98%, despite detecting no defects.
What does a reliability diagram plot?
Show answer
Accuracy against confidence in bins.
Does temperature scaling change accuracy?
Show answer
No; it does not change the predicted class.
ECE for two equal bins with gaps 0.1 and 0.3?
Show answer
0.2.
When is anomaly detection preferable to classification?
Show answer
When anomalies are too rare or varied to collect.
Name two sources of distribution shift for cameras.
Show answer
New camera models, lighting, weather, dirty lenses, blur.
Lesson quiz · 5 questions
Score 60% or more to complete this lesson.
Create a free account to save your progress, take quizzes and earn a certificate.