
AI-210 · Lesson 7 of 12 · 27 min
The multivariate Gaussian and Gaussian processes
Lesson 6 introduced random variables, covariance and the univariate Gaussian. In machine learning, almost everything is a vector, and the multivariate Gaussian is the distribution that ties linear algebra and probability together. It is the noise model behind least squares, the prior behind weight decay, the latent space of variational autoencoders and diffusion models, and the basis of Gaussian processes, a flexible way to learn functions with honest uncertainty. This lesson develops the multivariate Gaussian: its density and geometry, the Mahalanobis distance, sampling, the remarkable fact that its marginals and conditionals are also Gaussian, Bayesian linear regression, and Gaussian process regression.
The density and its geometry
A random vector \(\mathbf{x} \in \mathbb{R}^{d}\) has a multivariate Gaussian (normal) distribution with mean \(\boldsymbol{\mu}\) and covariance matrix \(\boldsymbol{\Sigma}\) if its density is
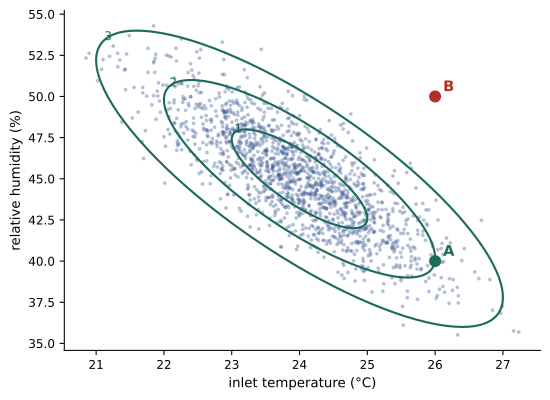
The covariance matrix is symmetric and positive definite. Its eigenvectors (Lesson 1) give the principal axes of the elliptical contours of constant density, and the square roots of its eigenvalues give the spread along each axis. A diagonal \(\boldsymbol{\Sigma}\) means independent components with axis-aligned ellipses; off-diagonal entries tilt the ellipses and express correlation.
The Mahalanobis distance
The quantity in the exponent defines the Mahalanobis distance \(D_{M}(\mathbf{x}) = \sqrt{(\mathbf{x} - \boldsymbol{\mu})^{T}\boldsymbol{\Sigma}^{-1}(\mathbf{x} - \boldsymbol{\mu})}\): the distance from the mean measured in standard deviations, taking correlations into account. Points on the same density contour have the same Mahalanobis distance. For anomaly detection it is far better than Euclidean distance, because it knows which combinations of values are normal.
import numpy as np

mu = np.array([24.0, 45.0])                        # inlet temperature (C), relative humidity (%)
Sigma = np.array([[1.0, -2.4],
                  [-2.4, 9.0]])                    # temperature and humidity move oppositely
L = np.linalg.cholesky(Sigma)                      # Sigma = L L^T
rng = np.random.default_rng(8)
samples = mu + rng.normal(size=(20_000, 2)) @ L.T
print("Sample mean:", np.round(samples.mean(axis=0), 2))
print("Sample covariance:", np.round(np.cov(samples.T), 2).tolist())

Sinv = np.linalg.inv(Sigma)
for name, p in [("A", np.array([26.0, 40.0])), ("B", np.array([26.0, 50.0]))]:
    d = p - mu
print(f"Reading {name} {p}: Euclidean {np.linalg.norm(d):.2f}, Mahalanobis {np.sqrt(d @ Sinv @ d):.2f}")Sample mean: [23.99 45.06] Sample covariance: [[0.99, -2.39], [-2.39, 8.98]] Reading A [26. 40.]: Euclidean 5.39, Mahalanobis 2.00 Reading B [26. 50.]: Euclidean 5.39, Mahalanobis 5.80
Readings A and B are equally far from the mean in Euclidean terms. But A (warmer and drier) follows the normal pattern, in which temperature and humidity move in opposite directions, and is only 2 standard deviations out; B (warmer and more humid) breaks the pattern and is 5.8 standard deviations out, a strong anomaly. For a \(d\)-dimensional Gaussian, \(D_{M}^{2}\) follows a chi-squared distribution with \(d\) degrees of freedom, which turns the distance into a principled alarm threshold.
Worked problem
An alarm threshold
For a 2-dimensional Gaussian, \(D_{M}^{2}\) has a chi-squared distribution with 2 degrees of freedom, for which \(P(D_{M}^{2} > t) = e^{-t/2}\). What threshold on \(D_{M}\) gives a false alarm rate of 1 in 1,000 readings? Would reading B trigger it?
Show solution
- \(e^{-t/2} = 0.001\), so \(t = 2\ln 1{,}000 = 13.8\).
- Threshold \(D_{M} = \sqrt{13.8} = 3.72\).
- Reading B has \(D_{M} = 5.80 > 3.72\): alarm. Reading A (2.00) does not.
Answer: Alarm when \(D_{M} > 3.72\); B triggers it and A does not. In practice the mean and covariance are estimated from normal operating data, and robust estimates are used so that past anomalies do not distort them.
Sampling and linear transformations
If \(\mathbf{z}\) is a vector of independent standard normals and \(\mathbf{x} = \boldsymbol{\mu} + \mathbf{A}\mathbf{z}\), then \(\mathbf{x}\) is Gaussian with mean \(\boldsymbol{\mu}\) and covariance \(\mathbf{A}\mathbf{A}^{T}\). More generally, any linear transformation of a Gaussian is Gaussian: \(\mathbf{y} = \mathbf{B}\mathbf{x} + \mathbf{b}\) has mean \(\mathbf{B}\boldsymbol{\mu} + \mathbf{b}\) and covariance \(\mathbf{B}\boldsymbol{\Sigma}\mathbf{B}^{T}\). To sample from a given \(\boldsymbol{\Sigma}\), factor it as \(\boldsymbol{\Sigma} = \mathbf{L}\mathbf{L}^{T}\) with the Cholesky decomposition (\(\mathbf{L}\) lower triangular) and set \(\mathbf{x} = \boldsymbol{\mu} + \mathbf{L}\mathbf{z}\), as the code above does.
The same idea, writing a random variable as a deterministic function of its parameters and independent noise, is the reparameterization trick that lets variational autoencoders and diffusion models backpropagate through sampling: \(\mathbf{x} = \boldsymbol{\mu}_{\theta} + \boldsymbol{\sigma}_{\theta} \odot \mathbf{z}\) is differentiable in \(\theta\) (Lesson 5).
Marginals and conditionals
Partition a Gaussian vector into two parts \(\mathbf{x} = (\mathbf{x}_{a}, \mathbf{x}_{b})\) with mean \((\boldsymbol{\mu}_{a}, \boldsymbol{\mu}_{b})\) and covariance blocks \(\boldsymbol{\Sigma}_{aa}, \boldsymbol{\Sigma}_{ab}, \boldsymbol{\Sigma}_{bb}\). Then:
- The marginal of \(\mathbf{x}_{a}\) is Gaussian with mean \(\boldsymbol{\mu}_{a}\) and covariance \(\boldsymbol{\Sigma}_{aa}\): simply drop the other variables.
- The conditional of \(\mathbf{x}_{b}\) given \(\mathbf{x}_{a}\) is Gaussian with
The conditional mean is a linear function of the observed values (it is exactly linear regression), and the conditional covariance is smaller than the marginal one and does not depend on the values observed. These two formulas are the engine of Kalman filters, Gaussian processes and Bayesian linear regression.
import numpy as np

mu = np.array([24.0, 45.0])
Sigma = np.array([[1.0, -2.4], [-2.4, 9.0]])
x0 = 26.0                                           # observed temperature
cond_mean = mu[1] + Sigma[1, 0] / Sigma[0, 0] * (x0 - mu[0])
cond_var = Sigma[1, 1] - Sigma[1, 0] ** 2 / Sigma[0, 0]
print(f"Humidity given temperature 26 C: mean {cond_mean:.2f} %, std {np.sqrt(cond_var):.2f} % "
      f"(unconditional std {np.sqrt(Sigma[1, 1]):.2f} %)")

rng = np.random.default_rng(9)
s = mu + rng.normal(size=(400_000, 2)) @ np.linalg.cholesky(Sigma).T
near = s[np.abs(s[:, 0] - x0) < 0.05, 1]           # samples with temperature close to 26 C
print(f"Monte Carlo check from {near.size} samples: mean {near.mean():.2f} %, std {near.std():.2f} %")Humidity given temperature 26 C: mean 40.20 %, std 1.80 % (unconditional std 3.00 %) Monte Carlo check from 2175 samples: mean 40.14 %, std 1.80 %
Observing a temperature of 26 °C (2 standard deviations above its mean) shifts the expected humidity down from 45% to 40.2%, because of the negative correlation, and shrinks its standard deviation from 3.0% to 1.8%: knowing one correlated variable tells us something about the other.
Bayesian linear regression
Combine a Gaussian likelihood, \(\mathbf{y} \mid \mathbf{w} \sim \mathcal{N}(\mathbf{X}\mathbf{w}, \sigma^{2}\mathbf{I})\), with a Gaussian prior on the weights, \(\mathbf{w} \sim \mathcal{N}(\mathbf{0}, \tau^{2}\mathbf{I})\). Because everything is Gaussian, the posterior is Gaussian too, with
The posterior mean is exactly the ridge regression solution with \(\lambda = \sigma^{2}/\tau^{2}\), the MAP estimate of Lesson 6, but the Bayesian treatment also gives the posterior covariance, which quantifies uncertainty in the weights and therefore in every prediction.
import numpy as np

rng = np.random.default_rng(10)
true_w = np.array([1.0, 0.5])
noise_sd, prior_sd = 0.5, 2.0

def posterior(X, y):
    A = X.T @ X / noise_sd**2 + np.eye(2) / prior_sd**2       # posterior precision
    cov = np.linalg.inv(A)
    mean = cov @ X.T @ y / noise_sd**2
    return mean, cov

x_new = np.array([1.0, 8.0])                                   # predict at x = 8
for n in [2, 10, 100]:
    x = rng.uniform(0, 5, n)
    X = np.column_stack([np.ones(n), x])
    y = X @ true_w + rng.normal(0, noise_sd, n)
    m, C = posterior(X, y)
    pred_sd = np.sqrt(x_new @ C @ x_new + noise_sd**2)
    print(f"n = {n:>3}: posterior mean {np.round(m, 3)}, weight sds {np.round(np.sqrt(np.diag(C)), 3)}, "
f"prediction at x = 8: {x_new @ m:.2f} +/- {2 * pred_sd:.2f}")n = 2: posterior mean [1.165 0.387], weight sds [0.62 0.182], prediction at x = 8: 4.26 +/- 2.24 n = 10: posterior mean [0.405 0.603], weight sds [0.415 0.127], prediction at x = 8: 5.23 +/- 1.65 n = 100: posterior mean [0.782 0.522], weight sds [0.104 0.039], prediction at x = 8: 4.96 +/- 1.10
The predictive interval combines uncertainty about the weights with the noise in the observations; as data accumulates, the weight uncertainty shrinks toward zero but the noise remains, so the interval approaches about ±2σ = ±1.0. Note also that x = 8 lies beyond the training range (0 to 5): a model that reports its uncertainty warns when it is extrapolating.
Gaussian processes
A Gaussian process (GP) extends the multivariate Gaussian to functions: it is a distribution over functions \(f\) such that the values at any finite set of inputs are jointly Gaussian, with covariances given by a kernel (Lesson 3), \(\text{Cov}(f(x), f(x^{\prime})) = k(x, x^{\prime})\). The RBF kernel encodes the belief that nearby inputs have similar outputs. Given noisy observations at training inputs, predictions at new inputs follow directly from the Gaussian conditioning formula:
import numpy as np

def rbf(a, b, length=1.0, var=1.0):
    return var * np.exp(-0.5 * (a[:, None] - b[None, :]) ** 2 / length**2)

x_train = np.array([0.5, 1.5, 2.0, 4.0, 5.5, 6.0])
y_train = np.sin(x_train)
noise = 1e-4
x_test = np.array([1.0, 3.0, 5.0, 8.0])

K = rbf(x_train, x_train) + noise * np.eye(x_train.size)
Ks = rbf(x_test, x_train)
mean = Ks @ np.linalg.solve(K, y_train)
cov = rbf(x_test, x_test) - Ks @ np.linalg.solve(K, Ks.T)
sd = np.sqrt(np.clip(np.diag(cov), 0, None))
for x, m, s in zip(x_test, mean, sd):
print(f"x = {x:.1f}: prediction {m:+.3f} +/- {2 * s:.3f} (true sin x = {np.sin(x):+.3f})")x = 1.0: prediction +0.807 +/- 0.189 (true sin x = +0.841) x = 3.0: prediction +0.082 +/- 0.797 (true sin x = +0.141) x = 5.0: prediction -0.979 +/- 0.366 (true sin x = -0.959) x = 8.0: prediction +0.095 +/- 1.952 (true sin x = +0.989)
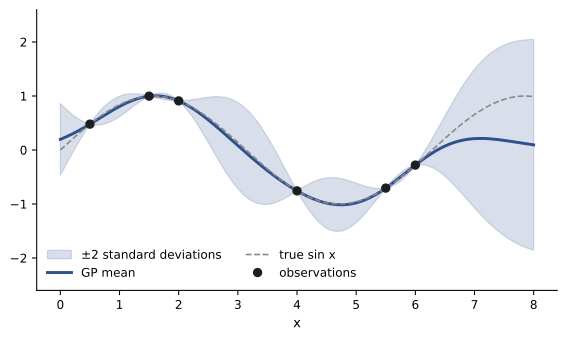
At x = 1 and x = 5, close to data, the predictions are accurate and the intervals narrow. At x = 3, in a gap, the interval widens. At x = 8, far beyond the data, the mean falls back to the prior mean of zero and the interval spans almost the whole prior range: the model correctly says it does not know. This honest uncertainty makes GPs the method of choice for Bayesian optimization, which tunes expensive experiments and hyperparameters (AI-310), and for problems with little data. Their cost, an \(n \times n\) solve, limits exact GPs to some thousands of points, though sparse approximations extend them further.
Worked problem
A two-point GP by hand
A GP has kernel \(k(x, x^{\prime}) = \exp(-(x - x^{\prime})^{2}/2)\) and negligible noise. It observes \(f(0) = 1\). Predict the mean and variance of \(f(1)\).
Show solution
- \(K = k(0, 0) = 1\); \(K_{*} = k(1, 0) = e^{-0.5} = 0.607\); \(K_{**} = 1\).
- Mean: \(0.607 \times 1^{-1} \times 1 = 0.607\).
- Variance: \(1 - 0.607^{2} = 0.632\).
Answer: Mean 0.607 and variance 0.632 (standard deviation 0.80). One observation one length-scale away pulls the prediction partway toward it and reduces the variance by about a third.
Common mistakes
MistakeUsing Euclidean distance for anomalies in correlated data.
InsteadUse the Mahalanobis distance with a robust covariance estimate.
MistakeSampling correlated Gaussians by scaling each coordinate separately.
InsteadMultiply standard normals by the Cholesky factor of Σ.
MistakeInverting covariance matrices explicitly for large problems.
InsteadUse Cholesky factorization and triangular solves.
MistakeReporting a regression prediction without uncertainty far from the data.
InsteadUse Bayesian or GP methods whose uncertainty grows when extrapolating.
MistakeAssuming a GP's mean is reliable everywhere.
InsteadFar from data it reverts to the prior; read the variance.
Summary and key terms
- The multivariate Gaussian is defined by its mean and covariance; contours are ellipses along the eigenvectors of Σ.
- Mahalanobis distance measures distance in standard deviations with correlations; D² follows a chi-squared law.
- Linear transformations of Gaussians are Gaussian; sample with x = μ + Lz using the Cholesky factor.
- Marginals and conditionals of Gaussians are Gaussian; conditioning is linear regression.
- Bayesian linear regression gives a Gaussian posterior whose mean is the ridge solution.
- Gaussian processes use kernels to define distributions over functions and predict with uncertainty.
- Multivariate Gaussian
- A distribution on vectors defined by a mean vector and covariance matrix.
- Covariance matrix
- The symmetric matrix of variances and covariances of a random vector.
- Mahalanobis distance
- Distance from the mean in units of standard deviation, accounting for correlation.
- Cholesky decomposition
- Factorization of a positive definite matrix as LLᵀ.
- Marginal distribution
- The distribution of a subset of variables.
- Conditional distribution
- The distribution of some variables given observed values of others.
- Reparameterization trick
- Writing a sample as a differentiable function of parameters and noise.
- Posterior predictive
- The distribution of a new observation given the data.
- Gaussian process
- A distribution over functions with jointly Gaussian values.
- Bayesian optimization
- Optimizing expensive functions using a probabilistic surrogate such as a GP.
Practice problems
Work each problem on paper first, then reveal the answer to check.
What do the eigenvectors of Σ describe?
Show answer
The principal axes of the density contours.
Σ = diag(4, 9), μ = 0. Mahalanobis distance of (2, 3)?
Show answer
√(1 + 1) = 1.41.
If z ~ N(0, I) and x = μ + Az, what is Cov(x)?
Show answer
AAᵀ.
Variance of y = 2x₁ − x₂ for independent unit-variance x₁, x₂?
Show answer
5.
Conditional mean of b given a for zero means, Σaa = 4, Σab = 2, observed a = 3?
Show answer
2/4 × 3 = 1.5.
Conditional variance there, with Σbb = 3?
Show answer
3 − 4/4 = 2.
For a 2-D Gaussian, what D_M threshold gives a 1% false alarm rate?
Show answer
√(2 ln 100) ≈ 3.03.
Which ridge λ corresponds to noise σ = 0.5 and prior τ = 2?
Show answer
λ = σ²/τ² = 0.0625.
What happens to a GP's prediction far from the data?
Show answer
The mean returns to the prior mean and the variance to the prior variance.
Why are exact GPs limited to thousands of points?
Show answer
They need an n × n matrix solve, costing about n³.
Lesson quiz · 5 questions
Score 60% or more to complete this lesson.
Create a free account to save your progress, take quizzes and earn a certificate.