
AI-210 · Lesson 3 of 12 · 29 min
High-dimensional geometry, embeddings and kernels
Machine learning lives in spaces of hundreds to tens of thousands of dimensions: an embedding of a sentence, the pixels of an image, the activations of a network layer. Our intuition comes from two and three dimensions, and in high dimensions much of it is wrong. Distances between random points become almost equal, random directions are almost perpendicular, and most of the volume of a ball lies near its surface. This lesson builds the right intuition, shows why it matters for nearest-neighbor search, similarity and clustering, explains how random projections can shrink dimensions while preserving distances, and introduces kernels, which compute inner products in very high-dimensional feature spaces without ever constructing them.
Distances concentrate
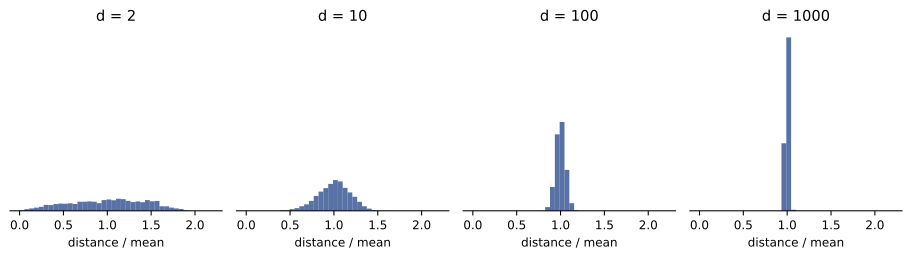
Take random points in a \(d\)-dimensional cube and measure the distance from a query point to each. In two dimensions, the nearest point is much closer than the farthest. As \(d\) grows, the distances bunch together: the ratio of the spread to the nearest distance shrinks toward zero. The reason is the law of large numbers: a squared distance is a sum of \(d\) independent terms, so it concentrates around its mean, with a relative spread proportional to \(1/\sqrt{d}\).
import numpy as np

rng = np.random.default_rng(3)
print("  dim   nearest  farthest  (far - near) / near")
for d in [2, 10, 100, 1000, 10000]:
    pts = rng.uniform(size=(500, d))
    q = rng.uniform(size=d)
    dist = np.linalg.norm(pts - q, axis=1)
print(f"{d:>5} {dist.min():9.2f} {dist.max():9.2f} {(dist.max() - dist.min()) / dist.min():12.3f}") dim nearest farthest (far - near) / near
2 0.03 1.10 32.308
10 0.60 2.19 2.651
100 3.15 4.61 0.462
1000 12.15 13.74 0.131
10000 40.08 41.31 0.031This is one face of the curse of dimensionality. If all points are about equally far away, "nearest neighbor" carries little information, and methods built on distance, such as k-nearest neighbors, k-means and kernel smoothing, degrade on raw high-dimensional data. They work in practice because real data is not uniformly random: it lies near lower-dimensional structures (the manifold hypothesis), and learned embeddings are trained so that distances mean something.
Volume lives near the surface
The fraction of a \(d\)-dimensional ball's volume within radius \(1 - \varepsilon\) of its center is \((1 - \varepsilon)^{d}\). For \(d = 1{,}000\) and \(\varepsilon = 0.01\), that is \(0.99^{1000} \approx 4 \times 10^{-5}\): virtually all of the volume is in the outer 1% shell. Likewise, a high-dimensional Gaussian is not concentrated near its mean: samples lie on a thin shell of radius about \(\sigma\sqrt{d}\). Interpolating between two embeddings in a straight line therefore passes through regions where real data never lies, one reason why generative models often interpolate along the sphere instead.
Worked problem
The thin shell
Samples are drawn from a standard Gaussian in 768 dimensions. (a) About what is their typical distance from the origin? (b) About what is the typical distance between two samples?
Show solution
- (a) The squared norm is a sum of 768 terms each with mean 1, so the norm is about \(\sqrt{768} = 27.7\).
- (b) The difference of two independent samples has variance 2 per coordinate, so the distance is about \(\sqrt{2 \times 768} = 39.2\).
Answer: About 27.7 from the origin and about 39.2 apart, with very little variation; almost no samples are near the mean at the origin, even though the density is highest there.
Random directions are nearly orthogonal
The cosine of the angle between two random vectors in \(d\) dimensions has mean zero and standard deviation about \(1/\sqrt{d}\). In three dimensions, random directions are often far from perpendicular; in thousands, they are almost always within a few degrees of 90°.
import numpy as np

rng = np.random.default_rng(4)
for d in [3, 30, 300, 3000]:
    u = rng.normal(size=(2000, d))
    v = rng.normal(size=(2000, d))
    cos = np.sum(u * v, axis=1) / (np.linalg.norm(u, axis=1) * np.linalg.norm(v, axis=1))
    print(f"d = {d:>4}: std of cosine {cos.std():.4f} (1/sqrt(d) = {1 / np.sqrt(d):.4f}), "
f"fraction with |cos| > 0.1: {np.mean(np.abs(cos) > 0.1):.3f}")d = 3: std of cosine 0.5858 (1/sqrt(d) = 0.5774), fraction with |cos| > 0.1: 0.909 d = 30: std of cosine 0.1809 (1/sqrt(d) = 0.1826), fraction with |cos| > 0.1: 0.581 d = 300: std of cosine 0.0583 (1/sqrt(d) = 0.0577), fraction with |cos| > 0.1: 0.088 d = 3000: std of cosine 0.0191 (1/sqrt(d) = 0.0183), fraction with |cos| > 0.1: 0.000
This explains several things in modern AI. High-dimensional embedding spaces can hold an enormous number of nearly orthogonal directions, far more than \(d\), which is one hypothesis for how large language models represent many more concepts than they have dimensions ("superposition"). It also tells us how to read similarity scores: in a 3,000-dimensional space, a cosine of 0.1 between unrelated random vectors is already rare, so a cosine of 0.3 indicates a real relationship, while in 30 dimensions it would mean little.
Embeddings and similarity search
An embedding maps an object, such as a word, sentence, image, product or user, to a vector so that similar objects have similar vectors. Embeddings are learned: word2vec and GloVe from co-occurrence statistics, sentence and image embeddings from contrastive training that pulls matching pairs together and pushes others apart, and the internal representations of large language models. Similarity is usually measured by cosine similarity, often by normalizing every vector to unit length so that cosine similarity equals the dot product, and all similarities between two sets can be computed with one matrix product.
import numpy as np

words = ["pump", "chiller", "fan", "breaker", "fuse", "relay", "router", "switch", "firewall"]
rng = np.random.default_rng(6)
topics = rng.normal(size=(3, 64))                       # cooling, electrical, network directions
group = np.repeat([0, 1, 2], 3)
E = topics[group] + 0.6 * rng.normal(size=(9, 64))      # toy 64-dimensional embeddings

E_unit = E / np.linalg.norm(E, axis=1, keepdims=True)  # normalize once
S = E_unit @ E_unit.T                                   # all cosine similarities in one product
for w in ["chiller", "fuse", "router"]:
    k = words.index(w)
    order = np.argsort(-S[k])[1:3]                      # two most similar words, excluding itself
print(f"{w:>8}: " + ", ".join(f"{words[m]} ({S[k, m]:.2f})" for m in order)) chiller: fan (0.80), pump (0.79)
fuse: breaker (0.71), relay (0.70)
router: switch (0.82), firewall (0.81)Retrieval-augmented generation, recommendation systems and semantic search all rest on this operation at a much larger scale: find the vectors most similar to a query among millions or billions. Exact search compares the query with every vector, which is too slow at that scale, so vector databases use approximate nearest-neighbor (ANN) indexes, such as graph-based HNSW or clustering-based IVF with product quantization, trading a little recall for speed improvements of hundreds of times.
Worked problem
The cost of exact search
A vector database holds 100 million embeddings of 1,024 dimensions in 32-bit floats. (a) How much memory do the vectors need? (b) How many multiply-adds does an exact search for one query take? (c) At 10¹¹ multiply-adds per second, how long?
Show solution
- (a) \(10^{8} \times 1{,}024 \times 4 = 4.1 \times 10^{11}\) bytes, about 410 GB.
- (b) \(10^{8} \times 1{,}024 = 1.0 \times 10^{11}\) multiply-adds.
- (c) About 1 second per query.
Answer: About 410 GB and 1 second per query for exact search, far too slow for interactive use at many queries per second. ANN indexes answer in milliseconds by examining a small fraction of the vectors, and quantization compresses each vector to tens of bytes.
Random projections
Remarkably, a random linear map can reduce dimension while approximately preserving all pairwise distances. The Johnson–Lindenstrauss lemma states that \(n\) points can be mapped into \(k = O(\log n/\varepsilon^{2})\) dimensions so that every pairwise distance changes by a factor of at most \(1 \pm \varepsilon\), and that a random Gaussian matrix scaled by \(1/\sqrt{k}\) does this with high probability. The required dimension depends on the number of points and the accuracy, not on the original dimension.
import numpy as np

rng = np.random.default_rng(5)
n, d = 300, 10_000
X = rng.normal(size=(n, d))
i, j = rng.integers(0, n, 2000), rng.integers(0, n, 2000)
keep = i != j
i, j = i[keep], j[keep]
orig = np.linalg.norm(X[i] - X[j], axis=1)

for k in [50, 200, 800]:
    R = rng.normal(size=(d, k)) / np.sqrt(k)        # random Gaussian projection
    Y = X @ R
    ratio = np.linalg.norm(Y[i] - Y[j], axis=1) / orig
    print(f"k = {k:>3}: distance ratio mean {ratio.mean():.3f}, 1st-99th percentile "
f"{np.percentile(ratio, 1):.3f} to {np.percentile(ratio, 99):.3f}")k = 50: distance ratio mean 0.993, 1st-99th percentile 0.777 to 1.230 k = 200: distance ratio mean 1.000, 1st-99th percentile 0.883 to 1.123 k = 800: distance ratio mean 0.998, 1st-99th percentile 0.941 to 1.054
Distances are preserved on average at every \(k\), and the spread of the distortion shrinks roughly as \(1/\sqrt{k}\). Unlike PCA (Lesson 1), a random projection needs no training data and no SVD, so it is fast and can be applied to streaming data. It underlies sketching algorithms, locality-sensitive hashing for similarity search, and compressed sensing.
Kernels: inner products in feature space
Many algorithms, including support vector machines, ridge regression and PCA, can be written so that the data appear only through inner products \(\mathbf{x}_{i}^{T}\mathbf{x}_{j}\). Replacing each inner product by a kernel function \(k(\mathbf{x}_{i}, \mathbf{x}_{j}) = \phi(\mathbf{x}_{i})^{T}\phi(\mathbf{x}_{j})\) runs the algorithm in the feature space defined by \(\phi\), which may be very high-dimensional or even infinite-dimensional, without ever computing \(\phi\). This is the kernel trick.
- The polynomial kernel \(k(\mathbf{x}, \mathbf{z}) = (\mathbf{x}^{T}\mathbf{z})^{2}\) corresponds to all products of pairs of features.
- The radial basis function (Gaussian) kernel \(k(\mathbf{x}, \mathbf{z}) = \exp(-\|\mathbf{x} - \mathbf{z}\|^{2}/2\ell^{2})\) corresponds to an infinite-dimensional feature space and measures similarity that decays with distance on a length scale \(\ell\).
A function is a valid kernel exactly when every kernel matrix \(K_{ij} = k(\mathbf{x}_{i}, \mathbf{x}_{j})\) it produces is symmetric and positive semidefinite (Mercer's condition).
import numpy as np

x = np.array([1.0, 2.0])
z = np.array([3.0, 1.0])
phi = lambda v: np.array([v[0]**2, np.sqrt(2) * v[0] * v[1], v[1]**2])   # explicit feature map
print("Explicit features:", round(phi(x) @ phi(z), 6), "| kernel (x . z)^2:", (x @ z) ** 2)

rng = np.random.default_rng(7)
P = rng.normal(size=(40, 2))
sq = np.sum(P**2, axis=1)
K = np.exp(-(sq[:, None] + sq[None, :] - 2 * P @ P.T) / 2.0)          # RBF kernel matrix
eig = np.linalg.eigvalsh(K)
print("RBF kernel matrix: symmetric", np.allclose(K, K.T), "| positive semidefinite:", bool(eig.min() > -1e-10))
print("Three largest eigenvalues:", np.round(eig[::-1][:3], 3))Explicit features: 25.0 | kernel (x . z)^2: 25.0 RBF kernel matrix: symmetric True | positive semidefinite: True Three largest eigenvalues: [17.572 6.944 5.437]
Kernel matrices are \(n \times n\), so kernel methods become expensive for large \(n\) (memory grows as \(n^{2}\) and solving as \(n^{3}\)), which is one reason deep networks, which learn their features rather than fixing them, took over on large data sets. Kernels remain important in Gaussian processes (Lesson 7), in small-data problems, and as a lens on deep learning: very wide networks trained with small steps behave like kernel machines with a particular kernel, the neural tangent kernel.
Worked problem
Feature space dimension
For inputs of dimension \(d = 100\), how many features does the explicit map of the degree-2 polynomial kernel \((\mathbf{x}^{T}\mathbf{z} + 1)^{2}\) have, counting distinct monomials of degree 0, 1 and 2? What about degree 5?
Show solution
- Monomials of degree at most \(p\) in \(d\) variables: \(\binom{d + p}{p}\).
- Degree 2: \(\binom{102}{2} = 5{,}151\).
- Degree 5: \(\binom{105}{5} = 96{,}560{,}646\).
Answer: About 5,000 features for degree 2 and nearly 100 million for degree 5, yet the kernel is computed with one dot product, one addition and one power. That is the economy of the kernel trick.
Common mistakes
MistakeTrusting k-nearest neighbors on raw high-dimensional features.
InsteadUse learned embeddings or reduce dimension; check that distances are informative.
MistakeReading cosine similarities without considering dimension.
InsteadCompare against the spread expected for random vectors, about 1/√d.
MistakeInterpolating linearly between high-dimensional Gaussian samples.
InsteadRemember samples lie on a thin shell; interpolate on the sphere.
MistakeUsing exact search over billions of vectors.
InsteadUse approximate nearest-neighbor indexes and quantization.
MistakeUsing any similarity function as a kernel.
InsteadA valid kernel must give symmetric positive semidefinite matrices.
Summary and key terms
- In high dimensions, distances concentrate, volume lies near the surface and Gaussians live on a thin shell.
- Random vectors are nearly orthogonal, with cosine spread about 1/√d.
- Embeddings map objects to vectors whose geometry encodes similarity; normalized dot products give cosine similarity.
- Large-scale similarity search uses approximate nearest-neighbor indexes.
- Random projections preserve distances to within 1 ± ε using O(log n/ε²) dimensions.
- Kernels compute inner products in implicit feature spaces; valid kernels are positive semidefinite.
- Curse of dimensionality
- The difficulties that arise as the number of dimensions grows.
- Distance concentration
- The tendency of distances between random points to become nearly equal.
- Manifold hypothesis
- The idea that real data lies near low-dimensional structures.
- Embedding
- A learned vector representation of an object.
- Cosine similarity
- The cosine of the angle between two vectors.
- Approximate nearest neighbor
- Fast search that returns most of the true nearest neighbors.
- Johnson–Lindenstrauss lemma
- A result guaranteeing distance-preserving random projections.
- Kernel
- A function equal to an inner product in some feature space.
- Kernel trick
- Running an algorithm in feature space using only kernel evaluations.
- Positive semidefinite
- A symmetric matrix with no negative eigenvalues.
Practice problems
Work each problem on paper first, then reveal the answer to check.
Why does k-nearest neighbors degrade on raw high-dimensional data?
Show answer
Distances concentrate, so nearest and farthest neighbors are almost equally far.
Fraction of a 500-dimensional ball's volume within radius 0.98 of the center?
Show answer
0.98⁵⁰⁰ ≈ 4 × 10⁻⁵.
Typical norm of a standard Gaussian sample in 1,024 dimensions?
Show answer
About 32.
Standard deviation of the cosine between random vectors in 400 dimensions?
Show answer
About 0.05.
How do you turn cosine similarity into a plain dot product?
Show answer
Normalize all vectors to unit length first.
Memory for 10 million 768-dimensional float32 embeddings?
Show answer
About 30.7 GB.
Does the JL target dimension depend on the original dimension?
Show answer
No; it depends on the number of points and the accuracy.
Compute (x·z)² for x = (2, 1), z = (1, 3).
Show answer
25.
What property must every kernel matrix have?
Show answer
Symmetric and positive semidefinite.
Why do kernel methods scale poorly with n?
Show answer
The kernel matrix needs n² memory and solving costs about n³.
Lesson quiz · 5 questions
Score 60% or more to complete this lesson.
Create a free account to save your progress, take quizzes and earn a certificate.