
ACCT-499 · Lesson 4 of 12 · 29 min
Financial statement analysis II: cash flow, earnings quality and red flags
Lesson 3 showed that Bluestem's profits are falling while its revenue grows. This lesson asks a sharper question: how good are the profits that remain? Earnings quality is the degree to which reported earnings reflect real, repeatable cash-generating performance. High-quality earnings are backed by cash, come from the core business and are measured with neutral judgments. Low-quality earnings depend on accruals that may reverse, one-time gains, or aggressive estimates. The team examines Bluestem's cash flows, working capital, accruals and adjusted measures, and runs the Beneish model introduced in ACCT-460 as a screening tool. None of these tests proves anything on its own; together they tell the team where to dig in Lessons 5 to 7.
Cash flow from operations against net income
The simplest earnings-quality test compares cash from operations with net income. Over time, a healthy company's operating cash flow should equal or exceed its net income, because depreciation and amortization are added back. A sustained gap where net income exceeds cash flow means earnings are increasingly made up of accruals: revenue recognized but not collected, inventory produced but not sold, expenses deferred. Bluestem's ratio of cash from operations to net income fell from 1.56 in 2024 to 1.38 in 2025 and to 0.57 in 2026. In 2026, the company reported 10.1 million of net income but generated only 5.8 million of operating cash, and after capital spending its free cash flow was negative.
The cash conversion cycle and accruals
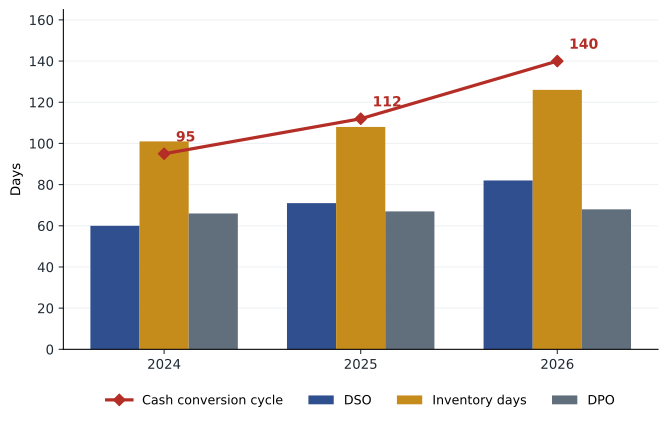
The cash conversion cycle combines three efficiency measures: days sales outstanding (how long customers take to pay), days inventory on hand (how long goods sit before sale) and days payables outstanding (how long the company takes to pay suppliers). The cycle is the number of days between paying for inputs and collecting from customers; the longer it is, the more cash growth consumes. The program calculates the cycle, the balance-sheet accruals ratio and free cash flow, and estimates how much cash is tied up compared with 2024 efficiency.
# Bluestem Water Instruments Inc. (invented), in thousands of dollars, years ended December 31.
YEARS = [2024, 2025, 2026]
IS = {'Hardware revenue': [138000, 149500, 161200], 'Subscription revenue': [44000, 55600, 69800],
      'Hardware cost of sales': [82800, 92700, 104800], 'Subscription cost of sales': [11000, 13300, 16100],
      'Selling, general and admin': [42000, 48500, 56900], 'Research and development': [18200, 21000, 23600],
      'Depreciation': [6200, 6900, 7600], 'Amortization of intangibles': [3000, 4800, 4800],
      'Interest expense': [2100, 3900, 4600], 'Income tax expense': [3300, 2500, 2500]}
BS = {  # balances at December 31, 2023 to 2026
      'Cash': [18000, 24200, 25500, 23400], 'Receivables': [26000, 30000, 39800, 52100],
      'Inventories': [22000, 26000, 31500, 41900], 'Other current assets': [2800, 3000, 3600, 4100],
      'Property, plant and equipment': [45000, 48000, 51000, 53500], 'Right-of-use assets': [13000, 12000, 15500, 14800],
      'Intangible assets': [9000, 6000, 19200, 14400], 'Goodwill': [8000, 8000, 24000, 24000],
      'Payables': [15000, 17000, 19500, 22700], 'Accrued liabilities': [8000, 9000, 10500, 11200],
      'Deferred revenue': [11000, 14000, 18500, 21000], 'Warranty provision': [2300, 2500, 2700, 2600],
      'Income taxes payable': [1200, 1300, 900, 700], 'Lease liabilities': [13500, 13000, 16800, 16300],
      'Borrowings': [28000, 25000, 57000, 60000], 'Deferred tax liabilities': [1800, 2000, 2300, 2700],
      'Share capital': [40000, 40000, 40000, 42000], 'Retained earnings': [23000, 33400, 41900, 49000]}
CF = {'Cash from operations': [20900, 15900, 5800], 'Capital expenditure': [-8000, -8400, -8400],
      'Acquisition of Merrow Lane': [0, -34000, 0], 'Dividends paid': [-3000, -3000, -3000]}
def rev(i): return IS['Hardware revenue'][i] + IS['Subscription revenue'][i]
def cogs(i): return IS['Hardware cost of sales'][i] + IS['Subscription cost of sales'][i]
def ebit(i): return rev(i) - cogs(i) - sum(IS[k][i] for k in ('Selling, general and admin', 'Research and development', 'Depreciation', 'Amortization of intangibles'))
def ni(i): return ebit(i) - IS['Interest expense'][i] - IS['Income tax expense'][i]
ASSETS = ['Cash', 'Receivables', 'Inventories', 'Other current assets', 'Property, plant and equipment', 'Right-of-use assets', 'Intangible assets', 'Goodwill']
CUR_A = ASSETS[:4]
CUR_L = ['Payables', 'Accrued liabilities', 'Deferred revenue', 'Warranty provision', 'Income taxes payable']
LIABS = CUR_L + ['Lease liabilities', 'Borrowings', 'Deferred tax liabilities']
def tot(keys, t): return sum(BS[k][t] for k in keys)

# Lesson 4: cash conversion cycle, accruals and cash-flow quality.
for i, y in enumerate(YEARS):
    t = i + 1
    dso = BS['Receivables'][t] / rev(i) * 365
    dio = BS['Inventories'][t] / cogs(i) * 365
    dpo = BS['Payables'][t] / cogs(i) * 365
    avgA = (tot(ASSETS, t) + tot(ASSETS, t - 1)) / 2
    accr = (ni(i) - CF['Cash from operations'][i]) / avgA
    fcf = CF['Cash from operations'][i] + CF['Capital expenditure'][i]
    print(f"{y}: DSO {dso:5.1f} + DIO {dio:5.1f} - DPO {dpo:5.1f} = cash conversion cycle {dso + dio - dpo:5.1f} days")
    print(f"      net income {ni(i):,}, cash from operations {CF['Cash from operations'][i]:,}, "
          f"accruals ratio {accr:+.1%}, free cash flow {fcf:,}")
# What would cash from operations have been in 2026 if DSO and DIO had stayed at 2024 levels?
dso24 = BS['Receivables'][1] / rev(0) * 365
dio24 = BS['Inventories'][1] / cogs(0) * 365
extra_ar = BS['Receivables'][3] - dso24 / 365 * rev(2)
extra_inv = BS['Inventories'][3] - dio24 / 365 * cogs(2)
print(f"\nWorking capital tied up in 2026 beyond 2024 efficiency: receivables {extra_ar:,.0f}, inventories {extra_inv:,.0f}, "
f"total {extra_ar + extra_inv:,.0f}")2024: DSO 60.2 + DIO 101.2 - DPO 66.2 = cash conversion cycle 95.2 days
net income 13,400, cash from operations 20,900, accruals ratio -5.0%, free cash flow 12,900
2025: DSO 70.8 + DIO 108.5 - DPO 67.1 = cash conversion cycle 112.1 days
net income 11,500, cash from operations 15,900, accruals ratio -2.4%, free cash flow 7,500
2026: DSO 82.3 + DIO 126.5 - DPO 68.5 = cash conversion cycle 140.3 days
net income 10,100, cash from operations 5,800, accruals ratio +2.0%, free cash flow -2,600
Working capital tied up in 2026 beyond 2024 efficiency: receivables 14,023, inventories 8,388, total 22,411The cycle lengthened from 95 days to 140 days in two years. Receivables account for 22 extra days and inventory for 25; payables barely changed. The final line of the output puts a figure on it: if Bluestem had collected receivables and turned inventory at its 2024 pace, it would have about 22.4 million more cash today. That is more than the entire increase in its borrowings during 2026 and almost four times 2026 operating cash flow. Working capital, not profitability, is the main reason Bluestem's cash has fallen.
The accruals ratio scales the gap between net income and operating cash flow by average total assets. Negative values mean cash flow exceeds net income, which is normal; positive values mean accruals are building. Bluestem moved from minus 5.0 percent to plus 2.0 percent. Research in accounting, beginning with work by Richard Sloan in the 1990s, found that companies with high accruals tend to have lower future earnings, because accruals partly reverse. A positive ratio of two percent is not extreme, but the direction of travel is consistent with every other indicator.
Why receivables are growing
Ratios tell the team that receivables are growing; they cannot tell it why. Priya and Liam obtain the aged receivables listing at December 31, 2026 and interview the credit manager. Four causes emerge. First, Bluestem extended standard payment terms on several large municipal contracts from 30 to 60 or 90 days to win tenders, a decision taken by sales without finance approval. Second, about 6 million of receivables relate to milestone billings on installation contracts where the customer disputes whether a milestone was reached. Third, a large share of December revenue was invoiced in the last week of the year, including a bill-and-hold sale of 4.8 million examined in Lesson 5. Fourth, collections staff were cut in 2025 to reduce costs.
Each cause has a different meaning. Extended terms are a commercial choice with a cash cost; the company should price them and approve them centrally. Disputed milestones may signal revenue recognized before performance was complete, and they may need a loss allowance. Year-end concentration of invoicing suggests pressure to meet revenue targets and needs cut-off testing. Fewer collectors is a false economy. The aged listing shows 18 percent of receivables more than 90 days past due, up from 7 percent two years earlier, but the loss allowance has stayed at about one percent of receivables. Lesson 5 considers whether the allowance under the expected credit loss model is adequate.
Why inventory is growing
Inventory grew 61 percent in two years against hardware revenue growth of 17 percent. The operations director explains that the company built safety stock of electronic components after supply shortages in earlier years and launched a new sensor generation in 2026, but kept producing the previous model for customers who wanted to standardize. A count of the warehouse by the team, observed with Bluestem staff, found about 3.9 million of finished goods of the previous model with no sales in nine months. Under ASC 330, inventory is measured at the lower of cost and net realizable value, so slow-moving stock that can be sold only at a discount should be written down. Management has recorded no write-down.
Adjusted measures
Bluestem reports adjusted EBITDA in its earnings releases and MD&A, as non-GAAP financial measures under Regulation G and Item 10(e) of Regulation S-K. The measure starts with net income and adds back interest, tax, depreciation and amortization, and then adds back share-based compensation, acquisition integration costs and "restructuring of sales operations." The integration and restructuring items appear in all three years. SEC staff guidance says that excluding normal, recurring cash operating expenses can make a measure misleading, and staff comment letters frequently challenge items described as non-recurring that recur. The team recommends that adjusted measures exclude only genuinely unusual items, and that Bluestem reconsider the bonus plan's reliance on adjusted EBITDA.
ACCT-470 compared US non-GAAP rules with IFRS 18, which from 2027 brings management-defined performance measures into the audited financial statements of IFRS reporters. US filers will continue to present non-GAAP measures outside the financial statements, but the new expense disaggregation disclosures under ASU 2024-03 will give readers more detail with which to test them. The 2026 review is a good time for Bluestem to clean up its adjustments.
Segment information
Under ASC 280, as amended by ASU 2023-07, Bluestem reports two operating segments, Instruments and Cloud, and discloses the significant segment expenses regularly provided to the chief operating decision maker. The segment note shows that Cloud's segment profit includes Merrow Lane, whose costs are rising faster than its revenue, and that corporate costs are not allocated. Segment disclosures are often more informative than consolidated figures, and comparing segment profit with the margins in Lesson 2 helps the team check its own analysis. When the team found that management's internal reports allocate shared sales costs to Cloud while the segment note does not, it noted the difference and confirmed that the note reports the measure the decision maker actually uses.
Screening with the Beneish model
The Beneish M-score combines eight indexes, each comparing the current year with the prior year, into a probability-weighted score that historically separated companies that manipulated earnings from those that did not. ACCT-460 introduced it. It is a screening tool: a high score is a reason to look harder, not evidence of misstatement, and a low score is not a clean bill of health. The program calculates the score for 2026.
# Bluestem Water Instruments Inc. (invented), in thousands of dollars, years ended December 31.
YEARS = [2024, 2025, 2026]
IS = {'Hardware revenue': [138000, 149500, 161200], 'Subscription revenue': [44000, 55600, 69800],
      'Hardware cost of sales': [82800, 92700, 104800], 'Subscription cost of sales': [11000, 13300, 16100],
      'Selling, general and admin': [42000, 48500, 56900], 'Research and development': [18200, 21000, 23600],
      'Depreciation': [6200, 6900, 7600], 'Amortization of intangibles': [3000, 4800, 4800],
      'Interest expense': [2100, 3900, 4600], 'Income tax expense': [3300, 2500, 2500]}
BS = {  # balances at December 31, 2023 to 2026
      'Cash': [18000, 24200, 25500, 23400], 'Receivables': [26000, 30000, 39800, 52100],
      'Inventories': [22000, 26000, 31500, 41900], 'Other current assets': [2800, 3000, 3600, 4100],
      'Property, plant and equipment': [45000, 48000, 51000, 53500], 'Right-of-use assets': [13000, 12000, 15500, 14800],
      'Intangible assets': [9000, 6000, 19200, 14400], 'Goodwill': [8000, 8000, 24000, 24000],
      'Payables': [15000, 17000, 19500, 22700], 'Accrued liabilities': [8000, 9000, 10500, 11200],
      'Deferred revenue': [11000, 14000, 18500, 21000], 'Warranty provision': [2300, 2500, 2700, 2600],
      'Income taxes payable': [1200, 1300, 900, 700], 'Lease liabilities': [13500, 13000, 16800, 16300],
      'Borrowings': [28000, 25000, 57000, 60000], 'Deferred tax liabilities': [1800, 2000, 2300, 2700],
      'Share capital': [40000, 40000, 40000, 42000], 'Retained earnings': [23000, 33400, 41900, 49000]}
CF = {'Cash from operations': [20900, 15900, 5800], 'Capital expenditure': [-8000, -8400, -8400],
      'Acquisition of Merrow Lane': [0, -34000, 0], 'Dividends paid': [-3000, -3000, -3000]}
def rev(i): return IS['Hardware revenue'][i] + IS['Subscription revenue'][i]
def cogs(i): return IS['Hardware cost of sales'][i] + IS['Subscription cost of sales'][i]
def ebit(i): return rev(i) - cogs(i) - sum(IS[k][i] for k in ('Selling, general and admin', 'Research and development', 'Depreciation', 'Amortization of intangibles'))
def ni(i): return ebit(i) - IS['Interest expense'][i] - IS['Income tax expense'][i]
ASSETS = ['Cash', 'Receivables', 'Inventories', 'Other current assets', 'Property, plant and equipment', 'Right-of-use assets', 'Intangible assets', 'Goodwill']
CUR_A = ASSETS[:4]
CUR_L = ['Payables', 'Accrued liabilities', 'Deferred revenue', 'Warranty provision', 'Income taxes payable']
LIABS = CUR_L + ['Lease liabilities', 'Borrowings', 'Deferred tax liabilities']
def tot(keys, t): return sum(BS[k][t] for k in keys)

# Lesson 4: Beneish M-score for 2026 (eight-variable model) using the Bluestem data.
i, p = 2, 1                       # 2026 against 2025 (income statement indexes)
t, q = 3, 2                       # balance sheet indexes
def sga(k): return IS['Selling, general and admin'][k]
def dep(k): return IS['Depreciation'][k]
def ppe(k): return BS['Property, plant and equipment'][k]
def ca(k): return tot(CUR_A, k)
def ta(k): return tot(ASSETS, k)
def debt(k): return BS['Borrowings'][k] + BS['Lease liabilities'][k] + tot(CUR_L, k)
DSRI = (BS['Receivables'][t] / rev(i)) / (BS['Receivables'][q] / rev(p))
GMI = (1 - cogs(p) / rev(p)) / (1 - cogs(i) / rev(i))
AQI = (1 - (ca(t) + ppe(t)) / ta(t)) / (1 - (ca(q) + ppe(q)) / ta(q))
SGI = rev(i) / rev(p)
DEPI = (dep(p) / (dep(p) + ppe(q))) / (dep(i) / (dep(i) + ppe(t)))
SGAI = (sga(i) / rev(i)) / (sga(p) / rev(p))
LVGI = (debt(t) / ta(t)) / (debt(q) / ta(q))
TATA = (ni(i) - CF['Cash from operations'][i]) / ta(t)
coef = {'DSRI': 0.920, 'GMI': 0.528, 'AQI': 0.404, 'SGI': 0.892, 'DEPI': 0.115, 'SGAI': -0.172, 'LVGI': -0.327, 'TATA': 4.679}
vals = {'DSRI': DSRI, 'GMI': GMI, 'AQI': AQI, 'SGI': SGI, 'DEPI': DEPI, 'SGAI': SGAI, 'LVGI': LVGI, 'TATA': TATA}
m = -4.84 + sum(coef[k] * vals[k] for k in coef)
for k in coef: print(f"  {k:5} {vals[k]:7.3f}  x {coef[k]:+.3f} = {coef[k] * vals[k]:+.3f}")
print(f"M-score = -4.840 + sum = {m:.2f}")
print("Reading: above about -1.78 is the usual flag for a higher likelihood of earnings manipulation" if m > -1.78
else "Reading: below the usual -1.78 flag, but individual indexes can still point to areas to probe")DSRI 1.162 x +0.920 = +1.069 GMI 1.014 x +0.528 = +0.535 AQI 0.834 x +0.404 = +0.337 SGI 1.126 x +0.892 = +1.005 DEPI 0.958 x +0.115 = +0.110 SGAI 1.042 x -0.172 = -0.179 LVGI 0.984 x -0.327 = -0.322 TATA 0.019 x +4.679 = +0.088 M-score = -4.840 + sum = -2.20 Reading: below the usual -1.78 flag, but individual indexes can still point to areas to probe
Bluestem's score of about minus 2.2 is below the commonly used threshold of minus 1.78, so the model as a whole does not flag it. The individual indexes are still informative. The days sales in receivables index of 1.16 is the largest contributor: receivables grew 16 percent faster than sales in one year, the pattern the model associates with revenue inflation. The sales growth index adds to the score because fast-growing companies face more pressure to sustain growth. The asset quality index is below one because the acquisition intangibles are being amortized. The team reports the result carefully: "The Beneish model does not flag Bluestem overall, but its receivables index is elevated, consistent with the year-end revenue timing and extended terms we found."
| Indicator | Bluestem 2026 | Reading |
|---|---|---|
| Cash from operations / net income | 0.57 | Earnings increasingly made of accruals |
| Accruals ratio | +2.0 percent | Turned positive from minus 5.0 percent in 2024 |
| Cash conversion cycle | 140 days, up 45 | Working capital absorbing cash |
| Receivables over 90 days past due | 18 percent, up from 7 | Collection and possibly revenue quality issues |
| Adjusted EBITDA add-backs | Recurring "non-recurring" items | Measure overstates sustainable performance |
| Beneish M-score | About minus 2.2 | Not flagged overall; receivables index elevated |
Putting it together
The second financial finding for the interim meeting reads: "Bluestem's earnings are increasingly backed by receivables and inventory rather than cash. The cash conversion cycle lengthened by 45 days in two years, tying up about 22 million of cash, and operating cash flow fell to 57 percent of net income in 2026. Causes include extended payment terms granted without finance approval, disputed milestone billings, year-end revenue concentration and slow-moving inventory of the previous sensor model. Several of these may also mean that 2026 revenue, the receivables allowance and inventory are overstated; Lesson 5 quantifies them." The finding links naturally to the reporting issues, controls and recommendations that follow, which is exactly what a good analysis should do.
Worked problem
Cash tied up in receivables
Bluestem's 2026 revenue was 231.0 million and receivables 52.1 million. In 2024, DSO was 60.2 days. How much less would receivables be at 2024 efficiency?
Show solution
- Receivables at 2024 efficiency = 60.2 / 365 x 231.0 million = about 38.1 million.
- Actual receivables are 52.1 million.
- Difference = 52.1 - 38.1 = about 14.0 million.
Answer: About 14.0 million of additional cash would be available if collections returned to the 2024 pace.
Common mistakes
MistakeTreating rising net income as proof of good performance.
InsteadCompare net income with operating cash flow and analyze the accruals between them.
MistakeReading a Beneish score below the threshold as a clean result.
InsteadUse it as a screen and examine the individual indexes.
MistakeAccepting recurring items as non-recurring adjustments.
InsteadExclude only genuinely unusual items from adjusted measures.
MistakeStopping at the ratio without finding the cause.
InsteadUse aged listings, interviews and counts to explain why working capital moved.
MistakeIgnoring slow-moving inventory because it has not been written down.
InsteadTest net realizable value; lack of a write-down is a finding, not reassurance.
Summary and key terms
- Earnings quality asks whether reported profits are backed by cash and neutral judgments.
- Bluestem's operating cash flow fell to 57 percent of net income in 2026.
- The cash conversion cycle grew from 95 to 140 days, tying up about 22 million.
- Receivables reflect extended terms, disputed milestones and year-end invoicing; inventory includes slow-moving stock.
- Adjusted EBITDA adds back recurring items and should be tightened, especially before IFRS 18 or new US disclosures take effect.
- The Beneish model does not flag Bluestem overall, but its receivables index is elevated.
- Earnings quality
- The extent to which reported earnings reflect real, repeatable, cash-backed performance.
- Cash conversion cycle
- Days sales outstanding plus days inventory on hand minus days payables outstanding.
- Accruals ratio
- The difference between net income and operating cash flow, scaled by average total assets.
- Free cash flow
- Cash from operations less capital expenditure.
- Beneish M-score
- An eight-variable model that screens for the likelihood of earnings manipulation.
- Net realizable value
- The estimated selling price less the costs to complete and sell.
Practice problems
Work each problem on paper first, then reveal the answer to check.
What was Bluestem's ratio of operating cash flow to net income in 2026, and what does it mean?
Show answer
0.57; earnings are increasingly made up of accruals rather than cash.
Calculate the 2026 cash conversion cycle from DSO 82.3, DIO 126.5 and DPO 68.5.
Show answer
82.3 + 126.5 - 68.5 = about 140.3 days.
Why might disputed milestone billings affect revenue as well as receivables?
Show answer
Revenue may have been recognized before the milestone was achieved.
What does a positive accruals ratio suggest for future earnings, according to research?
Show answer
Accruals tend to reverse, so future earnings tend to be lower.
Why is the receivables allowance a concern?
Show answer
Past-due balances rose from 7 to 18 percent, but the allowance stayed near one percent.
How should Bluestem treat 3.9 million of old-model stock with no sales in nine months?
Show answer
Assess net realizable value and write it down if it can be sold only at a discount.
Why are recurring integration costs a problem in adjusted EBITDA?
Show answer
They are normal costs that recur, so excluding them overstates sustainable performance.
Which Beneish index contributes most to Bluestem's score?
Show answer
The days sales in receivables index of about 1.16.
Is a Beneish score of minus 2.2 evidence that earnings are fairly stated?
Show answer
No; it is a screen, and individual indexes still point to areas to probe.
Write a one-sentence finding on Bluestem's working capital.
Show answer
The cash conversion cycle lengthened 45 days in two years, tying up about 22 million of cash.
Lesson quiz · 5 questions
Score 60% or more to complete this lesson.
Create a free account to save your progress, take quizzes and earn a certificate.