
ACCT-499 · Lesson 3 of 12 · 29 min
Financial statement analysis I: common-size, trends, ratios and DuPont
With the business understood, the team turns to the numbers. Financial statement analysis is familiar from ACCT-101, ACCT-102 and FIN-201: common-size statements, trend indexes, ratios and the DuPont decomposition. The capstone adds two demands. First, every calculation must answer a question in scope, in Bluestem's case why profit and cash are falling while revenue grows. A table of thirty ratios with no conclusion is not analysis. Second, every finding must be explained in the language of the business, so that a chief financial officer or a director can act on it. This lesson works through the core analysis and shows how the team turns numbers into findings.
Start with a question and a plan
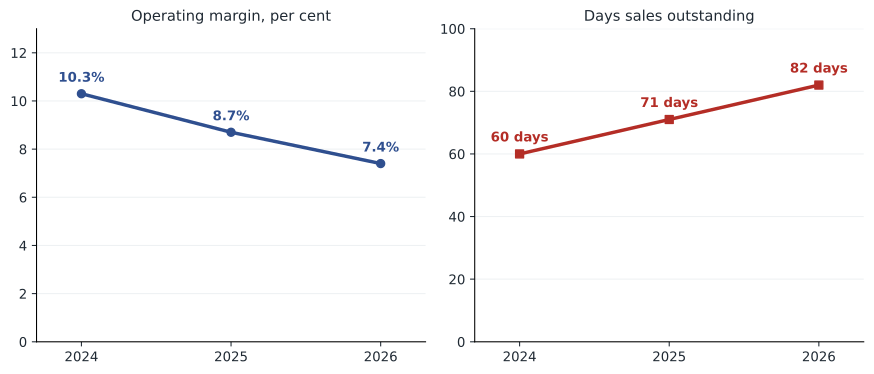
Liam, who leads the workstream, writes the question at the top of the working paper: "Why did operating margin fall from 10.3 to 7.4 percent, and net income from 13.4 to 10.1 million, while revenue rose 27 percent?" He then lists the possible explanations before calculating anything: lower gross margin from price pressure or cost increases; faster growth in operating expenses than revenue; higher amortization from the acquisition; higher interest from new borrowing; or a change in tax. Each explanation suggests a calculation, and each calculation either supports or eliminates an explanation. This hypothesis-driven approach keeps the analysis focused and makes the eventual explanation easy to follow.
The analysis uses the audited financial statements, which are the most reliable source, supplemented by management accounts for detail such as revenue by product line and customer. Where management accounts and audited figures disagree, the team reconciles them before using the detail. Reconciling sounds tedious, but it regularly uncovers misunderstandings: in Bluestem's case, management's "hardware revenue" included installation services that the financial statements group with hardware, and the team needed to know that before comparing margins with competitors.
Common-size and trend analysis
A common-size income statement expresses each line as a percentage of revenue, which removes the effect of growth and shows where the margin went. A trend index expresses each item as a percentage of its value in a base year, which shows which items grew faster than the business. The program calculates both.
# Bluestem Water Instruments Inc. (invented), in thousands of dollars, years ended December 31.
YEARS = [2024, 2025, 2026]
IS = {'Hardware revenue': [138000, 149500, 161200], 'Subscription revenue': [44000, 55600, 69800],
      'Hardware cost of sales': [82800, 92700, 104800], 'Subscription cost of sales': [11000, 13300, 16100],
      'Selling, general and admin': [42000, 48500, 56900], 'Research and development': [18200, 21000, 23600],
      'Depreciation': [6200, 6900, 7600], 'Amortization of intangibles': [3000, 4800, 4800],
      'Interest expense': [2100, 3900, 4600], 'Income tax expense': [3300, 2500, 2500]}
BS = {  # balances at December 31, 2023 to 2026
      'Cash': [18000, 24200, 25500, 23400], 'Receivables': [26000, 30000, 39800, 52100],
      'Inventories': [22000, 26000, 31500, 41900], 'Other current assets': [2800, 3000, 3600, 4100],
      'Property, plant and equipment': [45000, 48000, 51000, 53500], 'Right-of-use assets': [13000, 12000, 15500, 14800],
      'Intangible assets': [9000, 6000, 19200, 14400], 'Goodwill': [8000, 8000, 24000, 24000],
      'Payables': [15000, 17000, 19500, 22700], 'Accrued liabilities': [8000, 9000, 10500, 11200],
      'Deferred revenue': [11000, 14000, 18500, 21000], 'Warranty provision': [2300, 2500, 2700, 2600],
      'Income taxes payable': [1200, 1300, 900, 700], 'Lease liabilities': [13500, 13000, 16800, 16300],
      'Borrowings': [28000, 25000, 57000, 60000], 'Deferred tax liabilities': [1800, 2000, 2300, 2700],
      'Share capital': [40000, 40000, 40000, 42000], 'Retained earnings': [23000, 33400, 41900, 49000]}
CF = {'Cash from operations': [20900, 15900, 5800], 'Capital expenditure': [-8000, -8400, -8400],
      'Acquisition of Merrow Lane': [0, -34000, 0], 'Dividends paid': [-3000, -3000, -3000]}
def rev(i): return IS['Hardware revenue'][i] + IS['Subscription revenue'][i]
def cogs(i): return IS['Hardware cost of sales'][i] + IS['Subscription cost of sales'][i]
def ebit(i): return rev(i) - cogs(i) - sum(IS[k][i] for k in ('Selling, general and admin', 'Research and development', 'Depreciation', 'Amortization of intangibles'))
def ni(i): return ebit(i) - IS['Interest expense'][i] - IS['Income tax expense'][i]
ASSETS = ['Cash', 'Receivables', 'Inventories', 'Other current assets', 'Property, plant and equipment', 'Right-of-use assets', 'Intangible assets', 'Goodwill']
CUR_A = ASSETS[:4]
CUR_L = ['Payables', 'Accrued liabilities', 'Deferred revenue', 'Warranty provision', 'Income taxes payable']
LIABS = CUR_L + ['Lease liabilities', 'Borrowings', 'Deferred tax liabilities']
def tot(keys, t): return sum(BS[k][t] for k in keys)

# Lesson 3: common-size income statement and trend (index) analysis, 2024 = 100.
lines = ['Hardware cost of sales', 'Subscription cost of sales', 'Selling, general and admin',
         'Research and development', 'Depreciation', 'Amortization of intangibles']
print(f"{'Common-size (% of revenue)':32}" + "".join(f"{y:>8}" for y in YEARS))
for k in lines:
    print(f"{k:32}" + "".join(f"{IS[k][i] / rev(i):>8.1%}" for i in range(3)))
print(f"{'Operating income':32}" + "".join(f"{ebit(i) / rev(i):>8.1%}" for i in range(3)))
print(f"\n{'Trend index (2024 = 100)':32}" + "".join(f"{y:>8}" for y in YEARS))
series = {'Revenue': [rev(i) for i in range(3)], 'Receivables': BS['Receivables'][1:],
          'Inventories': BS['Inventories'][1:], 'Selling, general and admin': IS['Selling, general and admin'],
          'Warranty provision': BS['Warranty provision'][1:], 'Hardware revenue': IS['Hardware revenue']}
for k, v in series.items():
print(f"{k:32}" + "".join(f"{x / v[0] * 100:>8.0f}" for x in v))Common-size (% of revenue) 2024 2025 2026 Hardware cost of sales 45.5% 45.2% 45.4% Subscription cost of sales 6.0% 6.5% 7.0% Selling, general and admin 23.1% 23.6% 24.6% Research and development 10.0% 10.2% 10.2% Depreciation 3.4% 3.4% 3.3% Amortization of intangibles 1.6% 2.3% 2.1% Operating income 10.3% 8.7% 7.4% Trend index (2024 = 100) 2024 2025 2026 Revenue 100 113 127 Receivables 100 133 174 Inventories 100 121 161 Selling, general and admin 100 115 135 Warranty provision 100 108 104 Hardware revenue 100 108 117
The common-size statement locates the margin decline precisely. Hardware cost of sales is stable at about 45 percent of total revenue, but that hides a rise relative to hardware revenue, because hardware is a shrinking share of the total; the gross margin by line in Lesson 2 showed hardware margin falling five points. Subscription costs rose from 6.0 to 7.0 percent of revenue as the cloud service grew and Merrow Lane's hosting costs were added. Selling, general and administrative expenses rose from 23.1 to 24.6 percent of revenue. Amortization of acquired intangibles added almost a point after the acquisition. Taken together, these explain the three-point fall in operating margin.
The trend index tells the second half of the story. Revenue rose to 127 percent of its 2024 level, but receivables rose to 174 percent and inventories to 161 percent. Selling, general and administrative expenses grew faster than revenue. And the warranty provision barely moved, to 104 percent, while hardware revenue, which the warranty covers, grew to 117 percent. A provision that grows more slowly than the activity it covers is a classic signal that it may be understated, and Lesson 5 tests it.
Ratio analysis
Ratios compare related items and allow comparison over time and with peers. The program calculates the main liquidity, solvency, profitability and efficiency ratios for the three years.
# Bluestem Water Instruments Inc. (invented), in thousands of dollars, years ended December 31.
YEARS = [2024, 2025, 2026]
IS = {'Hardware revenue': [138000, 149500, 161200], 'Subscription revenue': [44000, 55600, 69800],
      'Hardware cost of sales': [82800, 92700, 104800], 'Subscription cost of sales': [11000, 13300, 16100],
      'Selling, general and admin': [42000, 48500, 56900], 'Research and development': [18200, 21000, 23600],
      'Depreciation': [6200, 6900, 7600], 'Amortization of intangibles': [3000, 4800, 4800],
      'Interest expense': [2100, 3900, 4600], 'Income tax expense': [3300, 2500, 2500]}
BS = {  # balances at December 31, 2023 to 2026
      'Cash': [18000, 24200, 25500, 23400], 'Receivables': [26000, 30000, 39800, 52100],
      'Inventories': [22000, 26000, 31500, 41900], 'Other current assets': [2800, 3000, 3600, 4100],
      'Property, plant and equipment': [45000, 48000, 51000, 53500], 'Right-of-use assets': [13000, 12000, 15500, 14800],
      'Intangible assets': [9000, 6000, 19200, 14400], 'Goodwill': [8000, 8000, 24000, 24000],
      'Payables': [15000, 17000, 19500, 22700], 'Accrued liabilities': [8000, 9000, 10500, 11200],
      'Deferred revenue': [11000, 14000, 18500, 21000], 'Warranty provision': [2300, 2500, 2700, 2600],
      'Income taxes payable': [1200, 1300, 900, 700], 'Lease liabilities': [13500, 13000, 16800, 16300],
      'Borrowings': [28000, 25000, 57000, 60000], 'Deferred tax liabilities': [1800, 2000, 2300, 2700],
      'Share capital': [40000, 40000, 40000, 42000], 'Retained earnings': [23000, 33400, 41900, 49000]}
CF = {'Cash from operations': [20900, 15900, 5800], 'Capital expenditure': [-8000, -8400, -8400],
      'Acquisition of Merrow Lane': [0, -34000, 0], 'Dividends paid': [-3000, -3000, -3000]}
def rev(i): return IS['Hardware revenue'][i] + IS['Subscription revenue'][i]
def cogs(i): return IS['Hardware cost of sales'][i] + IS['Subscription cost of sales'][i]
def ebit(i): return rev(i) - cogs(i) - sum(IS[k][i] for k in ('Selling, general and admin', 'Research and development', 'Depreciation', 'Amortization of intangibles'))
def ni(i): return ebit(i) - IS['Interest expense'][i] - IS['Income tax expense'][i]
ASSETS = ['Cash', 'Receivables', 'Inventories', 'Other current assets', 'Property, plant and equipment', 'Right-of-use assets', 'Intangible assets', 'Goodwill']
CUR_A = ASSETS[:4]
CUR_L = ['Payables', 'Accrued liabilities', 'Deferred revenue', 'Warranty provision', 'Income taxes payable']
LIABS = CUR_L + ['Lease liabilities', 'Borrowings', 'Deferred tax liabilities']
def tot(keys, t): return sum(BS[k][t] for k in keys)

# Lesson 3: ratio suite and three-step DuPont analysis.
def avg(k, t): return (BS[k][t] + BS[k][t - 1]) / 2
def eq(t): return BS['Share capital'][t] + BS['Retained earnings'][t]
print(f"{'Ratio':34}" + "".join(f"{y:>9}" for y in YEARS))
rows = {
    'Current ratio': lambda i, t: tot(CUR_A, t) / tot(CUR_L, t),
    'Quick ratio': lambda i, t: (BS['Cash'][t] + BS['Receivables'][t]) / tot(CUR_L, t),
    'Debt to equity incl. leases': lambda i, t: (BS['Borrowings'][t] + BS['Lease liabilities'][t]) / eq(t),
    'Interest coverage (times)': lambda i, t: ebit(i) / IS['Interest expense'][i],
    'Gross margin': lambda i, t: 1 - cogs(i) / rev(i),
    'Operating margin': lambda i, t: ebit(i) / rev(i),
    'Net margin': lambda i, t: ni(i) / rev(i),
    'Days sales outstanding': lambda i, t: BS['Receivables'][t] / rev(i) * 365,
    'Days inventory on hand': lambda i, t: BS['Inventories'][t] / cogs(i) * 365,
    'Asset turnover (times)': lambda i, t: rev(i) / ((tot(ASSETS, t) + tot(ASSETS, t - 1)) / 2),
}
pct = {'Gross margin', 'Operating margin', 'Net margin'}
for name, f in rows.items():
    vals = [f(i, i + 1) for i in range(3)]
    print(f"{name:34}" + "".join(f"{v:>9.1%}" if name in pct else f"{v:>9.2f}" if v < 20 else f"{v:>9.0f}" for v in vals))
print("\nDuPont: return on equity = net margin x asset turnover x equity multiplier")
for i, y in enumerate(YEARS):
    t = i + 1
    avgA = (tot(ASSETS, t) + tot(ASSETS, t - 1)) / 2
    avgE = (eq(t) + eq(t - 1)) / 2
    nm, at, em = ni(i) / rev(i), rev(i) / avgA, avgA / avgE
print(f" {y}: {nm:.1%} x {at:.2f} x {em:.2f} = ROE {nm * at * em:.1%}")Ratio 2024 2025 2026 Current ratio 1.90 1.93 2.09 Quick ratio 1.24 1.25 1.30 Debt to equity incl. leases 0.52 0.90 0.84 Interest coverage (times) 8.95 4.59 3.74 Gross margin 48.5% 48.3% 47.7% Operating margin 10.3% 8.7% 7.4% Net margin 7.4% 5.6% 4.4% Days sales outstanding 60 71 82 Days inventory on hand 101 108 126 Asset turnover (times) 1.21 1.12 1.05 DuPont: return on equity = net margin x asset turnover x equity multiplier 2024: 7.4% x 1.21 x 2.21 = ROE 19.6% 2025: 5.6% x 1.12 x 2.37 = ROE 14.8% 2026: 4.4% x 1.05 x 2.53 = ROE 11.7%
Liquidity looks comfortable at first glance: the current ratio rose from 1.90 to 2.09. But the rise comes from receivables and inventory, not cash, and both are growing faster than sales. A rising current ratio driven by slow-moving working capital is not good news; it is the balance sheet side of falling cash flow. The quick ratio, which excludes inventory, rose only slightly.
Solvency weakened. Borrowings and leases rose from about half of equity to almost 0.9 times equity after the Merrow Lane acquisition was financed with debt, and interest coverage fell from almost nine times to under four times. Bluestem's loan agreement, reviewed in Lesson 8, has covenants based on leverage and interest coverage, so the trend matters even though the company is not near a breach.
Efficiency ratios are the most revealing. Days sales outstanding rose from 60 to 82 days: customers are paying three weeks more slowly than two years ago. Days inventory on hand rose from 101 to 126 days. Asset turnover fell from 1.21 to 1.05, so each dollar of assets now produces less revenue. These are the ratios that explain the cash flow problem, and Lesson 4 turns them into a cash conversion cycle.
| Area | What the ratios show | Possible explanations to test |
|---|---|---|
| Profitability | Gross, operating and net margins all falling | Hardware pricing and costs; subscription hosting costs; acquisition amortization; higher interest |
| Liquidity | Current ratio up, but driven by receivables and inventory | Slower collections; inventory build-up or obsolete stock |
| Solvency | Leverage up; interest coverage down to 3.7 times | Acquisition financed by debt; weak operating cash flow |
| Efficiency | DSO up 22 days; inventory days up 25; asset turnover down | Extended payment terms; year-end revenue timing; poor inventory planning |
DuPont analysis
The DuPont identity breaks return on equity into net margin, asset turnover and the equity multiplier. It shows whether a change in return comes from profitability, from efficiency or from leverage. Bluestem's return on equity fell from 19.6 to 11.7 percent. The decomposition, in the output of the ratio program above, shows that net margin fell from 7.4 to 4.4 percent and asset turnover from 1.21 to 1.05, while the equity multiplier rose from 2.21 to 2.53. In other words, higher leverage partly propped up return on equity while both profitability and efficiency deteriorated. That is a more worrying picture than the fall in return on equity alone suggests: the company is earning less on more assets, financed with more debt.
An extended five-step DuPont separates the tax burden and interest burden from the operating margin, which helps when a change in financing or tax obscures operating performance. For Bluestem, the interest burden worsened as borrowings rose, and the tax burden was stable, so the five-step version confirms that the decline is operational with a financing effect on top.
Benchmarking
Ratios mean more alongside peers. In a real capstone, the team would collect the same ratios for three to six listed competitors from their filings, adjusting for differences in accounting policies, year ends and business mix. For Bluestem, the course provides an invented peer set: the median peer has an operating margin of about 11 percent, DSO of 62 days and inventory days of 95. Bluestem was close to the median in 2024 and is now well outside it on all three. Peer comparison has limits: no two companies are alike, and large global instrument makers have scale advantages a mid-sized company cannot match. The team therefore uses peers for direction and orders of magnitude, not for precise targets.
Remember that ratios computed from statements prepared under US GAAP can differ from those of peers using IFRS Accounting Standards. Under IFRS 16, nearly all lease costs appear as depreciation and interest, which raises EBITDA compared with US GAAP, where operating lease cost stays in operating expenses. When peers include IFRS reporters, adjust before comparing EBITDA-based measures.
From numbers to findings
A finding has four parts: what the team observed, how it measured it, why it matters, and what might explain it. Liam drafts the first financial finding for the interim meeting as follows: "Operating margin fell three points in two years (from 10.3 to 7.4 percent). About 0.8 points came from lower gross margin: hardware margin fell five points on price pressure and component costs, and the shift toward subscriptions offset about half of that. About 1.6 points came from operating expenses, mainly selling, general and administrative costs, growing faster than revenue, and about half a point from amortization of the Merrow Lane intangibles. If these trends continue, operating income will fall in 2027 even if revenue grows ten percent." The finding is specific, quantified, explained and forward-looking, and it leads naturally to recommendations.
Look at what the finding does not do. It does not list every ratio, it does not use jargon such as "equity multiplier" without explanation, and it does not claim more than the evidence supports. The appendix of the final report holds the full ratio tables for readers who want them; the body holds the conclusions.
Worked problem
Attributing a margin decline
Operating margin fell from 10.3 to 7.4 percent. Using the common-size output, attribute the decline to gross margin, operating expenses and amortization.
Show solution
- Gross margin fell from 48.5 to 47.7 percent, a fall of about 0.8 points at the consolidated level, but within that hardware margin fell five points and the mix shift to subscriptions offset about half of it.
- Selling, general and administrative expenses rose from 23.1 to 24.6 percent of revenue (1.5 points); research and development rose 0.2 points; depreciation fell 0.1 points.
- Amortization of intangibles rose from 1.6 to 2.1 percent (0.5 points).
- Sum: 0.8 + 1.5 + 0.2 - 0.1 + 0.5 = about 2.9 points, matching the fall from 10.3 to 7.4 percent.
Answer: About 0.8 points from gross margin (hardware erosion partly offset by mix), 1.6 points from operating expenses, and 0.5 points from amortization.
Common mistakes
MistakeCalculating every available ratio and presenting them all.
InsteadStart from the question and calculate the ratios that test each possible explanation.
MistakeReading a rising current ratio as better liquidity.
InsteadCheck whether it is driven by cash or by slow-moving receivables and inventory.
MistakeComparing EBITDA with peers under a different lease standard without adjustment.
InsteadAdjust for lease accounting differences before comparing EBITDA-based measures.
MistakeReporting return on equity without decomposing it.
InsteadUse DuPont to show whether changes come from margin, turnover or leverage.
MistakeStating findings without explaining why they matter.
InsteadWrite each finding as observation, measurement, significance and possible explanation.
Summary and key terms
- Begin with a question and list the possible explanations before calculating.
- Common-size statements locate margin changes; trend indexes show what grew faster than the business.
- Bluestem's margin fell about three points: gross margin, operating expenses and acquisition amortization.
- Receivables and inventories grew far faster than revenue; DSO rose from 60 to 82 days.
- DuPont shows return on equity falling despite higher leverage, a sign of weaker operations.
- Peers give direction, not precise targets, and need adjustment for accounting differences.
- Common-size statement
- A statement showing each line as a percentage of a base, usually revenue or total assets.
- Trend index
- Each year's value expressed as a percentage of a base year.
- Days sales outstanding (DSO)
- Receivables divided by revenue, times 365: the average collection period.
- Asset turnover
- Revenue divided by average total assets.
- Equity multiplier
- Average total assets divided by average equity, a measure of leverage.
- DuPont analysis
- The decomposition of return on equity into margin, turnover and leverage.
Practice problems
Work each problem on paper first, then reveal the answer to check.
Write the analysis question for Bluestem's financial analysis workstream.
Show answer
Why did margins and net income fall while revenue grew 27 percent in two years?
Which items grew faster than revenue between 2024 and 2026?
Show answer
Receivables (174), inventories (161) and selling, general and administrative expenses (135), against revenue at 127.
Why is the warranty trend a concern?
Show answer
The provision grew 4 percent while hardware revenue grew 17 percent, suggesting possible understatement.
Bluestem's current ratio rose to 2.09. Is liquidity better?
Show answer
Not necessarily; the rise comes from receivables and inventory rather than cash.
Decompose Bluestem's 2026 return on equity.
Show answer
4.4 percent net margin x 1.05 asset turnover x 2.53 equity multiplier = about 11.7 percent.
What did leverage do to return on equity between 2024 and 2026?
Show answer
It rose, partly offsetting the decline in margin and turnover.
Why reconcile management accounts to audited statements?
Show answer
To understand differences in definitions, such as installation services grouped with hardware, before using the detail.
How should the team use peer medians?
Show answer
For direction and orders of magnitude, adjusting for accounting and business differences.
Name the four parts of a well-written finding.
Show answer
Observation, measurement, significance and possible explanation.
Where should the full ratio tables go in the final report?
Show answer
In an appendix, with conclusions in the body.
Lesson quiz · 5 questions
Score 60% or more to complete this lesson.
Create a free account to save your progress, take quizzes and earn a certificate.