
ACCT-421 · Lesson 2 of 12 · 30 min
Designing KPIs, targets and OKRs
Lesson 1 argued that measurement serves decisions. This lesson is about designing the measures themselves: choosing key performance indicators (KPIs), defining them precisely, setting targets, reporting them so that people act, and avoiding the ways measures go wrong. It also introduces objectives and key results (OKRs), a goal-setting method popular in technology firms and increasingly used elsewhere, and the beyond budgeting movement, which questions fixed annual targets altogether. It finishes with an example of a measure Northgate did not have but needed: profitability by dealer after the cost of serving each one. ACCT-321 covered the structure of the balanced scorecard and strategy maps; the focus here is on the quality of individual measures and targets.
What makes a good KPI
A key performance indicator is a measure that tracks progress toward an objective that matters. The word key is important. Most organizations can measure hundreds of things, but only a handful are central to the strategy at any level. A useful discipline is to limit each management level to somewhere between five and fifteen KPIs and to be able to explain, for each one, which objective it serves and what decision it informs.
| Quality | Question to ask | Northgate example |
|---|---|---|
| Aligned | Does it measure progress on a strategic objective or critical success factor? | Service contract revenue share tracks the uptime strategy |
| Precisely defined | Would two analysts calculate the same number from the same data? | On-time means shipped by the date promised to the dealer, not the date requested |
| Controllable | Can the people held accountable influence it? | Plant managers control first-pass yield, not steel prices |
| Timely | Is it available soon enough to act on? | Weekly on-time delivery during peak season, not quarterly |
| Balanced | Is it paired with measures that stop it being gamed? | On-time delivery paired with expediting cost |
| Cost-effective | Is the value of the information greater than the cost of collecting it? | Dealer satisfaction surveyed twice a year, not monthly |
Precise definition deserves special attention because it is where many measures fail quietly. When Grace reviewed Northgate's on-time delivery figure, she found three different versions in use. Sales measured shipments against the date the dealer requested. The plant measured shipments against the date the scheduling system promised, which it often revised. Customer service measured arrival at the dealer. The three versions gave 81, 93 and 87 percent for the same quarter. The team agreed on one definition, documented in a KPI dictionary that records each measure's formula, data source, owner, frequency and known limitations, much like the data dictionaries described in ACCT-341.
Leading and lagging indicators
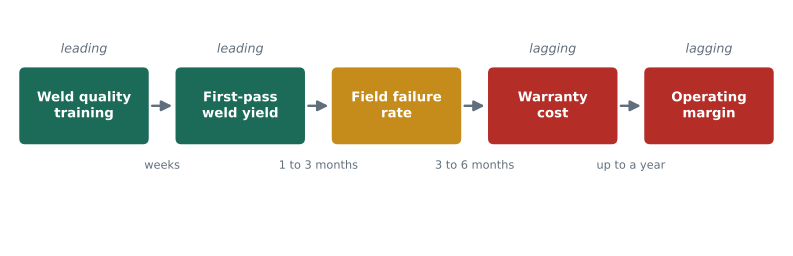
Lagging indicators report outcomes: profit, ROCE, warranty cost, market share. They are what the organization ultimately cares about, but by the time they move, it is often too late to change them for the current period. Leading indicators measure activities or conditions that are expected to drive future outcomes: weld defect rates today predict warranty claims next year; dealer satisfaction this spring predicts orders next season; the number of service contracts quoted predicts service revenue.
The link between a leading indicator and an outcome is a hypothesis, not a fact. It should be tested with data whenever possible. Northgate believed that faster response to dealer parts orders would raise service contract sales. When Grace examined three years of dealer data, she found a modest relationship for large dealers and none for small ones, which led the team to target parts response improvements at the 120 largest dealers first. Treating leading indicators as hypotheses keeps the measurement system honest and lets it improve over time.
Setting targets
A measure without a target says what happened; a target says what should have happened. Targets can be set in several ways, each with strengths and weaknesses. Historical targets, such as last year plus 5 percent, are easy to set but entrench past performance, good or bad. Benchmark targets, based on peers or best-in-class organizations, bring in an outside view but depend on comparable definitions. Model-based targets come from analysis of what is achievable, such as the capacity of a production line. Strategic targets, such as the board's 15 percent ROCE, express ambition and may be deliberately stretching.
Research on goal setting, associated with Edwin Locke and Gary Latham, found that specific, challenging goals generally lead to higher performance than vague goals such as do your best, provided that people accept the goals, have the ability to reach them and receive feedback. The same research and much management experience also show the risks of targets that are too hard or too tightly tied to rewards. People may give up, take excessive risks or meet the target in ways that damage other objectives. ACCT-321 discussed these issues in incentive design; for KPI design, the main lesson is to separate targets used for planning from targets used for rewards when the two pull in different directions.
Tolerance bands make targets more useful in reporting. Rather than labeling every result as either on target or not, a report can show results within an agreed band as acceptable and highlight only those outside it. The band should reflect normal variation: a measure that fluctuates by three percentage points from week to week for no particular reason should not trigger alarms when it moves by two. The statistical process control methods in BUS-230 provide one way to set such bands.
Reporting KPIs so people act
Grace's redesigned quarterly report for the executive team contains eight KPIs, each with a target, a tolerance band and a status. She keeps the calculation in a small program so that the logic is transparent and can be reviewed.
# Northgate quarterly KPI report: status against targets, with tolerance bands (invented data).
# direction +1 means higher is better; -1 means lower is better.
kpis = [
    # name,                          actual, target, tolerance, direction, weight
    ('ROCE, rolling 12 months (%)',    12.4,   15.0,   1.0,  +1, 0.20),
    ('Gross margin (%)',               29.0,   30.0,   1.0,  +1, 0.15),
    ('On-time delivery (%)',           93.0,   95.0,   3.0,  +1, 0.15),
    ('Dealer net promoter score',      36.0,   40.0,   5.0,  +1, 0.10),
    ('Warranty cost (% of sales)',      2.3,    1.5,   0.4,  -1, 0.10),
    ('Inventory days',                 95.0,   80.0,   8.0,  -1, 0.10),
    ('Service contract revenue (%)',    9.5,   12.0,   1.5,  +1, 0.10),
    ('Lost-time injury rate',           0.9,    1.0,   0.3,  -1, 0.10),
]
score = 0.0
print(f"{'KPI':32s} {'actual':>7s} {'target':>7s}  status  attainment")
for name, act, tgt, tol, dirn, w in kpis:
    gap = (act - tgt) * dirn                  # positive = better than target
    status = 'GREEN' if gap >= 0 else ('AMBER' if gap >= -tol else 'RED')
    attain = (act / tgt) if dirn > 0 else (tgt / act)
    attain = min(attain, 1.2)                 # cap so one KPI cannot dominate
    score += w * attain
    print(f"{name:32s} {act:7.1f} {tgt:7.1f}  {status:6s}  {attain:6.0%}")
print(f"\nWeighted attainment index: {score:.0%}")
counts = {s: 0 for s in ('GREEN', 'AMBER', 'RED')}
for name, act, tgt, tol, dirn, w in kpis:
    gap = (act - tgt) * dirn
    counts['GREEN' if gap >= 0 else ('AMBER' if gap >= -tol else 'RED')] += 1
print('Status count:', counts)KPI actual target status attainment
ROCE, rolling 12 months (%) 12.4 15.0 RED 83%
Gross margin (%) 29.0 30.0 AMBER 97%
On-time delivery (%) 93.0 95.0 AMBER 98%
Dealer net promoter score 36.0 40.0 AMBER 90%
Warranty cost (% of sales) 2.3 1.5 RED 65%
Inventory days 95.0 80.0 RED 84%
Service contract revenue (%) 9.5 12.0 RED 79%
Lost-time injury rate 0.9 1.0 GREEN 111%
Weighted attainment index: 89%
Status count: {'GREEN': 1, 'AMBER': 3, 'RED': 4}The report shows one measure in the green, three in the amber zone and four in the red. ROCE, warranty cost, inventory days and service contract revenue are all well short of target. The weighted attainment index, 89 percent, summarizes overall progress, but Grace is careful about how she presents it. A single index hides offsetting results and invites arguments about the weights. She uses it only as a headline, with the individual measures and their trends on the same page, and with a short commentary on each red item explaining the cause and the action under way.
Two details of the code matter. First, the direction of each measure is explicit, because for warranty cost, inventory days and injury rates, lower is better. Mistakes in direction are common in spreadsheets and can turn a deteriorating measure green. Second, attainment is capped at 120 percent, so that a large over-achievement on one measure cannot mask failures on others. Without the cap, an exceptional quarter for injury rates could lift the index even if delivery and quality were collapsing.
When measures go wrong
Measures change behavior, which is why organizations use them, but not always in the intended way. The economist Charles Goodhart observed that when a measure becomes a target, it tends to stop being a good measure, because people find ways to improve the number without improving the underlying performance. Common forms of this dysfunction include the following.
| Dysfunction | What happens | Example | Countermeasure |
|---|---|---|---|
| Gaming | Changing behavior to improve the number, not the result | Shipping incomplete orders to count them as on time | Precise definitions; paired measures; audits |
| Tunnel vision | Focusing on measured areas and neglecting unmeasured ones | Cutting preventive maintenance to meet a cost target | Balanced set of measures; qualitative review |
| Short-termism | Favoring results this period over future periods | Delaying a quality program to protect quarterly profit | Multi-period targets; leading indicators |
| Sub-optimization | Improving one unit at the expense of the whole | Plant maximizes output of products dealers do not need | Company-level measures; shared targets |
| Misrepresentation | Distorting or falsifying data | Backdating delivery confirmations | Data controls; separation of duties; culture |
| Ossification | Keeping measures after they stop being relevant | 64 measures in the monthly pack, mostly unused | Regular review and retirement of measures |
Several of these appeared at Northgate before Grace's redesign. The paint line was measured on units painted per shift, which encouraged supervisors to run long batches of bin sweeps, which are quick to paint, even when dealers were waiting for conveyors. The sales team was measured on revenue, which encouraged deep discounts at quarter end. Neither measure was wrong in itself; each was incomplete. The remedy was to pair the paint line measure with on-time delivery by product and to measure sales on gross margin as well as revenue.
OKRs
Objectives and key results is a goal-setting method developed at Intel in the 1970s and later popularized by Google. An objective is a qualitative statement of what the team wants to achieve; key results are a few measurable outcomes that show whether it has been achieved. OKRs are usually set quarterly, are public within the organization, are often deliberately ambitious so that reaching around 70 percent counts as success, and are kept separate from compensation decisions to encourage stretch.
OKRs differ from KPIs in emphasis rather than kind. KPIs tend to monitor ongoing performance against stable targets; OKRs focus on a few changes the team is trying to make in a period. Northgate's FP&A team uses both. Its KPIs track the business; its OKRs for the first quarter of 2027 include an objective to make dealer profitability visible, with key results such as producing cost-to-serve estimates for all 400 dealers, agreeing new order terms with the 50 least profitable, and presenting the analysis to the board. The risk with OKRs, as with any target system, is that key results become activities, such as hold three meetings, rather than outcomes.
Beyond budgeting
The beyond budgeting movement, associated with Jeremy Hope, Robin Fraser and companies such as the Scandinavian bank Handelsbanken and the Norwegian energy company Equinor, argues that fixed annual budgets do more harm than good. Budgets set months in advance become outdated, encourage gaming in the negotiation of targets, and tie resource allocation to an annual calendar rather than to opportunities as they arise. In their place, beyond budgeting proposes relative targets, such as performance compared with peers, rolling forecasts separated from targets, dynamic resource allocation and devolved decision making within clear values and boundaries.
Few organizations abandon budgets entirely, but many have adopted parts of the approach. Separating forecasts from targets is the most common, because when the forecast is also the target, managers have every reason to forecast low. Lesson 11 shows how Northgate uses rolling forecasts alongside its annual budget.
Measuring what was missing: dealer profitability
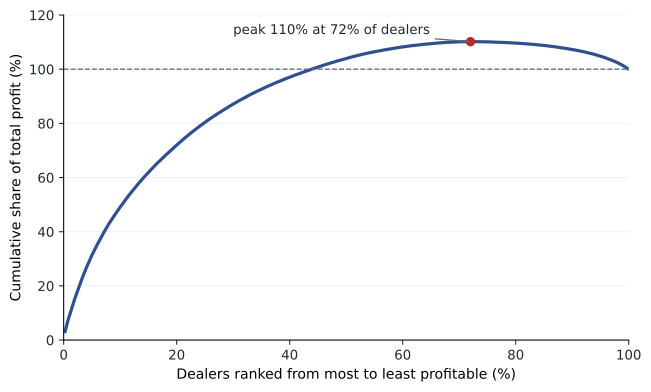
Northgate's reports showed gross margin by product and by region but not by dealer. Yet dealers differ greatly in what they cost to serve. Some place a few large orders a year; others place many small ones, demand rush shipping and need frequent visits from sales representatives. ACCT-222 introduced customer profitability analysis using time-driven activity-based costing. Grace applies the same idea to estimate cost to serve for each dealer from order counts, rush shipments and visits, and plots the result as a whale curve: dealers ranked from most to least profitable, with cumulative profit on the vertical axis.
# Northgate dealer profitability: the whale curve (simulated data for 400 dealers).
import random
random.seed(421)
dealers = []
for i in range(400):
    sales = random.lognormvariate(12.4, 0.9)            # annual sales in dollars
    gm = sales * random.uniform(0.22, 0.32)              # gross margin earned
    orders = max(4, int(random.lognormvariate(3.3, 0.7)))   # orders per year
    rush = random.random() < 0.15                        # dealers that demand rush shipping
    visits = random.choice([2, 4, 6, 12])                # sales rep visits per year
    cost_to_serve = orders * 520 + visits * 1400 + (orders * 900 if rush else 0) + 6000
    dealers.append((gm - cost_to_serve, sales, gm, cost_to_serve))
dealers.sort(reverse=True)
total = sum(d[0] for d in dealers)
cum, peak, peak_at = 0.0, 0.0, 0
for k, d in enumerate(dealers, 1):
    cum += d[0]
    if cum > peak:
        peak, peak_at = cum, k
losers = [d for d in dealers if d[0] < 0]
print(f"Total dealer profit after cost to serve: {total / 1e6:6.2f} million")
print(f"Peak of the whale curve:                  {peak / 1e6:6.2f} million "
      f"({peak / total:.0%} of total) after {peak_at} dealers ({peak_at / len(dealers):.0%})")
print(f"Unprofitable dealers: {len(losers)}  losing {-sum(d[0] for d in losers) / 1e6:.2f} million")
top20 = dealers[:80]
print(f"Top 20% of dealers earn {sum(d[0] for d in top20) / total:.0%} of total profit")
small = [d for d in losers if d[1] < 150000]
print(f"Loss-making dealers with sales under 150,000: {len(small)}")Total dealer profit after cost to serve: 21.02 million Peak of the whale curve: 23.15 million (110% of total) after 288 dealers (72%) Unprofitable dealers: 112 losing 2.14 million Top 20% of dealers earn 72% of total profit Loss-making dealers with sales under 150,000: 102
The curve rises steeply, peaks and then falls, which gives it the shape of a whale breaching. The 288 most profitable dealers, 72 percent of the network, generate 23.2 million of profit after cost to serve, 110 percent of the 21.0 million total. The remaining dealers erode 2.1 million. Almost all of the 112 loss-making dealers are small: 102 of them buy less than 150,000 dollars a year, and many of them place frequent small orders with rush shipping. The top fifth of dealers earn 72 percent of total profit.
The analysis does not mean Northgate should drop 112 dealers. Some small dealers serve remote areas where Northgate has no other presence; some may grow; and some of the cost to serve is fixed in the short run, so dropping a dealer would not save it all. What the analysis does is turn an invisible problem into a measurable one and point to actions: minimum order sizes or small-order fees, charges for rush shipping, moving small dealers to an online ordering portal and visiting them less often. Northgate estimates these steps could recover about half of the 2.1 million lost on unprofitable dealers. The capstone includes this as one of the initiatives in the ROCE bridge.
Worked problem
Reading the whale curve
If Northgate could bring every loss-making dealer to break-even without losing any sales, what would total dealer profit be?
Show solution
- Total dealer profit is 21.0 million.
- Loss-making dealers currently reduce profit by 2.1 million.
- Bringing them to break-even removes that loss: 21.0 + 2.1 = 23.1 million.
Answer: About 23.1 million, close to the peak of the whale curve.
Common mistakes
MistakeMeasuring everything that can be measured.
InsteadLimit each level to the few KPIs that serve its objectives and decisions.
MistakeLeaving KPI definitions to whoever builds the report.
InsteadKeep a KPI dictionary with formula, source, owner, frequency and limitations.
MistakeTreating the link between a leading indicator and an outcome as proven.
InsteadTest the relationship with data and revise it.
MistakeFlagging every result that misses target, however small the gap.
InsteadUse tolerance bands that reflect normal variation.
MistakeUsing a single weighted index as the main message.
InsteadShow individual measures, trends and commentary alongside any summary index.
MistakeDropping unprofitable customers immediately.
InsteadLook for pricing, service and channel changes first, and consider which costs are truly avoidable.
Summary and key terms
- A good KPI is aligned, precisely defined, controllable, timely, balanced and cost-effective.
- Leading indicators predict outcomes; the link is a hypothesis to test with data.
- Specific, challenging targets tend to raise performance if they are accepted, achievable and paired with feedback.
- Tolerance bands, explicit direction and caps on attainment make KPI reports more reliable.
- Measures can cause gaming, tunnel vision, short-termism, sub-optimization and misrepresentation.
- OKRs set a few ambitious, measurable outcomes for a period and are usually kept separate from pay.
- Beyond budgeting separates forecasts from targets and favors relative targets and dynamic allocation.
- Northgate's whale curve shows 112 loss-making dealers eroding 2.1 million of profit.
- Key performance indicator (KPI)
- A measure that tracks progress toward an important objective.
- KPI dictionary
- A document that defines each KPI's formula, data source, owner, frequency and limitations.
- Tolerance band
- A range around a target within which results are treated as acceptable.
- Goodhart's law
- The observation that a measure used as a target tends to lose its value as a measure.
- Objectives and key results (OKRs)
- A goal-setting method pairing a qualitative objective with a few measurable key results.
- Beyond budgeting
- A management model that replaces fixed annual budgets with relative targets, rolling forecasts and devolved decisions.
- Cost to serve
- The costs of selling to, delivering to and supporting a particular customer.
- Whale curve
- A chart of cumulative profit with customers ranked from most to least profitable.
Practice problems
Work each problem on paper first, then reveal the answer to check.
Why did Northgate have three different on-time delivery figures?
Show answer
Different departments measured against different dates: requested, promised and arrival.
In the KPI report, why is direction recorded for each measure?
Show answer
For some measures lower is better; without direction, a worsening measure could be shown as improving.
What would happen to the weighted index if attainment were not capped?
Show answer
A large over-achievement on one measure could hide failures on others.
Change on-time delivery in the report to 91.5. What status does it receive?
Show answer
RED, because it is more than 3 points below the 95 target.
Give an example of tunnel vision.
Show answer
Cutting preventive maintenance to meet a cost target.
How do OKRs typically differ from KPIs?
Show answer
OKRs focus on a few changes for a period and are often ambitious; KPIs monitor ongoing performance.
What is the main practical idea most organizations take from beyond budgeting?
Show answer
Separating forecasts from targets.
In the whale curve, what share of total profit do the most profitable 72% of dealers earn?
Show answer
About 110%.
Why might Northgate keep some loss-making dealers?
Show answer
They may serve remote areas, may grow, or have costs that are fixed in the short run.
Name two actions that could improve the profitability of small dealers.
Show answer
Minimum order sizes or small-order fees, rush shipping charges, an online portal and fewer visits.
Lesson quiz · 5 questions
Score 60% or more to complete this lesson.
Create a free account to save your progress, take quizzes and earn a certificate.