
ACCT-421 · Lesson 1 of 12 · 29 min
Performance management: linking strategy, decisions and results
Performance management is the set of processes an organization uses to turn its strategy into decisions, track whether those decisions are working and change course when they are not. Management accountants sit at the center of it. They build the measures, run the models behind major decisions, prepare the budgets and forecasts, and explain the gap between what was planned and what happened. In the United States, much of this material appears in the CMA examination and in the Business Analysis and Reporting (BAR) discipline section of the CPA examination; in Canada it forms the CPA Performance Management elective. This course takes an integrated view: it treats measurement, decision analysis, pricing, capital investment and risk as parts of one system rather than separate techniques.
The course builds on earlier work rather than repeating it. ACCT-222 covered cost systems, activity-based costing, standard costing and variances. ACCT-321 covered management control systems, responsibility centers, return on investment, residual income and economic value added, transfer pricing, the balanced scorecard and incentive design. FIN-201 covered the mechanics of discounted cash flow, and BUS-450 covered strategic analysis. Here the focus is on using those tools to make and evaluate decisions: which products to make, what to charge, which investments to fund, how to plan under uncertainty, and how to tell whether the whole system is moving the organization toward its goals.
The running example
Every lesson follows one invented company. Northgate Equipment Inc. is a privately held manufacturer based in Minneapolis, Minnesota, with about 640 employees and revenue of 148 million dollars in fiscal 2026. It has three divisions. Farm Systems makes grain augers, conveyors and bin sweeps sold through about 400 independent dealers across the northern Plains and the Canadian Prairies. Industrial Drives makes gearboxes and drive units, partly for Farm Systems and partly for outside customers. Parts and Service sells replacement parts and service contracts. Around 30 percent of sales are invoiced in Canadian dollars.
The chief financial officer, Anita Sandhu, has been asked by the board to raise return on capital employed (ROCE) from just over 12 percent to 15 percent within two years, without taking on new debt. The financial planning and analysis (FP&A) team is led by Marcus Lavoie, and its newest member is Grace Odum, a recent accounting graduate. Over the course, the team will work through the decisions that could close the gap: a bottleneck in the paint line, a make-or-buy question on gearbox housings, a new connected-sensor product called GrainSense, a robotic welding cell, a constrained capital budget and a volatile steel market. The final lesson brings the pieces together.
| Item | Fiscal 2026 | Comment |
|---|---|---|
| Revenue | 148.0 million | Farm Systems about 53%, Industrial Drives 31%, Parts and Service 16% |
| Materials | 41% of revenue | Steel is the largest single input |
| Conversion costs | 30% of revenue | About 60% vary with volume |
| Selling, general and administrative | 31.1 million | Mostly fixed in the short run |
| Operating profit | 11.8 million | Operating margin 8.0% |
| Capital employed | 95.4 million | Fixed assets 52.0 million plus working capital |
| ROCE | 12.4% | Board target 15% |
What performance management involves
Performance management can be described as a cycle with five linked activities. First, the organization sets direction: its mission, its strategy and the few objectives that matter most. Second, it translates that direction into plans, targets and resource allocations, through budgets, capital plans and operating plans. Third, managers make decisions within those plans, such as what to produce, what to charge and what to buy. Fourth, the organization measures results, both financial and non-financial, and compares them with the plan and with what it learns about its environment. Fifth, it learns and adapts, revising decisions, plans or even strategy. Then the cycle repeats.
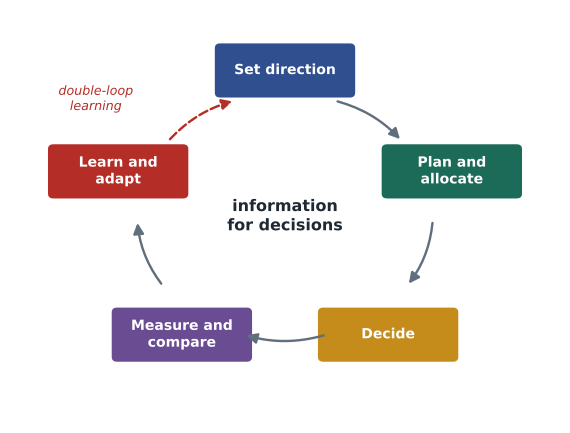
Two features of this cycle deserve emphasis. The first is that measurement is only one part of it. Organizations that equate performance management with a dashboard of key performance indicators tend to measure a great deal and change very little. The second is the distinction between single-loop and double-loop learning, terms introduced by Chris Argyris. Single-loop learning corrects deviations from the plan: if costs are over budget, find out why and bring them back. Double-loop learning asks whether the plan, the targets or the strategy were right in the first place. A company whose margins are falling because the market is shifting needs double-loop learning; cutting costs to hit an outdated budget will not save it.
From strategy to measures and decisions
Strategy is a set of choices about where to compete and how to win. BUS-450 discussed the main frameworks: industry analysis, resources and capabilities, and generic strategies such as cost leadership and differentiation. For performance management, the key step is to identify the critical success factors that the strategy depends on, and then the measures and decisions that drive those factors.
Northgate's strategy, approved by its board in 2025, is to move from selling equipment to selling uptime. Farmers lose money when an auger or conveyor breaks during harvest. Northgate believes it can earn higher and steadier margins by combining robust equipment with fast parts supply, service contracts and, eventually, connected sensors that warn of problems before they happen. The critical success factors that follow include product reliability, on-time delivery to dealers during the spring and harvest peaks, a strong dealer network, growth in service revenue and cost competitiveness against a low-cost importer that entered the market in 2024.
Each critical success factor points to measures, which lesson 2 develops, and to decisions, which the rest of the course analyses. Reliability points to warranty cost, field failure rates and the design choices made through target costing. On-time delivery points to the paint line bottleneck and the product mix. Cost competitiveness points to make-or-buy decisions and automation. Service growth points to pricing and to the GrainSense investment. The value of making these links explicit is that it lets the accountant ask of any proposed decision or measure: which success factor does this serve, and how would we know if it worked?
Value driver trees
A value driver tree breaks a financial objective into the operational drivers that determine it. At the top sits the objective, here ROCE. Beneath it are its two components, operating margin and capital turnover, because ROCE equals operating profit divided by revenue, multiplied by revenue divided by capital employed. Each of those breaks down further: margin into price, volume, material costs, conversion costs and overheads; turnover into fixed assets, inventory, receivables and payables. At the bottom are drivers that managers can actually influence, such as steel cost per metric ton, inventory days or the dealer payment terms.
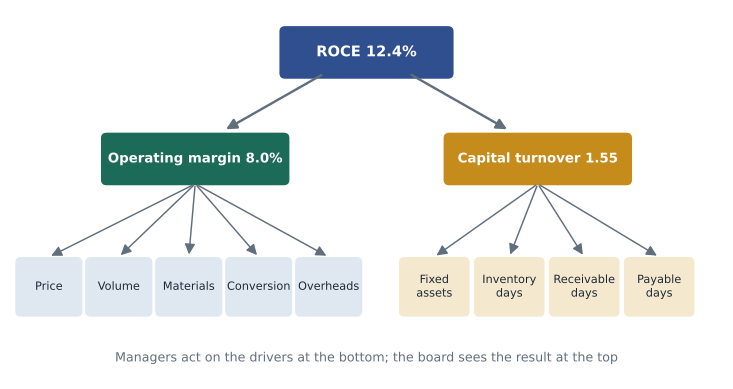
Grace builds Northgate's value driver tree as a small program, so that the team can test how much each driver matters. She uses the fiscal 2026 figures and asks a simple question: if each driver improved by a plausible amount, how much would ROCE rise?
# Northgate value driver tree: return on capital employed (ROCE) built up from its drivers.
# All figures are invented, in millions of dollars, for fiscal 2026.
base = dict(revenue=148.0, material_pct=0.41, conversion_pct=0.30, conv_variable=0.60,
            sga=31.12, fixed_assets=52.0, inv_days=95, rec_days=58, pay_days=45)

def roce(d):
    material = d['revenue'] * d['material_pct']
    conversion = d['revenue'] * d['conversion_pct']
    profit = d['revenue'] - material - conversion - d['sga']
    cogs = material + conversion
    inventory = cogs * d['inv_days'] / 365
    receivables = d['revenue'] * d['rec_days'] / 365
    payables = material * d['pay_days'] / 365
    capital = d['fixed_assets'] + inventory + receivables - payables
    return profit, capital, profit / capital

p, c, r = roce(base)
print(f"Operating profit {p:6.2f}  margin {p / base['revenue']:.1%}")
print(f"Capital employed {c:6.2f}  turnover {base['revenue'] / c:.2f}")
print(f"ROCE {r:.2%}  (target 15.00%)")
print()

def scenario(name, **chg):
    d = dict(base)
    for k, v in chg.items():
        d[k] = v(d) if callable(v) else v
    _, _, r2 = roce(d)
    return name, (r2 - r) * 100

def volume_up(d):
    # 1% more units: revenue and variable costs rise, fixed conversion and SG&A do not
    fixed_conv = base['revenue'] * base['conversion_pct'] * (1 - base['conv_variable'])
    var_conv = base['revenue'] * base['conversion_pct'] * base['conv_variable'] * 1.01
    d['revenue'] = base['revenue'] * 1.01
    return (fixed_conv + var_conv) / d['revenue']

tests = [
    scenario('Price +1%', revenue=base['revenue'] * 1.01,
             material_pct=base['material_pct'] / 1.01, conversion_pct=base['conversion_pct'] / 1.01),
    scenario('Volume +1%', conversion_pct=volume_up),
    scenario('Material cost -1%', material_pct=base['material_pct'] * 0.99),
    scenario('Conversion cost -1%', conversion_pct=base['conversion_pct'] * 0.99),
    scenario('SG&A -1%', sga=base['sga'] * 0.99),
    scenario('Inventory -10 days', inv_days=base['inv_days'] - 10),
    scenario('Receivables -5 days', rec_days=base['rec_days'] - 5),
]
print('Change in ROCE (percentage points) for each improvement:')
for name, d in sorted(tests, key=lambda t: -t[1]):
print(f" {name:22s} {d:+.2f}")Operating profit 11.80 margin 8.0% Capital employed 95.39 turnover 1.55 ROCE 12.37% (target 15.00%) Change in ROCE (percentage points) for each improvement: Price +1% +1.52 Material cost -1% +0.65 Volume +1% +0.58 Conversion cost -1% +0.48 Inventory -10 days +0.38 SG&A -1% +0.33 Receivables -5 days +0.27
The model reproduces the reported figures: operating profit of 11.8 million on capital employed of 95.4 million gives a ROCE of 12.37 percent. The sensitivity results are revealing. A 1 percent price increase, holding volumes, adds 1.52 percentage points to ROCE, more than twice as much as any other single change of similar size. That is because a price increase falls straight to operating profit, while a volume increase brings extra variable costs with it. Material cost matters next, because materials are 41 percent of revenue. The working capital levers, cutting inventory by ten days or receivables by five days, add less but require no change to customers or suppliers' prices and release cash as well.
The model also shows why the board's target is hard. To close a 2.6-point gap, Northgate would need something like a 1 percent price increase plus a 1 percent material saving plus a meaningful cut in inventory, all at once, and sustained. No single initiative will do it. That is why the course treats performance management as a portfolio of decisions whose combined effect has to be estimated and tracked, and why the capstone returns to this tree to bridge from 12.4 to 15 percent.
Worked problem
Using the driver tree
Northgate's operating margin is 8.0 percent and its capital turnover is 1.55. If the margin rose to 9.0 percent with no change in turnover, what would ROCE be?
Show solution
- ROCE equals margin multiplied by turnover.
- At present: 8.0% × 1.55 = 12.4%.
- With a 9.0% margin: 9.0% × 1.55 = 13.95%.
Answer: About 14.0 percent. A one-point improvement in margin is worth about 1.55 points of ROCE at this level of turnover.
Levels of performance management
Performance management operates at several levels, and each needs different information. At the strategic level, the board and senior executives need a small number of measures that show whether the strategy is working, plus the analysis behind major commitments such as acquisitions or large capital projects. At the business unit or divisional level, managers need measures that reflect what they control, which ACCT-321 discussed under responsibility accounting. At the operational level, supervisors need timely, specific information: the paint line's output per shift, the scrap rate on a welding station, the backlog of dealer orders.
A common failure is to push strategic measures down to operational levels where nobody can act on them, or to roll operational measures up to the board where they create noise. A useful test is whether the person who receives a measure can name at least one action they would take if it moved. Grace finds that Northgate's monthly management pack, inherited from a previous controller, contains 64 measures, sent to the same 30 people. Few of the recipients can explain what they would do with most of them. Lesson 2 returns to how she redesigns it.
| Level | Typical users | Information needs | Northgate example |
|---|---|---|---|
| Strategic | Board, executive team | Few measures tied to strategy; major decision analysis; risk | ROCE, service revenue share, dealer satisfaction |
| Divisional | Division general managers | Controllable profit and investment; division-specific drivers | Farm Systems contribution, inventory days, warranty cost |
| Operational | Plant managers, supervisors | Timely, specific, physical measures | Paint line units per shift, first-pass weld yield |
Financial and non-financial measures
Financial measures such as operating profit, ROCE and cash flow have obvious strengths. They are comparable across units, they connect directly to what owners care about and they are audited or at least reconciled to the books. Their weaknesses are equally familiar. They report outcomes after the fact, they can be improved in the short term at the expense of the long term, for example by cutting maintenance or training, and they say little about why results occurred.
Non-financial measures such as on-time delivery, defect rates and customer satisfaction fill some of those gaps. They are often leading indicators: a fall in dealer satisfaction this quarter predicts lower orders next season. They are usually closer to what operational managers control. Their weaknesses are that they are harder to compare, easier to define loosely and sometimes only loosely connected to value. A balanced set, the idea behind the balanced scorecard covered in ACCT-321, combines both kinds and makes the hypothesized links between them explicit.
Where the management accountant adds value
The management accountant's role in performance management has shifted over the past two decades. Routine reporting is now largely automated, and analytics tools, discussed in ACCT-341, make it possible for operational managers to explore data themselves. What remains distinctive is judgment: framing decisions correctly, identifying relevant costs and benefits, modeling uncertainty honestly, challenging optimistic assumptions and explaining results in terms that lead to action.
The Institute of Management Accountants' Statement of Ethical Professional Practice sets out the duties of competence, confidentiality, integrity and credibility; the AICPA Code of Professional Conduct applies similar principles to CPAs in business. In this context, integrity and credibility mean resisting pressure to shade an analysis toward a decision someone has already made, and disclosing the limits of a model rather than presenting a single precise number as if it were certain.
Throughout the course, every major analysis will end with the same three questions. What does the number say? How confident are we in it? What would change the decision? Those questions are the core of the management accountant's contribution.
Common mistakes
MistakeTreating performance management as producing a dashboard of KPIs.
InsteadTreat it as a cycle of direction, planning, decisions, measurement and learning; measures serve decisions.
MistakePursuing a ROCE target with a single large initiative.
InsteadUse a value driver tree to see which combination of drivers can realistically close the gap.
MistakeSending every measure to every manager.
InsteadGive each level the measures it can act on, and test whether recipients know what they would do if a measure moved.
MistakeCorrecting budget variances without asking whether the budget still makes sense.
InsteadUse double-loop learning: question targets and strategy when the environment changes.
MistakePresenting a single precise forecast as certain.
InsteadReport the range of outcomes and the assumptions that drive it.
Summary and key terms
- Performance management turns strategy into plans and decisions, measures results and adapts.
- The cycle includes setting direction, planning, deciding, measuring and learning; measurement is only one part.
- Double-loop learning questions targets and strategy, not just deviations from plan.
- Critical success factors link strategy to the measures and decisions that matter.
- A value driver tree breaks ROCE into margin and turnover and then into controllable drivers.
- At Northgate, a 1% price increase is worth about 1.5 points of ROCE, more than any other single lever tested.
- Different levels of the organization need different information; measures should be actionable by their recipients.
- The management accountant's distinctive contribution is judgment about relevance, uncertainty and action.
- Performance management
- The processes that link strategy to plans, decisions, measurement and learning.
- Critical success factor
- Something the strategy cannot succeed without, such as on-time delivery or product reliability.
- Value driver tree
- A diagram or model that breaks a financial objective into the operational drivers that determine it.
- Return on capital employed (ROCE)
- Operating profit divided by capital employed.
- Capital turnover
- Revenue divided by capital employed.
- Single-loop learning
- Correcting deviations from a plan without questioning the plan itself.
- Double-loop learning
- Questioning the assumptions, targets or strategy behind a plan.
- Leading indicator
- A measure that tends to change before the outcome it predicts.
- Lagging indicator
- A measure that reports an outcome after it has occurred.
Practice problems
Work each problem on paper first, then reveal the answer to check.
What are the five activities in the performance management cycle?
Show answer
Set direction, plan and allocate, decide, measure and compare, learn and adapt.
Why does a 1% price increase raise Northgate's ROCE more than a 1% volume increase?
Show answer
Extra price falls straight to profit; extra volume brings extra variable costs.
Change the program so inventory falls by 20 days instead of 10. What happens to the improvement?
Show answer
It roughly doubles, to about 0.79 points, because capital employed falls by about twice as much.
Give an example of double-loop learning at Northgate.
Show answer
Questioning whether the equipment-only strategy still works after a low-cost importer entered the market, rather than just cutting costs to meet budget.
Northgate's margin is 8.0% and turnover 1.55. What turnover would give 15% ROCE at the same margin?
Show answer
About 1.88.
Name two critical success factors in Northgate's uptime strategy.
Show answer
Product reliability and on-time delivery during peak seasons, among others.
Why might a non-financial measure be a leading indicator?
Show answer
It captures conditions, such as customer satisfaction, that affect financial results in later periods.
What test helps decide whether a measure belongs in a manager's report?
Show answer
Whether the manager can name an action they would take if the measure moved.
What did ACCT-321 cover that this course builds on?
Show answer
Responsibility centers, ROI, residual income, EVA, transfer pricing, the balanced scorecard and incentives.
What three questions should end every major analysis?
Show answer
What the number says, how confident we are, and what would change the decision.
Lesson quiz · 5 questions
Score 60% or more to complete this lesson.
Create a free account to save your progress, take quizzes and earn a certificate.