
ACCT-421 · Lesson 12 of 12 · 32 min
Capstone: quality, sustainability and an integrated performance plan
Eleven lessons have each taken one part of Northgate's challenge: raise return on capital employed from about 12.4 percent to 15 percent within two years, without new debt. This final lesson adds two areas of performance that cut across every division, the cost of quality and sustainability, and then brings the course together. The FP&A team must assemble the initiatives from earlier lessons into one plan, test it against the board's risk appetite, present it so that directors can make a decision, and design the measures that will show whether it is working. Along the way, the lesson returns to the professional and ethical duties that sit behind every number a management accountant produces.
Where the team stands
By the start of 2027 the team has analyzed six candidate initiatives. Each was developed in an earlier lesson, and each has a different profile of profit, capital and confidence.
| Initiative | Lesson | Annual profit effect (millions) | Capital (millions) | Main uncertainty |
|---|---|---|---|---|
| Second paint booth | 4 and 5 | 0.55 after depreciation | +2.6 | Whether demand fills the extra capacity |
| Robotic welding cell | 9 | 0.69 after depreciation | +4.2 | Labor savings and ramp-up time |
| 1% better price realization | 7 | 1.48 | 0 | Dealer and competitor reaction |
| Quality program | 12 | 1.50 | 0 | Whether failure costs fall as planned |
| Dealer cost-to-serve terms | 2 | 1.07 | 0 | Dealer acceptance and lost volume |
| Inventory down 15 days | 1 | 0 | -4.32 | Service levels during peak season |
Three of the initiatives raise profit without new capital, two add capital to earn more profit, and one releases capital. Because ROCE is a ratio, both sides matter: the welding cell has a positive NPV, as lesson 9 showed, but in the first years it adds more to capital employed than it adds to profit, so on its own it barely moves ROCE. That is a familiar tension from ACCT-321's discussion of return on investment, and it is why the board's target should be read as a test of the whole plan rather than a hurdle for each project.
The cost of quality
The quality program is the one initiative not yet analyzed. Quality costs are usually classified into four groups, an approach associated with Armand Feigenbaum and Joseph Juran. Prevention costs are incurred to stop defects happening: design reviews, supplier qualification, process improvement and training. Appraisal costs are incurred to find defects before products reach customers: inspection, testing and calibration. Internal failure costs arise when defects are found before delivery: scrap, rework, downtime and re-inspection. External failure costs arise when defects reach customers: warranty claims, field repairs, returns, recalls and, hardest to measure, lost future sales and damaged reputation. Prevention and appraisal are costs of conformance; internal and external failure are costs of non-conformance.
| Category | Examples at Northgate | Behavior |
|---|---|---|
| Prevention | Weld procedure qualification, supplier audits, design reviews for GrainSense | Discretionary; spending here reduces later failures |
| Appraisal | Weld testing, paint thickness gauging, final inspection | Partly discretionary; finds but does not prevent defects |
| Internal failure | Scrap steel, rework on the paint line, re-runs | Falls as process capability improves |
| External failure | Warranty claims, dealer field repairs, freight on returns | Most expensive per defect; includes hidden costs |
Most cost systems do not report quality costs as such. Scrap may sit in materials variances, rework in direct labor, warranty in selling expenses and inspection in factory overhead. Building a cost of quality report means pulling these items together, which is itself a useful exercise: managers are often surprised by the total. Northgate's team did this for fiscal 2025 and then prepared a plan for 2027 that shifts spending toward prevention.
# Cost of quality at Northgate before and after a quality program (invented data, thousands of dollars).
sales = {'2025': 141000, '2027 plan': 152000}
coq = {
    'Prevention':       {'2025': 420,  '2027 plan': 980},   # design reviews, supplier audits, training
    'Appraisal':        {'2025': 1150, '2027 plan': 1300},  # inspection, weld testing, gauge calibration
    'Internal failure': {'2025': 2650, '2027 plan': 1700},  # scrap, rework, paint line re-runs
    'External failure': {'2025': 3240, '2027 plan': 1980},  # warranty claims, field repairs, returns
}
for yr in sales:
    total = sum(c[yr] for c in coq.values())
    conformance = coq['Prevention'][yr] + coq['Appraisal'][yr]
    print(f"{yr}: total cost of quality {total:6,} ({total / sales[yr]:.1%} of sales); "
          f"conformance {conformance / total:.0%}, failure {1 - conformance / total:.0%}")
    for k, c in coq.items():
        print(f"    {k:17s} {c[yr]:6,}")
saving = sum(c['2025'] for c in coq.values()) * 152000 / 141000 - sum(c['2027 plan'] for c in coq.values())
print(f"Saving versus 2025 cost of quality at the same share of sales: {saving:,.0f}")
warranty_pct = coq['External failure']['2027 plan'] / sales['2027 plan']
print(f"External failure as % of sales in the plan: {warranty_pct:.1%}")2025: total cost of quality 7,460 (5.3% of sales); conformance 21%, failure 79%
Prevention 420
Appraisal 1,150
Internal failure 2,650
External failure 3,240
2027 plan: total cost of quality 5,960 (3.9% of sales); conformance 38%, failure 62%
Prevention 980
Appraisal 1,300
Internal failure 1,700
External failure 1,980
Saving versus 2025 cost of quality at the same share of sales: 2,082
External failure as % of sales in the plan: 1.3%The results follow the classic pattern. In 2025, total quality costs were 7.46 million, about 5.3 percent of sales, and almost four-fifths of that was failure. The plan more than doubles prevention spending, adds a little appraisal, and expects internal and external failure to fall sharply, bringing the total to 3.9 percent of sales. At 2027 sales levels, the saving against the 2025 cost structure is about 2.08 million. The capstone plan counts only 1.50 million of this as new profit, because the 2027 budget already assumed part of the warranty reduction when it set the warranty provision. Counting the full saving would double-count it.
Two cautions apply. First, the hidden costs of external failure, mainly lost sales and reputation, do not appear in the report at all, so the true benefit of reducing them is probably larger than the numbers show. Second, the traditional view that there is an optimal level of defects, where the marginal cost of prevention equals the marginal saving in failure, has largely given way to the view associated with total quality management and Six Sigma that prevention usually pays well beyond the point accountants expect, because failure costs are understated and process improvement compounds. Northgate's team presents the 1.50 million as a conservative estimate and recommends tracking first-pass yield and the 90-day field failure rate, two of the leading indicators from lesson 2, to see whether the program is working before the financial results arrive.
Sustainability as performance
ACCT-321 covered non-financial and sustainability measures as part of a management control system. This lesson takes the planning view: how sustainability affects Northgate's decisions and the information its stakeholders will ask for. Northgate is private and far below the size at which climate disclosure rules apply to it directly, but that does not mean it can ignore the subject. Its largest dealers, its bank and two industrial customers that buy gearboxes have all asked for emissions data in the past year, because they need it for their own reporting and lending decisions.
| Area | Canada | United States |
|---|---|---|
| Standard setter | Canadian Sustainability Standards Board (CSSB) | No national standard setter for sustainability reporting |
| Standards | CSDS 1 and CSDS 2, issued 18 December 2024 and adapted from ISSB IFRS S1 and S2; voluntary for periods beginning on or after 1 January 2025 | Companies may use ISSB, GRI or other frameworks voluntarily |
| Securities rules | The CSA paused its proposed climate disclosure rule on 23 April 2025; no rule in force as of October 2026 | The SEC adopted a climate rule in March 2024 but stopped defending it in court in March 2025; it has not taken effect |
| Other obligations | OSFI Guideline B-15 for federally regulated financial institutions | California SB 253: companies with over 1 billion dollars of revenue doing business in California report Scope 1 and 2 emissions, first reports due 10 November 2026; SB 261 climate-risk reports are on hold pending a Ninth Circuit decision |
| Effect on Northgate | Indirect, through lenders, customers and supply chains | Indirect, through large customers covered by California law and through lenders |
For a management accountant, the more useful question is how sustainability enters decisions. Three tools appear in practice. The first is measurement: Northgate's emissions come mainly from natural gas in the paint ovens and space heating (Scope 1) and from purchased electricity (Scope 2), while the largest share by far is in purchased steel (Scope 3). Emissions intensity, such as metric tons of carbon dioxide equivalent per million dollars of revenue or per metric ton of product shipped, can be tracked alongside the other KPIs from lesson 2. The second is an internal carbon price, a notional cost per metric ton applied in capital budgeting and product costing so that projects that cut emissions are credited and those that increase them are charged. The third is life-cycle thinking from lesson 8: a heavier but longer-lasting auger may have lower emissions per year of service than a lighter one that needs replacing sooner.
The United States has no federal carbon price, and Minnesota has none of its own, although some states have cap-and-trade programs. Carbon pricing therefore reaches Northgate mainly through customers and lenders, and through the cost of steel imported from countries that price carbon. The team uses a modest internal carbon price, 50 dollars a metric ton, to test whether the welding cell and the second paint booth still look attractive if energy and steel costs rise. Both do; the paint booth's NPV falls by about 4 percent because of its gas consumption.
Sustainability measures carry the same risks as any other measures, described in lesson 2: they can be gamed, they can crowd out unmeasured goals, and they can be reported selectively. Greenwashing, presenting an organization as more environmentally responsible than it is, now carries legal risk in both countries. In Canada, 2024 amendments to the Competition Act require environmental claims about products and business activities to be supported by adequate and proper testing or substantiation; in the United States, the Federal Trade Commission's Green Guides set out how environmental marketing claims are judged. The management accountant's role is to make sure that any sustainability number Northgate gives to a customer or lender is measured on a documented basis and can be supported.
Assembling the plan
With the quality program sized, the team can build the ROCE bridge, a step-by-step walk from current ROCE to the plan. Each initiative changes profit, capital or both. The team also produces a confidence-weighted version, using the probabilities from the risk workshops in lesson 11. Capital spending is treated as certain, because once committed it will happen, while profit improvements and capital releases are multiplied by their confidence.
# Capstone: bridge from Northgate's 2026 ROCE to the 15% target (invented data, millions of dollars).
profit0, capital0 = 11.80, 95.39                 # from the lesson 1 driver tree
initiatives = [
    # name,                     profit after depreciation, capital, confidence
    ('Second paint booth (lessons 4, 5)',   0.55,  +2.60, 0.90),
    ('Robotic welding cell (lesson 9)',     0.69,  +4.20, 0.85),
    ('1% price realization (lesson 7)',     1.48,   0.00, 0.60),
    ('Quality program (cost of quality)',   1.50,   0.00, 0.70),
    ('Dealer cost-to-serve terms (lesson 2)', 1.07, 0.00, 0.50),
    ('Inventory down 15 days (lesson 1)',   0.00,  -4.32, 0.75),
]
p, c = profit0, capital0
pe, ce = profit0, capital0
print(f"{'start':38s} profit {p:6.2f}  capital {c:6.2f}  ROCE {p / c:6.2%}")
for name, dp, dc, conf in initiatives:
    p += dp; c += dc
    pe += dp * conf; ce += dc * conf if dc < 0 else dc   # spend is certain; savings are not
    print(f"{name:38s} profit {p:6.2f}  capital {c:6.2f}  ROCE {p / c:6.2%}")
print(f"\nIf everything is delivered:   ROCE {p / c:.2%}")
print(f"Confidence-weighted estimate: ROCE {pe / ce:.2%}  (profit {pe:.2f}, capital {ce:.2f})")
need = 0.15 * ce - pe
print(f"Extra profit needed on the weighted plan to reach 15%: {max(need, 0):.2f}")start profit 11.80 capital 95.39 ROCE 12.37% Second paint booth (lessons 4, 5) profit 12.35 capital 97.99 ROCE 12.60% Robotic welding cell (lesson 9) profit 13.04 capital 102.19 ROCE 12.76% 1% price realization (lesson 7) profit 14.52 capital 102.19 ROCE 14.21% Quality program (cost of quality) profit 16.02 capital 102.19 ROCE 15.68% Dealer cost-to-serve terms (lesson 2) profit 17.09 capital 102.19 ROCE 16.72% Inventory down 15 days (lesson 1) profit 17.09 capital 97.87 ROCE 17.46% If everything is delivered: ROCE 17.46% Confidence-weighted estimate: ROCE 15.52% (profit 15.35, capital 98.95) Extra profit needed on the weighted plan to reach 15%: 0.00
If everything is delivered, ROCE reaches 17.5 percent, comfortably above the target. The confidence-weighted estimate is 15.5 percent, just above it. The bridge also shows the order of contribution: the paint booth and welding cell together add only about 0.4 percentage points in the first year, because they add capital, while price realization, the quality program and dealer terms add almost 4 points between them without capital. Inventory reduction adds the last 0.7 points by shrinking the denominator.
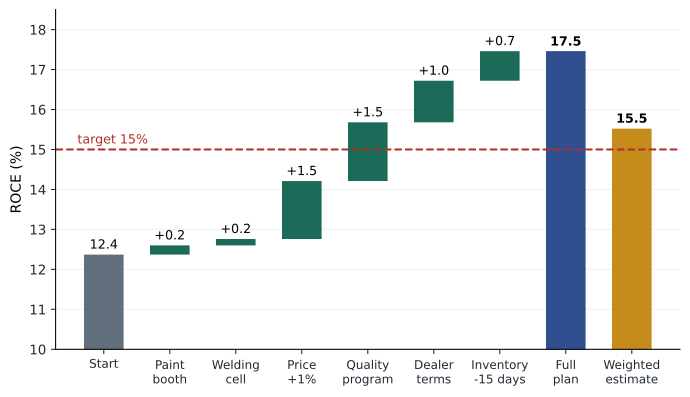
A margin of half a percentage point is thin. The team runs the plan through the simulation from lesson 11, adding the initiatives' uncertainty to the existing uncertainty in volume, steel prices and the exchange rate. The probability of reaching 15 percent ROCE by the end of 2028 comes out at roughly 55 to 60 percent, depending on the assumed correlation between price realization and volume. The probability of profit falling below the covenant level of 6 million stays at about 9 percent once the hedging changes from lesson 11 are included, inside the board's appetite. The team decides to present the target as achievable but not assured, and to identify further actions held in reserve.
Presenting to the board
A board paper that lists six initiatives and a ROCE figure invites the wrong discussion. Directors need to understand what they are being asked to decide, what the plan depends on, and what will happen if parts of it fail. Marcus Lavoie's team structures its paper around four questions: what we recommend, why it works, what could go wrong, and how we will know.
| Section | Content | Lesson |
|---|---|---|
| Recommendation | Approve the paint booth and welding cell within the 9.0 million capital budget; approve the quality program; endorse dealer terms and the inventory target | 10 |
| Why it works | ROCE bridge, NPVs, the relevant cost and pricing analysis behind each initiative | 3 to 9 |
| What could go wrong | Simulated range, probability of reaching 15%, covenant risk, key risk indicators | 6, 11 |
| Reserve actions | Defer GrainSense expansion option, outsource housings if capacity is needed, further price review | 3, 10 |
| How we will know | Scorecard of leading and lagging measures, quarterly rolling forecast, post-investment reviews | 2, 10, 11 |
Good presentation also means honesty about uncertainty. The paper reports ranges rather than single numbers for the most uncertain items, states the main assumptions in plain language, and separates facts from estimates. It explains what the 55 to 60 percent probability means and what it does not: it reflects the team's judgments about distributions, not a guarantee. And it is short, with detail in appendices, because a paper that hides the decision in fifty pages of analysis does not help directors do their job.
Measuring progress
The final design task is the set of measures that will show whether the plan is working. Lesson 2's principles apply: a small number of measures, each with an owner and a target, mixing leading and lagging indicators, reviewed at a regular rhythm. Northgate's executive team will review the following each month, with the full scorecard each quarter.
| Objective | Leading measure | Lagging measure | Owner |
|---|---|---|---|
| Relieve the paint constraint | Paint line uptime and hours used | Throughput contribution per month | Plant manager |
| Improve quality | First-pass weld yield | 90-day field failure rate; warranty cost as % of sales | Quality manager |
| Realize price | Price list compliance at quote stage | Average realized price versus list | Sales director |
| Improve dealer profitability | Share of orders meeting minimum order terms | Cost to serve per dealer; dealer profit | Sales director |
| Release capital | Inventory days by product family | Capital employed | Chief operating officer |
| Overall | Rolling forecast of ROCE | ROCE, rolling 12 months | Chief financial officer |
The team also schedules post-investment reviews for the paint booth and welding cell twelve months after start-up, as lesson 10 recommended, and agrees with the board that the rolling forecast, not the original budget, will be used to decide whether reserve actions are needed. The budget remains the target; the forecast is the early warning.
Professional judgment and ethics
Performance management puts management accountants under pressure. The board wants 15 percent; the CFO has promised it; division managers want their projects approved. In that environment it is tempting to raise a confidence estimate a little, choose the more favorable of two defensible assumptions every time, or leave the inconvenient simulation result out of the board paper. Each choice may seem small, but together they produce a plan that looks better than it is, and the cost falls on the people who rely on it.
The Institute of Management Accountants' Statement of Ethical Professional Practice sets out four principles, honesty, fairness, objectivity and responsibility, and standards of competence, confidentiality, integrity and credibility. CPAs in industry are also bound by the AICPA Code of Professional Conduct, which applies to members in business as well as in public practice, and by state board rules. A management accountant who is pressured to change a forecast without a sound basis should follow the IMA's guidance on resolving ethical issues: discuss it with the immediate supervisor or, if the supervisor is involved, the next level of management, seek confidential advice, and consult a lawyer about legal obligations if the matter is not resolved.
In Northgate's case, the pressure is real. When the first simulation showed a 15 percent chance of breaching the covenant level, a division head suggested trimming the steel price volatility assumption because it made the plan look risky. Grace Odum checked the assumption against ten years of index data and found it was reasonable, if anything slightly low. The team kept it and instead proposed the hedging changes that brought the risk within appetite. That is the pattern the course has tried to teach: when the numbers show a problem, change the plan, not the numbers.
What the course has covered
Looking back, the course has followed one company through a sequence of decisions that most management accountants will meet in some form. Lesson 1 linked strategy to measures with a value driver tree. Lesson 2 designed KPIs, targets and OKRs and found unprofitable dealers. Lessons 3 to 5 used relevant costs, the theory of constraints and linear programming to decide what to make and how to use a bottleneck. Lesson 6 valued information and flexibility under uncertainty. Lessons 7 and 8 set prices from costs, value and competition and managed costs over a product's life. Lessons 9 and 10 evaluated capital projects with tax shields, rationing and real options. Lesson 11 built risk into planning. This lesson added quality and sustainability and assembled the whole into a plan that a board can approve and managers can track.
The common thread is that management accounting information is only valuable if it changes decisions. Each tool in the course earns its place by helping someone choose better: which product, which price, which project, how much risk. The management accountant who can build the analysis, explain it plainly, show its limits honestly and then follow up to see what happened is one of the most useful people in any organization.
Common mistakes
MistakeReading the ROCE target as a hurdle every project must clear.
InsteadJudge projects by NPV and the plan by its total effect on ROCE over time.
MistakeReporting quality costs only where the cost system happens to record them.
InsteadCollect prevention, appraisal and failure costs into one report so the total is visible.
MistakeCounting the full cost of quality saving as new profit when the budget already assumed part of it.
InsteadCheck what the base budget already includes to avoid double counting.
MistakeTreating sustainability reporting as irrelevant because the company is too small to be regulated.
InsteadExpect data requests from customers, lenders and supply chains, and measure on a documented basis.
MistakePresenting a plan as certain to meet the target.
InsteadReport the probability and the main dependencies, and identify reserve actions.
MistakeAdjusting assumptions to make a plan look better under pressure.
InsteadTest assumptions against evidence; if the numbers show a problem, change the plan, not the numbers.
Summary and key terms
- Northgate's six initiatives raise ROCE to 17.5% if all are delivered and 15.5% on a confidence-weighted basis.
- Quality costs fall into prevention, appraisal, internal failure and external failure.
- Shifting spending to prevention cuts Northgate's planned cost of quality from 5.3% to 3.9% of sales.
- Only 1.50 million of the 2.08 million quality saving is counted, because part is already in the budget.
- The SEC climate rule has not taken effect, but California's SB 253 requires large companies to report emissions; Northgate feels these demands through customers and lenders.
- An internal carbon price tests whether investments remain attractive if carbon costs rise.
- A good board paper states the recommendation, why it works, what could go wrong and how progress will be measured.
- When the numbers show a problem, the ethical response is to change the plan, not the numbers.
- SB 253
- California law requiring large companies doing business in the state to report greenhouse gas emissions.
- Cost of quality
- The total of prevention, appraisal, internal failure and external failure costs.
- Prevention costs
- Costs incurred to stop defects from occurring.
- Appraisal costs
- Costs incurred to detect defects before products reach customers.
- Internal failure costs
- Costs of defects found before delivery, such as scrap and rework.
- External failure costs
- Costs of defects found by customers, such as warranty claims and lost sales.
- Emissions intensity
- Greenhouse gas emissions per unit of output or revenue.
- Internal carbon price
- A notional cost per metric ton of emissions used in internal decisions.
- ROCE bridge
- A step-by-step reconciliation from current ROCE to planned ROCE.
- Greenwashing
- Presenting an organization or product as more environmentally responsible than it is.
Practice problems
Work each problem on paper first, then reveal the answer to check.
Classify each as prevention, appraisal, internal failure or external failure: weld testing, warranty repairs, supplier audits, scrap steel.
Show answer
Appraisal, external failure, prevention, internal failure.
What was Northgate's total cost of quality as a share of sales in 2025 and in the 2027 plan?
Show answer
5.3% and 3.9%.
Why does the capstone count 1.50 million rather than 2.08 million for the quality program?
Show answer
Part of the saving was already assumed in the 2027 budget's warranty provision.
Why do the paint booth and welding cell add little to ROCE in the first year?
Show answer
They add capital as well as profit, so the ratio moves only slightly even though their NPVs are positive.
What is the confidence-weighted ROCE, and what is the margin over the target?
Show answer
About 15.5%, half a percentage point above 15%.
In the program, change the confidence on price realization from 0.60 to 0.40. Does the weighted plan still reach 15%?
Show answer
Yes, narrowly: weighted profit falls by about 0.30 million and ROCE to about 15.2%. The plan drops below 15% only if that confidence falls to about 0.25.
Name three sources of sustainability data requests for a private company like Northgate.
Show answer
Large customers, lenders and supply-chain partners subject to reporting rules.
What is an internal carbon price used for?
Show answer
To test decisions as if emissions carried a cost, crediting reductions and charging increases.
What four questions structure the team's board paper?
Show answer
What we recommend, why it works, what could go wrong, and how we will know.
A division head asks you to reduce a volatility assumption to make the plan look safer. What should you do?
Show answer
Check the assumption against evidence, keep it if it is reasonable, and address the risk through the plan; escalate under your professional code if pressure continues.
Lesson quiz · 5 questions
Score 60% or more to complete this lesson.
Create a free account to save your progress, take quizzes and earn a certificate.