
ACCT-102 · Lesson 12 of 12 · 31 min
Responsibility accounting, performance measurement and capstone: a planning and control package
As organizations grow, top managers cannot make every decision. They delegate authority to managers of departments, product lines, plants and divisions, and they need a way to hold those managers accountable. Responsibility accounting does this by measuring each manager on the revenues, costs and assets that the manager can control. This final lesson explains responsibility centers and the controllability principle, segment reporting, return on investment and residual income, an introduction to transfer pricing, and the role of non-financial measures. It ends with a capstone that brings the course together in a planning and control package for Cedar Ridge. ACCT-321 and ACCT-421 develop management control systems, transfer pricing and performance management in depth, and BUS-450 lesson 11 covers the balanced scorecard and strategic control.
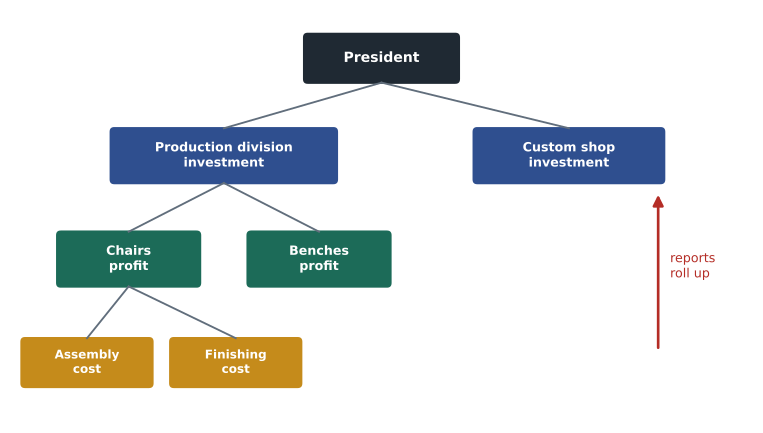
Decentralization and responsibility centers
Decentralization pushes decisions down to managers who are closer to customers and operations and can respond faster. It develops future leaders and frees senior managers to focus on strategy. Its costs are the risk that local managers pursue their own unit's interests at the expense of the whole company (goal incongruence), duplication of functions, and the cost of the information systems needed to monitor performance. Responsibility accounting is part of the answer to those risks.
| Type of center | Manager controls | Typical measures | Cedar Ridge example |
|---|---|---|---|
| Cost center | Costs | Actual versus flexible budget costs; variances (lesson 11) | Assembly and Finishing departments |
| Revenue center | Revenues | Sales versus budget; price and volume variances | Sales department |
| Profit center | Revenues and costs | Segment margin; contribution margin | Bench product line |
| Investment center | Revenues, costs and invested capital | ROI, residual income | Production division; custom shop |
The controllability principle says that managers should be evaluated only on items they can significantly influence. The Assembly supervisor controls labor hours and hardwood usage, so those belong in her performance report; she does not control the hardwood price, the plant manager's salary or the allocation of head-office costs, so including them would make her report a poor measure of her performance. In practice controllability is a matter of degree, and some companies deliberately include partly controllable items, such as a share of shared services, to encourage managers to use them wisely. What matters is that reports separate what a manager controls from what is merely allocated.
Segment reporting
A segmented income statement reports results for each segment in contribution format. Each segment's contribution margin is reduced by the fixed costs traceable to it, those that exist because of the segment and would disappear if it were eliminated, to give the segment margin. Common fixed costs, which support several segments and would remain if any one were dropped, are deducted only at the company level. Allocating common costs to segments makes them look less profitable than they are and, as lesson 9 showed, can lead to dropping segments that contribute to company profit.
# Segmented income statement for last year (illustrative)
segments = {  # sales, variable costs, traceable fixed costs
    "Chairs":      (1_256_700, 798_750, 279_000),
    "Benches":     (420_000, 273_000, 89_400),
    "Custom shop": (571_000, 341_420, 116_300),
}
common_fixed = 210_000
total_margin = 0
print(f"{'':<12}{'Sales':>11}{'CM':>10}{'CM %':>7}{'Segment margin':>16}")
for name, (s, v, f) in segments.items():
    cm, sm = s - v, s - v - f
    total_margin += sm
    print(f"{name:<12}{s:>11,}{cm:>10,}{cm / s:>7.0%}{sm:>16,}")
print(f"Total segment margins {total_margin:,}; common fixed costs {common_fixed:,}")
print(f"Company operating income {total_margin - common_fixed:,}")Sales CM CM % Segment margin Chairs 1,256,700 457,950 36% 178,950 Benches 420,000 147,000 35% 57,600 Custom shop 571,000 229,580 40% 113,280 Total segment margins 349,830; common fixed costs 210,000 Company operating income 139,830
The report shows each segment covering its own traceable costs: chairs with a segment margin of $178,950, the custom shop with $113,280 and benches with $57,600. Together they earn $349,830 toward $210,000 of common costs (the plant manager, building occupancy, head-office accounting and the president's office), leaving operating income of $139,830. Chairs earn the most in total, but the custom shop earns the highest contribution margin ratio, 40 percent, which matters when deciding where to spend marketing money: a dollar of extra custom sales adds more contribution than a dollar of chair sales, if capacity allows.
Return on investment
Investment center managers control the assets used in their units, so their performance should reflect how well they use those assets. Return on investment (ROI) is operating income divided by average operating assets. The DuPont analysis splits ROI into margin (operating income ÷ sales) and turnover (sales ÷ average operating assets), showing that ROI can be improved by raising the margin, by using assets more intensively, or both.
# ROI and residual income for Cedar Ridge's two divisions (illustrative)
divisions = {  # segment margin, sales, average operating assets
    "Production division (chairs and benches)": (236_550, 1_676_700, 1_200_000),
    "Custom shop": (113_280, 571_000, 400_000),
}
required = 0.12          # minimum required rate of return
for name, (income, sales, assets) in divisions.items():
    margin, turnover = income / sales, sales / assets
    roi = margin * turnover
    ri = income - required * assets
    print(f"{name}: margin {margin:.1%} x turnover {turnover:.2f} = ROI {roi:.1%}; "
f"residual income ${ri:,.0f}")Production division (chairs and benches): margin 14.1% x turnover 1.40 = ROI 19.7%; residual income $92,550 Custom shop: margin 19.8% x turnover 1.43 = ROI 28.3%; residual income $65,280
The production division earns an ROI of about 19.7 percent from a margin of about 14 percent and turnover of 1.40; the custom shop earns about 28.3 percent from a higher margin of about 20 percent and similar turnover of 1.43. The difference lies almost entirely in margin, so the production division's best route to a higher ROI is cost control and pricing rather than squeezing more sales out of its assets. Measuring ROI requires choices: whether operating assets are measured at net book value or gross cost (net book value makes old divisions look better as assets depreciate), whether to include common assets, and whether to use segment margin or a fuller measure of income. Companies should apply the choices consistently.
Residual income and the problem with ROI
ROI has a well-known weakness. A manager evaluated on ROI may reject an investment that would benefit the company because it would lower the unit's ROI. Suppose the custom shop manager can buy a CNC upgrade for $100,000 that will add $20,000 a year to segment margin, a 20 percent return, comfortably above the company's 12 percent required return. But the custom shop already earns 28.3 percent, so the investment would pull its ROI down. Residual income (RI) avoids the problem by measuring the dollar income earned above the minimum required return on the assets used: RI = operating income − (required rate × average operating assets). Any investment that earns more than the required rate raises RI.
Worked problem
ROI versus residual income
Evaluate the custom shop's $100,000 CNC upgrade, which adds $20,000 of annual segment margin, using ROI and residual income. The required return is 12 percent.
Show solution
- Current ROI = $113,280 ÷ $400,000 ≈ 28.3 percent.
- ROI with the upgrade = $133,280 ÷ $500,000 ≈ 26.7 percent, lower than now.
- Current RI = $113,280 − 12% × $400,000 = $65,280.
- RI with the upgrade = $133,280 − 12% × $500,000 = $73,280, higher by $8,000.
- The company gains, because the project returns 20 percent against a 12 percent cost of capital.
Answer: Under ROI the manager would be tempted to reject a good project; under RI she would accept it. Many companies track both.
Economic value added (EVA), a trademarked variant of residual income, adjusts operating income and assets for accounting conventions, such as capitalizing research spending, and uses the weighted average cost of capital from FIN-201 lesson 11 as the required rate. All three measures share a short-term bias: a manager can raise this year's ROI or RI by cutting maintenance, training or research. Multi-year evaluation and non-financial measures help counter that bias.
Transfer pricing: an introduction
When one segment sells to another, the price charged is a transfer price. It is revenue to the selling unit and cost to the buying unit, so it affects both managers' reported performance, although it does not change company profit directly. A good transfer price encourages managers to make the decisions that are best for the company as a whole. Cedar Ridge's custom shop wants 300 unfinished chair frames from the chair line for a restaurant order. The chair line's variable cost to the unfinished stage is $88; it sells unfinished chairs to a DIY retailer for $150 (lesson 9). An outside supplier would sell comparable frames to the custom shop for $145.
# Transfer price range for 300 unfinished frames (illustrative)
variable_cost, outside_sale, outside_buy, qty = 88, 150, 145, 300
for idle_capacity in (True, False):
    opportunity = 0 if idle_capacity else outside_sale - variable_cost
    minimum = variable_cost + opportunity          # seller's floor
    maximum = outside_buy                          # buyer's ceiling
    feasible = minimum <= maximum
    gain = (maximum - minimum) * qty if feasible else 0
    print(f"Idle capacity: {idle_capacity}.  Minimum ${minimum}, maximum ${maximum}.  "
          + (f"Transfer: company gains ${gain:,} versus buying outside." if feasible
else "Do not transfer: the company is better off buying outside."))Idle capacity: True. Minimum $88, maximum $145. Transfer: company gains $17,100 versus buying outside. Idle capacity: False. Minimum $150, maximum $145. Do not transfer: the company is better off buying outside.
The general rule is that the minimum acceptable transfer price for the selling unit is its variable cost plus the contribution margin it gives up on outside sales (its opportunity cost), and the maximum the buying unit will pay is its cost of buying outside. If the chair line has idle capacity, any price between $88 and $145 makes both managers better off, and the company saves $57 per frame, $17,100 in total, compared with buying outside. If the chair line is at capacity, every frame transferred displaces an unfinished chair it could sell for $150, so its minimum becomes $150, above the custom shop's $145 ceiling, and the company is better off buying outside. Market-based, cost-based and negotiated transfer prices, and the tax rules that govern transfers between countries (transfer pricing under the arm's-length principle, which tax authorities in both Canada and the United States enforce), are covered in ACCT-321.
Beyond financial measures
Financial measures report the results of past decisions; they say little about whether the business is building the capabilities that will drive future results. Most companies therefore add non-financial measures: quality (defect rates, returns, warranty claims), delivery (on-time shipments, lead time), customer (satisfaction, retention, complaints), employee (safety incidents, turnover, training hours), efficiency (labor hours per chair, set-up time) and sustainability (energy per unit, waste wood per chair). The balanced scorecard organizes such measures into four linked perspectives, financial, customer, internal process, and learning and growth, so that each measure connects to strategy. BUS-450 lesson 11 develops the balanced scorecard; the table below shows a simple version for the chair line.
| Perspective | Objective | Measure | Target |
|---|---|---|---|
| Financial | Profitable growth | Chair line segment margin; ROI | $190,000; 20% |
| Customer | Reliable supplier to retailers | On-time delivery; retailer return rate | 97%; under 1.5% |
| Internal process | Efficient, low-waste production | Board feet per chair; first-pass yield | 5.1; 98% |
| Learning and growth | Skilled, safe workforce | Training hours per employee; lost-time injuries | 24 hours; zero |
Non-financial measures need the same care as financial ones. Measures that are easy to game (calls answered quickly rather than problems solved) or that conflict with each other (output per hour versus quality) can distort behavior. The ethical standards from lesson 1 apply to performance reporting too: reporting only the measures that flatter a unit, or adjusting how a measure is calculated to hit a bonus target, undermines the whole system.
Capstone: a planning and control package for Cedar Ridge
The controller has been asked to present a planning and control package to the board for next year. It draws on every part of the course. The package has five parts: cost structure and CVP for the chair and bench lines; the operating and cash budget highlights; a review of last year's variances with recommended actions; segment and investment center performance; and a short list of decisions for the board. The program below assembles the key figures from earlier lessons so that the board sees one consistent set of numbers.
# Cedar Ridge planning and control package: key figures (illustrative)
chair = {"p": 180, "v": 108}
bench = {"p": 300, "v": 195}
fixed_next_year = 449_400                        # chairs + benches (lesson 4)
plan = {"chairs": 7_000, "benches": 1_400}

cm = plan["chairs"] * (chair["p"] - chair["v"]) + plan["benches"] * (bench["p"] - bench["v"])
income = cm - fixed_next_year
composite_cm = 3 * (chair["p"] - chair["v"]) + (bench["p"] - bench["v"])
breakeven = fixed_next_year / composite_cm
sales = plan["chairs"] * chair["p"] + plan["benches"] * bench["p"]

print("1. CVP: chair and bench lines next year")
print(f"   Contribution margin ${cm:,}; operating income ${income:,}")
print(f"   Break-even at a 3:1 mix: {3 * breakeven:,.0f} chairs and {breakeven:,.0f} benches")
print(f"   Margin of safety {1 - (breakeven * 840) / sales:.1%} of planned sales; DOL {cm / income:.2f}")
print("2. Budget: Q2 borrowing $35,000, repaid in Q3; year-end cash about $85,000")
variances = {"materials price": 14_560, "materials quantity": 16_800,
             "DL rate": 5_100, "DL efficiency": -6_000,
             "variable overhead spending": 2_040, "variable overhead efficiency": -2_400,
             "fixed overhead budget": 3_000}
print("3. Last year's production variances (positive = unfavourable)")
for k, v in variances.items():
    print(f"   {k:<29}{v:>+9,}")
print(f"   Net production cost variance {sum(variances.values()):+,} (excludes $6,000 U volume variance)")
print("4. Divisions: production ROI 19.7%, custom shop ROI 28.3%")1. CVP: chair and bench lines next year Contribution margin $651,000; operating income $201,600 Break-even at a 3:1 mix: 4,200 chairs and 1,400 benches Margin of safety 30.0% of planned sales; DOL 3.23 2. Budget: Q2 borrowing $35,000, repaid in Q3; year-end cash about $85,000 3. Last year's production variances (positive = unfavorable) materials price +14,560 materials quantity +16,800 DL rate +5,100 DL efficiency -6,000 variable overhead spending +2,040 variable overhead efficiency -2,400 fixed overhead budget +3,000 Net production cost variance +33,100 (excludes $6,000 U volume variance) 4. Divisions: production ROI 19.7%, custom shop ROI 28.3%
From these figures the controller drafts the board memo. With the bench line, next year's plan earns operating income of $201,600 on contribution margin of $651,000 against fixed costs of $449,400; the margin of safety is about 30 percent of planned sales and the degree of operating leverage about 3.2. Last year's largest variances were in hardwood, $31,360 unfavorable in total, so purchasing and production should jointly review grade, supplier and cutting yields; the labor variances largely offset and suggest the new assembly jig is working. The cash budget requires a $35,000 seasonal draw on the line of credit, driven by the equipment purchase.
| Decision for the board | Recommendation | Lesson |
|---|---|---|
| Accept the hotel chain's special order at $130? | Accept while capacity is idle (+$12,000); reject if the plant is full | 9 |
| Buy seat cushions from the outside supplier? | Buy if the upholstery space can be rented (+$8,800 a year); confirm quality first | 9 |
| Keep the bench line despite its reported loss? | Keep: segment margin $57,600; review batch sizes to cut set-up costs | 7, 9 |
| Approve the custom shop CNC upgrade? | Approve: 20% return exceeds 12% required; evaluate the manager on residual income | 12 |
| Change bonus measures? | Use contribution margin and residual income with inventory and quality targets to avoid overproduction | 8, 11, 12 |
| Re-price custom work? | Use activity-based rates that charge for design time; set a minimum order value | 5, 7 |
Worked problem
Testing the plan
The board asks what happens to next year's operating income if hardwood prices rise by 10 percent, adding $6 to each chair's variable cost and $10.80 to each bench's (9 board feet), with no change in prices or volumes.
Show solution
- Extra variable cost: chairs 7,000 × $6 = $42,000; benches 1,400 × $10.80 = $15,120.
- Total reduction in contribution margin = $57,120.
- Operating income falls from $201,600 to $144,480, a drop of about 28 percent.
- Responses: negotiate a fixed-price lumber contract, raise prices modestly, or improve cutting yields toward the 5-board-foot standard (last year averaged 5.2).
Answer: A 10 percent rise in hardwood prices would cut planned income by about $57,000, so the board should consider hedging the price through supplier contracts.
The capstone shows the managerial accountant's role described in lesson 1: not just reporting numbers, but connecting cost behavior, budgets, variances and decisions into advice that helps managers act. The same tools apply to a hospital ward, a software firm or a municipality; only the cost objects and drivers change. From here, ACCT-222 deepens cost accounting, ACCT-321 and ACCT-421 develop control and performance management, ACCT-341 adds data analytics, and FIN-201 and BUS-450 connect these tools to finance and strategy.
Common mistakes
MistakeHolding managers accountable for costs they cannot control.
InsteadApply the controllability principle; separate controllable from allocated items.
MistakeAllocating common fixed costs when judging segment profitability.
InsteadUse segment margin; deduct common costs only at the company level.
MistakeRelying only on ROI to evaluate investment center managers.
InsteadROI can discourage good investments; use residual income alongside it.
MistakeSetting transfer prices that ignore opportunity costs.
InsteadMinimum price = variable cost + contribution lost on outside sales.
MistakeUsing only financial measures.
InsteadAdd non-financial measures of quality, delivery, customers, people and sustainability, linked to strategy.
Summary and key terms
- Responsibility accounting evaluates managers on what they control: costs, revenues, profits or investment.
- The controllability principle separates controllable items from allocations.
- Segmented income statements show contribution margin and segment margin before common fixed costs.
- ROI = margin × turnover; residual income = operating income − required return × assets.
- Residual income encourages investments that earn more than the required return, which ROI can discourage.
- Transfer prices should lie between the seller's variable cost plus opportunity cost and the buyer's outside price.
- Balanced scorecards add non-financial measures; the capstone links CVP, budgets, variances and decisions into one package.
- Responsibility accounting
- A system that measures the performance of each responsibility center against plans.
- Responsibility center
- A segment whose manager is accountable for specified activities.
- Cost center
- A responsibility center whose manager controls costs only.
- Profit center
- A responsibility center whose manager controls revenues and costs.
- Investment center
- A responsibility center whose manager controls revenues, costs and invested capital.
- Controllability principle
- Managers should be evaluated only on items they can significantly influence.
- Return on investment
- Operating income divided by average operating assets.
- Residual income
- Operating income minus the minimum required return on operating assets.
- Transfer price
- The price charged when one segment provides goods or services to another.
- Balanced scorecard
- A performance system linking financial and non-financial measures to strategy across four perspectives.
Practice problems
Work each problem on paper first, then reveal the answer to check.
A division has operating income of $90,000, sales of $600,000 and average assets of $450,000. Compute margin, turnover and ROI.
Show answer
Margin 15%; turnover 1.33; ROI 20%.
With a 14 percent required return, what is its residual income?
Show answer
$90,000 − $63,000 = $27,000.
A project costs $50,000 and earns $8,000 a year. Will the division (ROI 20%) want it under ROI? Under RI?
Show answer
Project ROI 16% lowers division ROI, so ROI says no; RI rises by $8,000 − $7,000 = $1,000, so RI says yes.
Classify the bench product line as a type of responsibility center.
Show answer
Profit center.
Why should common fixed costs not be allocated when deciding whether to drop a segment?
Show answer
They would remain if the segment were dropped.
A selling division with idle capacity has variable cost $40; the buying division can buy outside for $55. What is the transfer price range?
Show answer
$40 to $55.
If the seller were at capacity and sold outside at $60, should it transfer?
Show answer
No: its minimum ($40 + $20 = $60) exceeds the buyer's $55 ceiling.
Give one non-financial measure for each balanced scorecard perspective at a furniture plant.
Show answer
Financial: segment margin; customer: on-time delivery; process: first-pass yield; learning: training hours.
Why might net book value make an old division's ROI look better than a new division's?
Show answer
Depreciation lowers the asset base over time, raising ROI without any real improvement.
Change the capstone program so benches sell 1,800 units. What is operating income?
Show answer
CM = 504,000 + 189,000 = $693,000; income = $243,600.
Lesson quiz · 5 questions
Score 60% or more to complete this lesson.
Create a free account to save your progress, take quizzes and earn a certificate.