
SLS-254 · Lesson 2 of 12 · 24 min
How online shoppers decide
▶ Video coming soon A video version of this lesson is on the way.
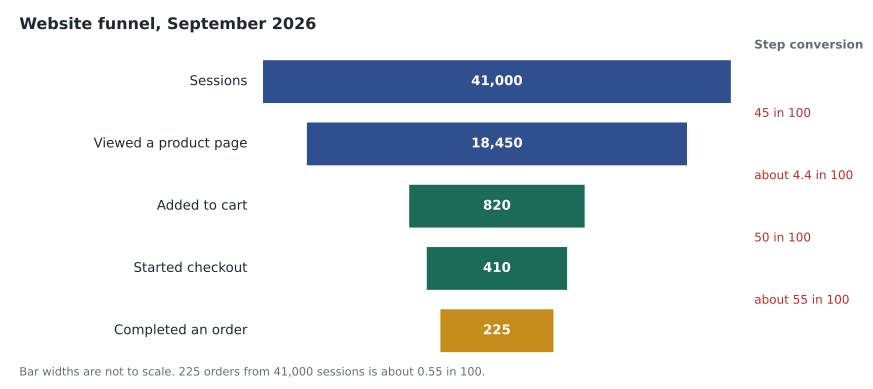
On Wednesday, October 7, 2026, Tessa started the session by turning her screen toward Aiden. It showed a single chart: a wide bar at the top that narrowed sharply, step by step, to a thin sliver at the bottom. "This is everyone who came to our website in September," she said, "and this is the 0.55 in 100 who bought something. Today we figure out where the rest went, and why." Aiden had seen plenty of shoppers leave the store without buying, and in SLS-250 he had learned to read their signals on the floor. Online, there were no faces to read. There were only clicks, scrolls and exits, and the job was to read those instead.
This lesson looks at how people decide to buy online: the stages they pass through, what makes them stop, the information they look for, and the ways a website can help or get in the way. It builds on the consumer decision process from SLS-110, applying it to a screen rather than a sales floor.
The online decision journey
The decision process taught in SLS-110 still applies online: a shopper recognizes a need, searches for information, evaluates options, decides and later judges whether the purchase was a good one. What changes online is the speed and the number of options. A shopper can compare ten sofas from six retailers in fifteen minutes without leaving the couch she wants to replace. She can also stop at any moment, with no salesperson to notice, and come back days later or never.
Online journeys are rarely a straight line. Researchers at Google described the "messy middle" of online buying in a 2020 report, arguing that shoppers loop between exploring, which widens their options, and evaluating, which narrows them, many times before deciding. The model is a description from one company's research rather than a tested law, but it matches what retailers see in their data: the same customer visiting several times, from several devices, before buying.
The conversion funnel
Retailers summarize online decisions with a conversion funnel, a count of how many visitors reach each step on the way to an order. The exact steps vary, but a typical funnel runs from visiting the site, to viewing a product page, to adding a product to the cart, to starting checkout, to completing the order. The share of visitors who complete an order is the conversion rate. The share at each step who go on to the next is the step conversion.
A session is one visit to the website, usually ending after about thirty minutes without activity. One person can create several sessions, and analytics tools cannot always tell when the same person visits from a phone and later from a laptop. For this reason retailers usually talk about sessions rather than people, and treat the numbers as estimates.
| Step | Sessions reaching the step | Step conversion | Share of all sessions |
|---|---|---|---|
| Visited the site | 41,000 | 100 in 100 | |
| Viewed a product page | 18,450 | 45 in 100 of visits | 45 in 100 |
| Added a product to the cart | 820 | about 4.4 in 100 of product viewers | 2.0 in 100 |
| Started checkout | 410 | 50 in 100 of carts | 1.0 in 100 |
| Completed an order | 225 | about 55 in 100 of checkouts | about 0.55 in 100 |
Worked problem
Reading the funnel
Using the September funnel, what was the overall conversion rate, and what was the cart abandonment rate, the share of carts that did not become orders?
Show solution
- Overall conversion rate:
- \[225 \div 41{,}000 \approx 0.00549\]
- That is about 0.55 in 100 sessions.
- Cart abandonment rate:
- \[1 - (225 \div 820) \approx 1 - 0.274 = 0.726\]
Answer: About 0.55 in 100 sessions ended in an order, and about 73 in 100 carts were abandoned. The abandonment rate is close to the average of about 70 in 100 that the Baymard Institute reports from dozens of studies of online stores.
Is 0.55 in 100 good?
Aiden's first reaction was that the website was failing badly. In the store, about one shopping group in four or five buys something on a busy Saturday. Online conversion rates are always much lower, because a visit costs a shopper almost nothing. Many sessions are quick checks of opening hours, a delivery date or a product detail before a store visit. Published benchmarks for online furniture and home stores often fall around 0.5 to 1.5 in 100, lower than for groceries or fashion and lower again for expensive items, but benchmarks vary widely between sources and are best treated as rough guides. The useful comparison is the store's own funnel from month to month, and the steps where it loses the most people.
For Juniper & Pine, the step with the biggest drop was between viewing a product page and adding to the cart: only about 4 or 5 product viewers in 100 added anything. That is not surprising for furniture. Many people view a sofa online to decide whether to visit the store, not to buy it from the screen. Tessa's view was that the product page had two jobs: to sell the products people are ready to buy online, such as cushions and lamps, and to send everyone else to the store well informed. Both jobs can be measured, and lesson 11 shows how.
Why shoppers abandon carts
Cart abandonment is the most studied moment in online retail. The Baymard Institute, a research firm that studies checkout usability, has surveyed thousands of online shoppers in the United States about why they abandoned an order. Many say they were "just browsing" or using the cart to save items or compare prices, and those abandonments are normal. Among shoppers who meant to buy, the reasons Baymard reports most often are:
| Reason | What it looks like at Juniper & Pine |
|---|---|
| Extra costs too high (shipping, taxes, fees) | Delivery charges appear only on the last checkout page |
| The site wanted me to create an account | Guest checkout exists but is easy to miss |
| Delivery was too slow | Delivery dates for furniture appear only after an address is entered |
| I did not trust the site with my card details | Few visible security and payment cues on the checkout pages |
| Checkout was too long or complicated | Five checkout pages, including an optional survey |
| I could not see the total cost up front | Shipping and taxes are estimated only at the end |
| The return policy was not satisfactory | The 30-day return policy is linked only in the footer |
Each reason suggests a fix, and Tessa worked through them with Aiden. Showing delivery costs and dates on the product page, before the cart, would remove the biggest surprise. Making guest checkout the obvious choice would remove a barrier for first-time buyers. Showing the return policy and the 90-night comfort exchange for mattresses near the "add to cart" button would answer the question shoppers ask in the store before they will commit. None of these changes requires new technology; all of them require someone to look at the website through a shopper's eyes.
Showing the full price early also matters legally. Under the Competition Act, a price shown to consumers must include all fixed, mandatory charges other than government taxes; adding an unavoidable fee late in the checkout is drip pricing, which the Act has prohibited since 2022. Optional charges, such as delivery a customer can choose instead of pick-up, can be added later, but they must be clear before the customer pays.
Worked problem
What would fixing the checkout be worth?
In September, 410 sessions started checkout and 225 completed an order, with an average order value of 640 dollars. Tessa estimates that showing delivery costs on the product page and simplifying guest checkout could lift checkout completion from about 55 in 100 to 62 in 100. With the same number of checkouts, how many more orders and how much more revenue would that mean per month?
Show solution
- Orders at the higher completion rate:
- \[410 \times 0.62 = 254.2 \approx 254\]
- Extra orders per month:
- \[254 - 225 = 29\]
- Extra revenue per month:
- \[29 \times 640 = 18{,}560\]
Answer: About 29 more orders, worth about 18,560 dollars a month. The estimate assumes the new completion rate is reachable and that the extra orders have the same average value. It should be tested, as lesson 3 explains, rather than taken as a promise.
What online shoppers look for
Without a salesperson, a product page has to answer every question a good associate would answer. For furniture and appliances, shoppers look for five things above all: the total price including delivery; whether the product will fit their space and their life, which means dimensions, materials and care; evidence from other buyers in reviews and photos; how and when they can get it; and what happens if it goes wrong, which means returns, warranties and service. Lesson 3 looks at each of these on a product page.
Shoppers also judge risk. Buying a 1,500-dollar sofa from a screen feels riskier than buying a 30-dollar cushion, so the information needed rises with the price. Research on online reviews from Northwestern University's Spiegel Research Center found that reviews increased purchase likelihood more for higher-priced products than for lower-priced ones, which fits this idea. For expensive items, the website's job is often to reduce enough risk that the shopper books a visit, starts a chat or asks for a fabric sample, rather than to complete the sale on screen.
Mobile shoppers
Most visits to Juniper & Pine's website in 2026 came from phones: 71 in 100 sessions in September, against 24 in 100 from computers and 5 in 100 from tablets. Phone visitors converted at about half the rate of computer visitors, a pattern most retailers see. Shoppers often browse on phones during spare moments and buy later on a larger screen, or in the store. A small screen makes long forms, tiny buttons and slow-loading photos more painful, so problems that are minor on a computer become reasons to leave on a phone.
Worked problem
Conversion by device
In September, 29,110 sessions came from phones and produced 120 orders. Computers had 9,840 sessions and 93 orders. Tablets had the rest. Compare the conversion rates for phones and computers.
Show solution
- Phone conversion rate:
- \[120 \div 29{,}110 \approx 0.0041\]
- Computer conversion rate:
- \[93 \div 9{,}840 \approx 0.0095\]
Answer: Phones converted at about 0.41 in 100 and computers at about 0.95 in 100, a little more than twice as high. Phones still produced more orders in total because they brought far more sessions, so the phone checkout deserves close attention.
Privacy and tracking
Funnels depend on tracking what visitors do on the website. Tools record pages viewed, clicks and purchases, often using cookies or similar technologies. Retailers need to use this data within the law and their own promises.
In Canada, PIPEDA requires meaningful consent for collecting personal information, and the Office of the Privacy Commissioner has said that tracking people across websites for advertising generally needs opt-out consent at a minimum, and express consent where the information is sensitive. Juniper & Pine's cookie banner lets visitors refuse advertising cookies while keeping the basic analytics the site needs to work.
Tracking has limits even when it is legal. Many visitors block cookies or use browsers that restrict tracking, so funnel counts are undercounts. Tessa treats the funnel as a reliable way to compare one month with the next on the same website, not as an exact census.
Search on the website
Shoppers who use a website's own search box usually know what they want, and retailers commonly find that they convert better than shoppers who only browse. That makes search results a selling surface. Tessa checked the store's search log for September and found that the most common searches were simple words such as "sectional", "dresser", "lamp" and "fridge", but that some returned nothing useful. A search for "couch" found no products, because every listing said "sofa"; a search for "washer" showed dryers first. She added common synonyms, so that "couch" and "chesterfield" both found sofas, and set the search to show in-stock items before special orders. A search that ends in "no results" is a shopper telling the store exactly what they wanted and being turned away.
Common mistakes
MistakeOnline conversion should be close to store conversion.
InsteadOnline visits cost shoppers almost nothing, so many are research. Compare the website with its own past, not with the store.
MistakeEvery abandoned cart is a lost sale.
InsteadMany shoppers use carts to save or compare items. Focus on the abandonments caused by fixable problems such as hidden costs.
MistakeShow the delivery charge at the end so the price looks lower.
InsteadSurprise costs are the most common reason for abandonment, and hiding mandatory fees can break the law.
MistakePhone visitors who do not buy are a waste of traffic.
InsteadMany phone shoppers buy later on a computer or in the store. The phone visit was part of the journey.
MistakeThe funnel counts every visitor exactly.
InsteadCookie blocking and multiple devices mean the counts are estimates; use them for comparison over time.
Summary and key terms
- Online shoppers follow the same decision process as store shoppers, but faster, with more options and more loops between exploring and evaluating.
- The conversion funnel counts sessions at each step from visit to order; the biggest drops show where to improve.
- Online conversion rates are far lower than store conversion rates because many visits are research.
- Most purposeful cart abandonment comes from surprise costs, forced accounts, slow or unclear delivery, trust concerns and complicated checkouts.
- Expensive products need more information to reduce risk, and the website's job may be to send the shopper to the store well informed.
- Tracking must respect privacy law and the store's own promises, and the resulting counts are estimates.
- Session
- One visit to a website, usually ending after about thirty minutes of inactivity.
- Conversion funnel
- A count of how many sessions reach each step on the way to an order.
- Conversion rate
- The share of sessions that end in an order.
- Step conversion
- The share of sessions at one funnel step that go on to the next.
- Cart abandonment rate
- The share of carts that do not become orders.
- Average order value
- Total online revenue divided by the number of orders.
Practice problems
Work each problem on paper first, then reveal the answer to check.
A site has 20,000 sessions and 130 orders. What is its conversion rate?
Show answer
130 divided by 20,000 is 0.0065, or 0.65 in 100.
Of 600 carts, 168 become orders. What is the cart abandonment rate?
Show answer
168 divided by 600 is 0.28, so 1 minus 0.28 is 0.72, or 72 in 100.
Name two fixes for cart abandonment that do not need new technology.
Show answer
Show delivery costs and dates on the product page, and make guest checkout the obvious choice.
Why might a furniture product page succeed even if the visitor does not buy online?
Show answer
It may have done its job by sending a well-informed shopper to the store to see and buy the product.
Lesson quiz · 5 questions
Score 60% or more to complete this lesson.
Create a free account to save your progress, take quizzes and earn a certificate.