
PRIN-131 · Lesson 4 of 12 · 26 min
The risk practice II: assessing, planning and implementing responses
Lesson 3 identified risks and recorded them as cause, event and effect. Identification on its own changes nothing. This lesson covers the rest of the risk management procedure: assessing each risk and the overall risk position, planning responses, implementing them through owners and actionees, and communicating throughout. It also covers the risk budget, which funds responses, and shows how expected values help a board decide whether the project's overall risk exposure is acceptable.
Assess: estimate and evaluate
Assessment has two parts. Estimating looks at each risk individually: how probable is it, how large would the impact be, and when might it occur. Evaluating looks at the combined effect of all the risks on the project's objectives: is the overall risk exposure within the board's risk tolerance, and is the project still worth doing given its risks? A project can have no single alarming risk and still be unacceptably risky because many moderate risks add up.
| Score | Probability | Cost impact | Time impact | Benefit impact |
|---|---|---|---|---|
| 1 Very low | Under 5 % | Under 10 thousand | Under 1 week | Under 1 % of annual benefit |
| 2 Low | 5–20 % | 10–50 thousand | 1–2 weeks | 1–5 % |
| 3 Medium | 20–50 % | 50–150 thousand | 2–4 weeks | 5–10 % |
| 4 High | 50–80 % | 150–400 thousand | 4–8 weeks | 10–20 % |
| 5 Very high | Over 80 % | Over 400 thousand | Over 8 weeks | Over 20 % |
Scales like these must be defined in the risk management approach before scoring begins. Without definitions, one person's high is another's medium, and the register becomes a record of temperament rather than risk. The impact scales are expressed in terms of the performance targets the board cares about. Where an impact affects more than one target, assessors usually score the most serious.
Proximity records when a risk might occur, which helps the project manager focus on what is coming soon. A risk about supplier delivery is most proximate in the weeks before installation starts; a risk about customer alert response becomes proximate when alerts are switched on. Proximity also matters for responses: there is no point planning a response that cannot be in place before the risk could occur.
The probability-impact grid
A probability-impact grid plots risks by their scores and shades the cells to show how serious each combination is. It is one of the most widely used risk techniques because it is quick and visual. It has limitations: the scores are ordinal, so multiplying them is a convenience rather than true arithmetic, and the grid treats a very probable small risk the same as an improbable large one if their products are equal. It is best used to prioritize attention, with expected values used where money decisions are involved.
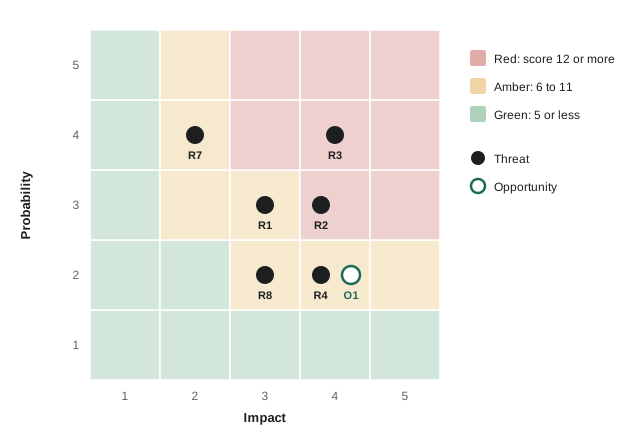
The code below scores the pilot-stage threats, sorts them by probability times impact and counts how many fall into each zone of the grid. The zone boundaries, 1 to 5 green, 6 to 11 amber and 12 or more red, are the utility's own convention and are written into its risk management approach.
risks = {  # id: (description, probability score, impact score)
    "R1": ("Pilot meters delivered late", 3, 3),
    "R2": ("Customers ignore leak alerts", 3, 4),
    "R3": ("Billing interface overruns", 4, 4),
    "R4": ("Radio coverage below 98 %", 2, 4),
    "R7": ("Meters in flooded pits cannot be fitted", 4, 2),
    "R8": ("Privacy complaint about detailed data", 2, 3),
}
def zone(score):
    return "red" if score >= 12 else "amber" if score >= 6 else "green"
ranked = sorted(risks.items(), key=lambda kv: -kv[1][1] * kv[1][2])
counts = {"red": 0, "amber": 0, "green": 0}
for rid, (desc, p, i) in ranked:
    z = zone(p * i); counts[z] += 1
    print(f"{rid} {desc:40} P{p} I{i} score {p*i:2} {z}")
print(counts)R3 Billing interface overruns P4 I4 score 16 red
R2 Customers ignore leak alerts P3 I4 score 12 red
R1 Pilot meters delivered late P3 I3 score 9 amber
R4 Radio coverage below 98 % P2 I4 score 8 amber
R7 Meters in flooded pits cannot be fitted P4 I2 score 8 amber
R8 Privacy complaint about detailed data P2 I3 score 6 amber
{'red': 2, 'amber': 4, 'green': 0}The billing interface risk ranks first with a score of 16, and the alert response risk scores 12, just inside the red zone. Four risks are amber and none is green. The ranking agrees with the schedule analysis in PRIN-130, which found the billing interface on the critical path; risk and plans are telling the same story, which is a good sign that both have been done properly. The two red risks are also the two that most threaten the decision the pilot exists to inform: whether billing works and whether customers act on alerts.
Expected value
Where impacts can be expressed in money, expected value gives a more useful measure than a score. The expected value of a threat is its probability multiplied by its cost impact. For an opportunity it is the probability multiplied by the saving or gain. Adding expected values across all risks gives a rough measure of overall exposure, which the board can compare with its risk tolerance and with the risk budget. Expected value is an average: if the risk occurs, the actual cost is the full impact, not the expected value, so a board should also look at the largest single impacts.
threats = {  # id: (probability, cost impact in thousands)
    "R1 meters late": (0.35, 90),
    "R2 alerts ignored": (0.30, 240),
    "R3 interface overrun": (0.60, 160),
    "R4 coverage shortfall": (0.15, 220),
    "R7 flooded pits": (0.60, 45),
    "R8 privacy complaint": (0.15, 60),
}
opps = {"O1 meter subsidy": (0.20, 300)}
total = 0
for name, (p, c) in threats.items():
    ev = p * c; total += ev
    flag = "  <- above 100k stage risk tolerance" if ev > 100 else ""
    print(f"{name:22} EV {ev:6.1f}{flag}")
print(f"total threat EV {total:.1f} thousand")
for name, (p, g) in opps.items():
    print(f"{name:22} EV {p*g:6.1f} (opportunity)")
budget = 120
print(f"risk budget {budget}: covers {budget/total:.0%} of total threat expected value")R1 meters late EV 31.5 R2 alerts ignored EV 72.0 R3 interface overrun EV 96.0 R4 coverage shortfall EV 33.0 R7 flooded pits EV 27.0 R8 privacy complaint EV 9.0 total threat EV 268.5 thousand O1 meter subsidy EV 60.0 (opportunity) risk budget 120: covers 45% of total threat expected value
The total expected value of threats in the pilot stage is about 269 thousand. No single threat exceeds the board's 100 thousand stage risk tolerance, but the billing interface, at 96 thousand, is close enough that any worsening would have to be referred to the board, and the risk management approach should name it as one to watch. The subsidy opportunity has an expected value of 60 thousand, a reminder that the register is not only a list of bad news. The 120 thousand risk budget covers about 45 % of the total threat expected value. That is not necessarily wrong, because the risk budget funds responses rather than absorbing every impact, and some responses are cheap compared with the risks they reduce. But it tells the board that the plan relies heavily on responses working.
Plan: choosing responses
Planning means choosing, for each risk, a response that is proportionate to the risk and cost-effective. PRINCE2 7 describes a set of response types that differ for threats and opportunities. Older editions used the term fallback for a plan that is prepared in advance and used only if the risk occurs; the seventh edition describes this as preparing contingent plans. Check the official manual for the exact names and definitions used in the exam.
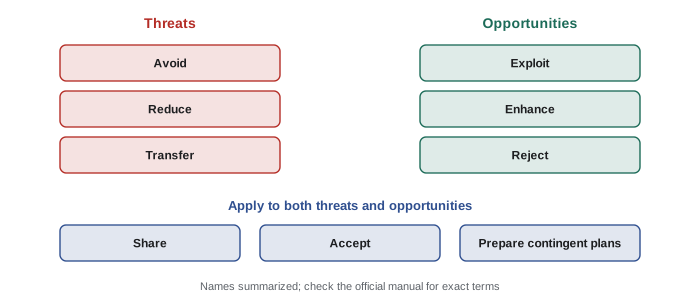
| Response | Applies to | What it does | Ridgeline Water example |
|---|---|---|---|
| Avoid | Threat | Change something so the threat can no longer occur or can no longer affect the project | Choose a pilot district without known radio blackspots |
| Reduce | Threat | Act now to reduce probability or impact | Build an early prototype of the billing interface to expose problems sooner |
| Transfer | Threat | Pass part of the financial impact to a third party | Contract clause making the supplier pay for late delivery |
| Share | Threat or opportunity | Share gains and losses with another party, often through a pain/gain arrangement | Target-cost contract with the installer sharing overruns and savings |
| Accept | Threat or opportunity | Take a conscious decision to take no action other than monitoring | Accept a small risk of installation complaints |
| Prepare contingent plans | Threat or opportunity | Prepare actions now that will be carried out only if the risk occurs | Agree in advance that a second installer is called in if fewer than 80 % of pit meters can be fitted |
| Exploit | Opportunity | Act to make sure the opportunity happens | Design the rollout to meet the subsidy's eligibility rules from the start |
| Enhance | Opportunity | Increase the probability or size of the opportunity | Prepare the subsidy application early to be among the first approved |
| Reject | Opportunity | Decide consciously not to pursue the opportunity | Decline an offer of free smart thermostats bundled with meters, which is outside scope |
Responses often create secondary risks. Transferring delivery risk to the supplier through penalty clauses may make the supplier more cautious and slower; choosing a different pilot district to avoid radio blackspots may make the pilot less representative, which is exactly the risk identified in lesson 3. The project manager should record secondary risks and make sure the response does not cost more, in money or in new risk, than the risk it addresses.
Worked problem
Choosing a response for the billing interface risk
Risk R3 has a 60 % probability of a 160 thousand overrun, an expected value of 96 thousand. Two reduction options are proposed: an early prototype costing 25 thousand that would cut the probability to 30 %, or hiring a contractor familiar with the billing system for 40 thousand, cutting the probability to 20 % and the impact to 120 thousand. Which is better value?
Show solution
- Current expected value: 0.60 × 160 = 96 thousand.
- Prototype: residual expected value 0.30 × 160 = 48 thousand; total expected cost including the response 48 + 25 = 73 thousand.
- Contractor: residual expected value 0.20 × 120 = 24 thousand; total expected cost 24 + 40 = 64 thousand.
- Both reduce expected cost below doing nothing (96 thousand); the contractor gives the lower total expected cost and the lower worst case (120 thousand against 160).
- Consider secondary risks: the contractor's availability, and knowledge leaving with the contractor at the end; record them if the response is chosen.
Answer: The contractor is better value on expected cost, 64 thousand against 73, and also reduces the worst case. The board might still combine both if the risk budget allows, because the interface is on the critical path.
Implement and communicate
Implementing means making sure the planned responses actually happen and that they work. The risk owner is responsible for this, with actionees carrying out specific tasks. Responses that need time or money should be built into stage plans and work packages, otherwise they compete with delivery work and lose. Communicating is not a separate step at the end; it runs throughout. Risks are reported in checkpoint reports from teams, in highlight reports to the board, in end stage reports and in the end project report, and significant changes in exposure may need to be escalated immediately.
| Communication | From | To | Risk content |
|---|---|---|---|
| Checkpoint report | Team manager | Project manager | New risks in the work package; status of responses assigned to the team |
| Highlight report | Project manager | Project board | Key risks, changes in exposure, use of risk budget, risks near tolerance |
| Escalation | Project manager | Project board | Any risk forecast to exceed risk tolerance |
| End stage report | Project manager | Project board | Risk position at the boundary; risks for the next stage |
| End project report | Project manager | Project board | Risks handed over to operations, with owners |
The risk budget
A risk budget is a sum of money included in the project budget and set aside to fund specific management responses to the project's threats and opportunities, for example the cost of fallback or contingent plans. It is not a general contingency for overruns. The rules for using it are set in the risk management approach, and the executive usually controls its release, sometimes delegating limited authority to the project manager. Any unused risk budget is normally returned to the business layer at the end of the project rather than spent.
| Fund | Purpose | Controlled by | Ridgeline Water pilot |
|---|---|---|---|
| Cost tolerance | Absorbs normal variation in planned work | Board sets; project manager works within it | +5 % on 1,450 thousand, about 72 thousand |
| Risk budget | Funds responses to specific identified risks | Executive, under rules in the risk management approach | 120 thousand |
| Change budget | Funds approved requests for change | Change authority, within limits (lesson 6) | 50 thousand per stage at the project manager's level |
Common mistakes
MistakeScoring risks without defined probability and impact scales.
InsteadDefine scales in the risk management approach before scoring.
MistakeLooking only at individual risks.
InsteadEvaluate the combined exposure against risk tolerance, for example with total expected value.
MistakeUsing the risk budget to cover general overruns.
InsteadUse it only for responses to identified risks; overruns fall within cost tolerance or lead to exceptions.
MistakePlanning responses that are never built into plans or work packages.
InsteadSchedule responses and assign them to owners and actionees.
MistakeChoosing a response without considering secondary risks.
InsteadRecord secondary risks and compare the full expected cost of each option.
Summary and key terms
- Assessment estimates each risk's probability, impact and proximity, then evaluates the combined exposure.
- Probability-impact grids prioritize attention; expected values support money decisions.
- Responses for threats include avoid, reduce, transfer, share, accept and preparing contingent plans.
- Responses for opportunities include exploit, enhance, share, reject or accept, and preparing contingent plans.
- Responses can create secondary risks, which must be recorded and weighed.
- Risk owners make sure responses are implemented; actionees carry out specific actions.
- Communication runs throughout, through checkpoint, highlight and end stage reports.
- The risk budget funds responses to identified risks and is distinct from cost tolerance and the change budget.
- Estimate (risk)
- Assessing a risk's probability, impact and proximity.
- Evaluate (risk)
- Assessing the combined effect of all risks on the project's objectives.
- Proximity
- When a risk might occur.
- Probability-impact grid
- A grid used to rank risks by their probability and impact scores.
- Expected value
- Probability multiplied by impact, used to compare and aggregate risks.
- Risk response
- An action or set of actions to reduce a threat or increase an opportunity.
- Contingent plan
- Actions prepared in advance to be carried out only if a risk occurs.
- Secondary risk
- A risk that arises as a result of carrying out a risk response.
- Residual risk
- The risk remaining after responses have been carried out.
- Risk budget
- Money set aside within the project budget to fund responses to identified risks.
Practice problems
Work each problem on paper first, then reveal the answer to check.
What are the two parts of assessing risks?
Show answer
Estimating individual risks and evaluating the combined effect.
A threat has a 25 % probability of a 200 thousand impact. What is its expected value?
Show answer
50 thousand.
Name two responses that apply only to opportunities.
Show answer
Exploit and enhance (reject also applies to opportunities).
What is the difference between reduce and prepare contingent plans?
Show answer
Reduce acts now; contingent plans are carried out only if the risk occurs.
Who controls the release of the risk budget?
Show answer
Usually the executive, under rules in the risk management approach.
What is a secondary risk?
Show answer
A risk created by carrying out a response.
Why is proximity useful?
Show answer
It shows which risks need attention soonest and whether responses can be in place in time.
Should unused risk budget be spent at the end of the project?
Show answer
No; it is normally returned to the business layer.
Which report carries the risk position to the board between stage boundaries?
Show answer
The highlight report.
Why might a board look at the largest impacts as well as total expected value?
Show answer
Because if a risk occurs the full impact is incurred, not the expected value.
Lesson quiz · 5 questions
Score 60% or more to complete this lesson.
Create a free account to save your progress, take quizzes and earn a certificate.