
PET-260 · Lesson 9 of 12 · 18 min
Separator tests and constant volume depletion
Marcus is designing a new battery for the acquired pool and wants to know what first-stage separator pressure to use. 'The vendor quotes the same price for anything up to 300 psig,' he says, using the oilfield units the vendor uses. 'Does it matter?' Ethan opens the SEP tab of the PVT spreadsheet. Five separator tests at different first-stage pressures sit side by side. On the same day, Nadia asks for help with the CVD data from a gas condensate well in the deeper part of the Tamarack Lake field.
Separator tests
In a separator test, a sample of reservoir fluid at its bubble point and reservoir temperature is flashed through one or more laboratory separators at chosen pressures and temperatures, and finally to a stock tank at atmospheric pressure. The gas from each stage is measured and analysed, and the stock-tank oil volume and gravity are measured. The results are the separator GOR at each stage, the total GOR, the stock-tank oil gravity, and the formation volume factor at the bubble point on a stock-tank basis, Bofb. These are the values that convert reservoir volumes to the stock-tank volumes that are actually sold.
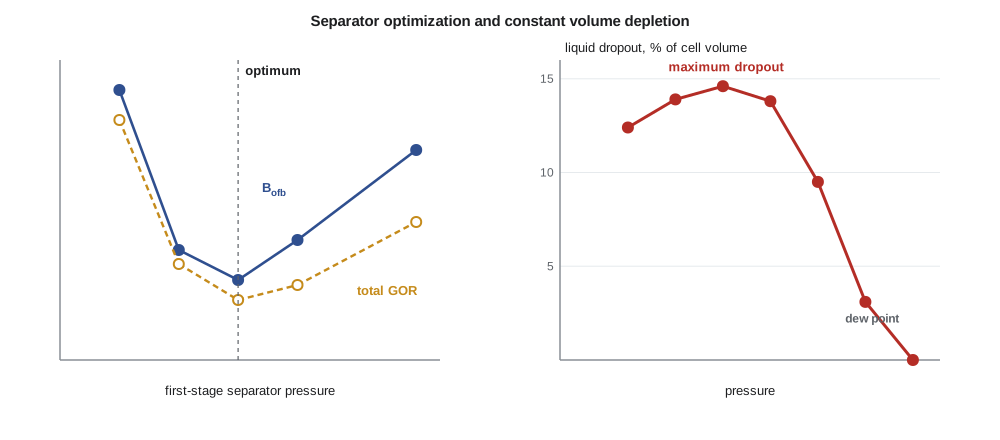
Laboratories usually run several tests at different first-stage pressures, with a fixed second stage or stock tank. As the first-stage pressure rises from near atmospheric, the stock-tank oil volume increases at first. At low first-stage pressures, much of the propane, butane and pentane leaves with the first-stage gas. At moderate pressures, more of these intermediate components stay in the liquid and reach the stock tank. At high first-stage pressures, the drop to the stock tank becomes a large flash in its own right, and intermediates are lost there. Between these extremes is an optimum pressure that gives the lowest Bofb, the lowest total GOR, the highest stock-tank oil gravity and the most stock-tank oil per reservoir barrel.
Choosing the separator pressure
The optimum depends on the fluid and on the number of stages. For black oils with two-stage separation, it is commonly between about 100 and 700 kPa (15 and 100 psig), and for lighter oils it is higher. Adding stages moves the separation closer to a differential process and increases stock-tank recovery further, with diminishing returns. In practice, separator pressure is also chosen to suit the gas gathering pressure, compression costs, vapour recovery and the stability of the stock-tank oil, which must meet a vapour pressure specification for safe transport. A higher separator pressure means less compression for the gas but more flashing in the stock tank, which must be captured by vapour recovery units to avoid venting.
# Separator test optimization and constant volume depletion recovery for a gas condensate
SI = True
tests = [  # first-stage pressure (psig), GOR scf/STB, stock-tank API, Bofb
    (50, 760, 39.1, 1.437), (100, 712, 39.8, 1.421), (150, 700, 40.1, 1.418),
    (200, 705, 40.0, 1.422), (300, 726, 39.6, 1.431)]
best = min(tests, key=lambda t: t[3])
for p, gor, api, bo in tests:
    tag = "  <- lowest Bo, most stock-tank oil" if (p, gor, api, bo) == best else ""
    print(f"{p:4d} psig: GOR {gor} scf/STB, {api:.1f} API, Bofb {bo:.3f}{tag}")
gain = (tests[0][3] / best[3] - 1) * 100
print(f"stock-tank oil gain versus the 50 psig separator: {gain:.1f} %")

# CVD: two-phase z-factor from the cell gives cumulative wellstream moles produced
steps = [  # pressure psia, two-phase z of the cell contents, liquid dropout % of cell volume
    (5200, 1.020, 0.0), (4500, 0.945, 3.1), (3800, 0.890, 9.5), (3100, 0.860, 13.8),
    (2400, 0.850, 14.6), (1700, 0.865, 13.9), (1000, 0.900, 12.4)]
pd, zd = steps[0][0], steps[0][1]             # dew point pressure and z
print(" p psia   z two-phase   dropout %   wellstream produced % of initial moles")
for p, z2, drop in steps:
    rec = 100 * (1 - (p / z2) / (pd / zd))    # moles left in the cell scale with p/z at constant volume
    print(f"{p:6d} {z2:12.3f} {drop:10.1f} {rec:14.1f}")
print("liquid that drops out in the reservoir is mostly left behind: the dropout curve shows what is lost")50 psig: GOR 760 scf/STB, 39.1 API, Bofb 1.437 100 psig: GOR 712 scf/STB, 39.8 API, Bofb 1.421 150 psig: GOR 700 scf/STB, 40.1 API, Bofb 1.418 <- lowest Bo, most stock-tank oil 200 psig: GOR 705 scf/STB, 40.0 API, Bofb 1.422 300 psig: GOR 726 scf/STB, 39.6 API, Bofb 1.431 stock-tank oil gain versus the 50 psig separator: 1.3 % p psia z two-phase dropout % wellstream produced % of initial moles 5200 1.020 0.0 0.0 4500 0.945 3.1 6.6 3800 0.890 9.5 16.2 3100 0.860 13.8 29.3 2400 0.850 14.6 44.6 1700 0.865 13.9 61.4 1000 0.900 12.4 78.2 liquid that drops out in the reservoir is mostly left behind: the dropout curve shows what is lost
For the acquired pool, the separator tests show a clear optimum at 150 psig (1,034 kPa gauge), where Bofb is 1.418 and the total GOR is 700 scf/STB (125 sm³/sm³). Compared with a 50 psig (345 kPa gauge) separator, the optimum yields 1.3 percent more stock-tank oil. On a pool producing 160 m³/d of oil, that is about 2 m³/d of extra oil for no extra cost. Ethan recommends 1,000 kPa gauge with a vapour recovery unit on the tanks, and Marcus agrees.
Constant volume depletion
Gas condensates and volatile oils are not well described by black-oil experiments. Their reservoir gas carries significant amounts of liquid, and as pressure falls below the dew point, liquid condenses in the reservoir. Most of this retrograde liquid is immobile, because its saturation stays below the critical saturation for flow, and it is lost to production unless pressure is maintained. The constant volume depletion test simulates this process.
In a CVD test, a sample of the reservoir fluid is placed in a cell at its dew point pressure and reservoir temperature, and the cell volume at the dew point is recorded. The pressure is lowered in steps by expanding the cell. At each step, after equilibrium, enough gas is removed at constant pressure to bring the cell back to its original volume. The removed gas is analysed and its volume and z-factor measured. The liquid in the cell stays behind, as it would in the reservoir. The test continues down to an abandonment pressure, often around 3,500 to 7,000 kPa (500 to 1,000 psia).
The CVD reports, at each pressure step, the volume of retrograde liquid as a percentage of the cell volume, the composition and z-factor of the produced gas, the cumulative moles of wellstream produced, and a two-phase z-factor for the whole cell contents. These data are used directly in gas condensate material balance and to calibrate equations of state. The liquid dropout curve typically rises from zero at the dew point to a maximum at some intermediate pressure, then falls slowly as the liquid partly revaporizes at lower pressures.
Material balance from CVD data
Because the cell volume is constant, the moles remaining in the cell at each step are proportional to p/z₂, where z₂ is the two-phase z-factor of the cell contents. The fraction of the original moles produced follows directly. This is the same relation as the p/z plot for a dry gas reservoir, with the two-phase z-factor replacing the gas z-factor. It shows why engineers plotting p/z for a gas condensate reservoir should use two-phase z-factors below the dew point, not the gas z-factors from correlations.
Nadia's gas condensate has a dew point of 35,850 kPa (5,200 psia). The CVD shows a maximum liquid dropout of 14.6 percent of pore volume at 16,550 kPa (2,400 psia). From the two-phase z-factors, 44.6 percent of the original moles have been produced at that pressure and 78.2 percent at 6,900 kPa (1,000 psia). Most of the heavy components that condensed in the reservoir stay there, so the condensate yield of the produced gas falls steadily as the field depletes. That observation will become the case for gas cycling in Lesson 12.
Condensate banking near wells
The CVD describes the reservoir as a whole, but the near-well region behaves differently. Close to a producing well, pressure falls below the dew point first, and liquid accumulates there continuously as gas flows through and drops liquid. The near-well liquid saturation can build up far above the CVD dropout, reaching 30 to 60 percent of pore volume, and the resulting condensate bank reduces the gas relative permeability and can cut well productivity by half or more. This is why gas condensate wells often decline faster than their reservoir pressure suggests, and why treatments such as hydraulic fracturing, gas injection near the well, or solvent treatments are used.
Worked problem
Produced moles in a CVD test
A CVD test has a dew point of 35,850 kPa with z of 1.020. At 26,200 kPa the two-phase z is 0.890. Find the percentage of the original moles produced.
Show solution
- pd/zd = 35,850/1.020 = 35,147 kPa.
- p/z₂ = 26,200/0.890 = 29,438 kPa.
- Produced = 1 − 29,438/35,147 = 1 − 0.8376 = 16.2 percent.
Answer: Only 16 percent of the moles have been produced, but much of the liquid that has condensed in the reservoir by this pressure will never reach the surface.
Separator tests on gas condensates
For a gas condensate, the separator test measures how much stock-tank liquid, called condensate, is recovered from each unit of reservoir gas. The result is usually reported as the condensate-gas ratio, or yield, in barrels per million standard cubic feet, or in cubic metres of condensate per thousand cubic metres of gas. A rich condensate may yield more than 150 barrels per million standard cubic feet (about 840 cm³ per m³); a lean one less than 30. The yield controls the revenue from a gas condensate field, because condensate is usually worth far more per unit of energy than the gas. The same optimization applies as for oils: choosing the separator pressures and temperatures, and adding stages or chilling the gas, keeps more of the propane, butane and pentane in the liquid. Many condensate fields send their gas to a gas plant, where refrigeration or turbo-expansion recovers natural gas liquids, ethane through pentanes, which are sold separately.
A key point for reservoir engineers is that the yield changes with time in a depletion-drive condensate field. As pressure falls below the dew point and liquid condenses in the reservoir, the produced gas becomes leaner, and the yield at the surface falls. The CVD test predicts this decline from the composition of the gas removed at each step. Plots of yield against reservoir pressure, built from CVD data and a separator calculation for each step, are among the most useful outputs of a gas condensate PVT study, and are the basis for revenue forecasts and for comparing depletion with gas cycling.
Separator tests also feed directly into reserves reporting. Reserves are booked in stock-tank barrels or cubic metres of oil and condensate and in standard volumes of sales gas, so the shrinkage and yield factors from separator tests, applied to the reservoir volumes from material balance or simulation, decide what is reported. Using a separator test at conditions that differ from the actual facility can bias reported reserves by a few percent, which is why the laboratory program should match the planned surface process.
Volatile oils
Volatile oils sit between black oils and gas condensates. Their liberated gas is rich enough to carry substantial liquid to the surface, so the black-oil assumption that surface gas contains no oil fails. For volatile oils, laboratories often run a CVD rather than, or as well as, a DL test, and engineers use modified black-oil models that include an oil-gas ratio Rv for the oil carried in the gas, or full compositional models. The choice of model is guided by the fluid type rules from Lesson 3 and by how strongly the gas composition changes during depletion.
Common mistakes
MistakePicking the separator pressure for gathering convenience alone.
InsteadUse separator tests to find the pressure that maximizes stock-tank oil, then weigh compression and vapour recovery.
MistakeUsing single-phase gas z-factors for a gas condensate below the dew point.
InsteadUse the two-phase z-factor from the CVD.
MistakeTreating CVD liquid dropout as recoverable.
InsteadMost retrograde liquid is immobile and lost unless pressure is maintained.
MistakeAssuming near-well liquid saturation equals the CVD dropout.
InsteadCondensate banks near wells can reach much higher saturations.
Summary and key terms
- Separator tests measure Bofb, Rsfb and stock-tank gravity at chosen surface conditions.
- An optimum first-stage separator pressure gives the most stock-tank oil and the lowest total GOR.
- The CVD test simulates depletion of gas condensates and volatile oils, leaving liquid in the cell.
- Two-phase z-factors from the CVD give moles produced through p/z₂.
- Retrograde liquid is mostly lost; condensate banks near wells reduce productivity.
- Separator test
- A laboratory flash of reservoir fluid through one or more separators and a stock tank.
- Optimum separator pressure
- The first-stage pressure that gives the most stock-tank oil per reservoir barrel.
- Constant volume depletion
- A test that removes gas at each step to keep the cell at its dew point volume.
- Retrograde liquid
- Liquid condensed from a gas condensate as pressure falls below the dew point.
- Two-phase z-factor
- The compressibility factor of the combined gas and liquid in the CVD cell.
- Condensate bank
- A zone of high liquid saturation near a gas condensate well.
Practice problems
Work each problem on paper first, then reveal the answer to check.
Why does a very low first-stage separator pressure reduce stock-tank oil?
Show answer
Too many intermediate components leave in the first-stage gas.
In a CVD at 2,400 psia, z₂ is 0.850, with pd 5,200 psia and zd 1.020. Find the produced fraction.
Show answer
1 − (2,400/0.850)/(5,098) = 1 − 0.554 = 44.6 percent.
Why does liquid dropout fall at low pressures in a CVD?
Show answer
Some of the heavier components revaporize as pressure keeps falling.
What does the CVD add for a volatile oil that DL does not?
Show answer
It accounts for the liquid carried by the produced gas and the changing gas composition.
Lesson quiz · 5 questions
Score 60% or more to complete this lesson.
Create a free account to save your progress, take quizzes and earn a certificate.