
PET-260 · Lesson 2 of 12 · 20 min
Phase behaviour of pure components and binary mixtures
Before Ethan can read the phase envelope in the PVT report, Lena sends him back to basics. 'Every reservoir fluid diagram is built from the behaviour of single substances and simple mixtures,' she says. 'Learn what happens to propane in a cylinder and to methane mixed with heptane, and the reservoir diagrams will make sense.' This lesson builds that foundation: the phase diagram of a pure substance, vapour pressure and the critical point, and then the new features that appear when two components are mixed.
Phases and the phase rule
A phase is a region of matter with uniform properties, separated from other regions by a boundary: oil, gas and water in a reservoir are three phases. The number of independent variables, called degrees of freedom, that must be fixed to define the state of a system at equilibrium is given by the Gibbs phase rule. For a pure substance there is one component; when two phases coexist, there is only one degree of freedom. Fix the temperature and the pressure is fixed too. That single pressure is the vapour pressure.
Here F is the number of degrees of freedom, C the number of components and P the number of phases. A pure gas alone has two degrees of freedom: pressure and temperature can be chosen independently. Liquid and gas together have one. At the triple point, where solid, liquid and gas coexist, there are none. For a two-component mixture with two phases, F = 2: both pressure and temperature can vary while two phases remain, which is why mixtures show a two-phase region rather than a single curve.
The pressure-temperature diagram of a pure substance
On a pressure-temperature diagram, a pure substance shows three curves meeting at the triple point. The sublimation curve separates solid and gas; the melting curve separates solid and liquid; and the vapour pressure curve separates liquid and gas. For petroleum work only the vapour pressure curve matters, because reservoir and surface temperatures are far above the triple points of hydrocarbons, except for heavy waxes.
The vapour pressure curve rises steeply with temperature and ends at the critical point. Above the critical temperature, Tc, no amount of pressure can form a separate liquid; above the critical pressure, Pc, heating never produces a separate gas. Beyond the critical point the substance is a supercritical fluid, with a density that can range continuously from gas-like to liquid-like. At the critical point itself the properties of the liquid and gas become identical: densities equal, interfacial tension zero and no meniscus.
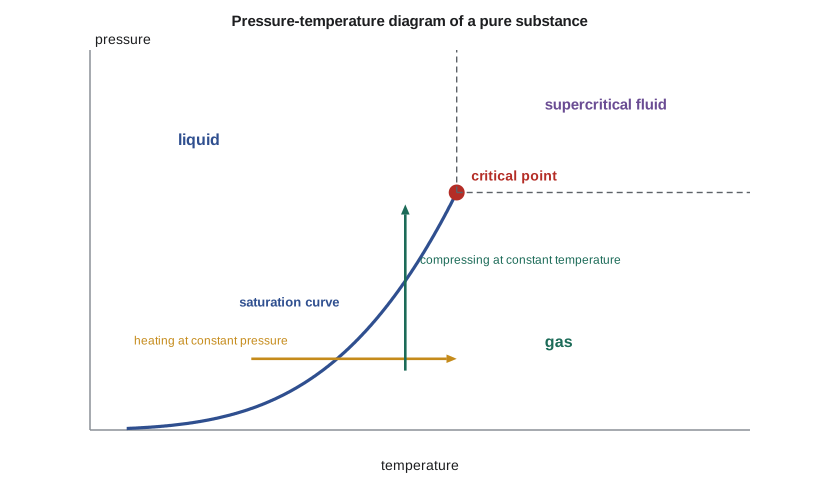
Critical properties are the anchors of almost every correlation in this course. Methane has a critical temperature of about −82.6 °C (−116.7 °F) and a critical pressure of about 4.60 MPa (667.8 psia), so in every reservoir it is far above its critical temperature. Propane's critical temperature, about 96.7 °C (206 °F), lies within the range of reservoir temperatures. Heavier components have higher critical temperatures and lower critical pressures. These numbers, together with the acentric factor, which measures how far a molecule departs from a simple spherical shape, are tabulated for all the light components and estimated for the plus fraction.
Vapour pressure and boiling
The vapour pressure of a liquid is the pressure of its vapour in equilibrium with it at a given temperature. A liquid boils when its vapour pressure equals the surrounding pressure; the normal boiling point is the temperature at which the vapour pressure is one standard atmosphere. Propane in a barbecue cylinder at summer temperatures sits at its vapour pressure, about 900 to 1,300 kPa (130 to 190 psia); as gas is withdrawn, more liquid boils and the pressure stays nearly constant until the liquid is gone. That constant-pressure behaviour is a direct result of the phase rule.
Vapour pressure rises roughly exponentially with temperature. The Clausius-Clapeyron equation, derived from thermodynamics, links the slope of the logarithm of vapour pressure against reciprocal absolute temperature to the heat of vaporization. Practical correlations, such as the Antoine equation and the Lee-Kesler correlation, extend this with extra terms so that one equation covers the whole curve from the triple point to the critical point.
# Saturation (boiling) pressure of pure hydrocarbons from the Lee-Kesler correlation (approximate critical data)
import math
SI = True
comp = {  # name: (Tc in degrees Rankine, Pc in psia, acentric factor)
    'methane': (343.0, 667.8, 0.011), 'ethane': (549.6, 707.8, 0.099),
    'propane': (665.7, 616.3, 0.152), 'n-butane': (765.3, 550.7, 0.200)}

def psat(name, T_R):
    Tc, Pc, w = comp[name]
    tr = T_R / Tc
    f0 = 5.92714 - 6.09648 / tr - 1.28862 * math.log(tr) + 0.169347 * tr ** 6
    f1 = 15.2518 - 15.6875 / tr - 13.4721 * math.log(tr) + 0.43577 * tr ** 6
    return Pc * math.exp(f0 + w * f1)

for T_F in (60.0, 100.0, 140.0):
    T = T_F + 459.67
    row = []
    for n in ('propane', 'n-butane'):
        p = psat(n, T)
        row.append(f"{n} {p:6.1f} psia" + (f" ({p * 6.895:6.0f} kPa)" if SI else ""))
    lab = f"{(T_F - 32) / 1.8:5.1f} C" if SI else f"{T_F:5.0f} F"
    print(lab + ": " + "; ".join(row))

# ethane is supercritical above its critical temperature: no saturation pressure exists
Tc = comp['ethane'][0] - 459.67
print(f"ethane critical temperature {Tc:.1f} F" + (f" ({(Tc - 32) / 1.8:.1f} C)" if SI else ""))

# Clausius-Clapeyron: slope of ln(p) against 1/T gives the heat of vaporization
T1, T2 = 80 + 459.67, 120 + 459.67
p1, p2 = psat('propane', T1), psat('propane', T2)
R = 1.987                                    # Btu/(lbmol R)
dH = -R * math.log(p2 / p1) / (1 / T2 - 1 / T1)
print(f"propane heat of vaporization near 100 F: about {dH:,.0f} Btu/lbmol" + (f" ({dH * 2.326 / 1000:.1f} kJ/mol)" if SI else ""))15.6 C: propane 108.3 psia ( 746 kPa); n-butane 26.0 psia ( 179 kPa) 37.8 C: propane 189.3 psia ( 1305 kPa); n-butane 51.8 psia ( 357 kPa) 60.0 C: propane 307.6 psia ( 2121 kPa); n-butane 93.2 psia ( 643 kPa) ethane critical temperature 89.9 F (32.2 C) propane heat of vaporization near 100 F: about 8,068 Btu/lbmol (18.8 kJ/mol)
The correlation gives propane a vapour pressure of about 750 kPa at 15.6 °C and over 2,100 kPa at 60 °C: one reason propane cylinders are kept out of direct sun. Butane's vapour pressure is much lower, which is why stock-tank oil and natural gas liquids are stabilized to control their butane content before shipping. Ethane, with a critical temperature of about 32 °C, cannot exist as a separate liquid at typical reservoir temperatures. The heat of vaporization from the slope, about 19 kJ/mol, is close to tabulated values for propane near this temperature.
Pressure-volume behaviour of a pure substance
A pressure-volume diagram tells the same story from a laboratory point of view. Imagine a cylinder of pure propane with a piston, held at constant temperature below the critical temperature. At high pressure the propane is liquid, and its volume changes little as pressure falls. When pressure reaches the vapour pressure, the first bubble of gas forms. Further expansion converts liquid to gas at constant pressure, a horizontal line on the diagram, until the last drop of liquid evaporates at the dew point. Below that, the gas expands roughly in inverse proportion to pressure. Repeating the experiment at higher temperatures shortens the horizontal line, until at the critical temperature it shrinks to a point of inflection. Lesson 8 shows that the laboratory constant composition expansion test does exactly this for a reservoir oil.
Binary mixtures: the two-phase envelope
Add a second component and the picture changes in an important way. For a mixture of, say, methane and n-heptane at fixed composition, the transition from liquid to gas no longer happens at a single pressure for each temperature. When pressure falls, the first bubble of gas appears at the bubble point pressure; the gas is rich in methane, the more volatile component. As pressure falls further, more gas forms and the remaining liquid becomes richer in heptane, so its bubble point drops. The last drop of liquid disappears at the dew point pressure, which is lower than the bubble point. Between them lies a two-phase region.
Plotting bubble points and dew points over a range of temperatures traces a closed loop on the pressure-temperature diagram: the phase envelope. The bubble point curve and dew point curve meet at the mixture's critical point, where the two phases become identical. Unlike a pure substance, the critical point of a mixture is generally not at the highest pressure or highest temperature of the envelope. The highest pressure on the envelope is the cricondenbar, and the highest temperature is the cricondentherm. Between the critical point and these maxima lie the regions where retrograde behaviour occurs, introduced in lesson 3.
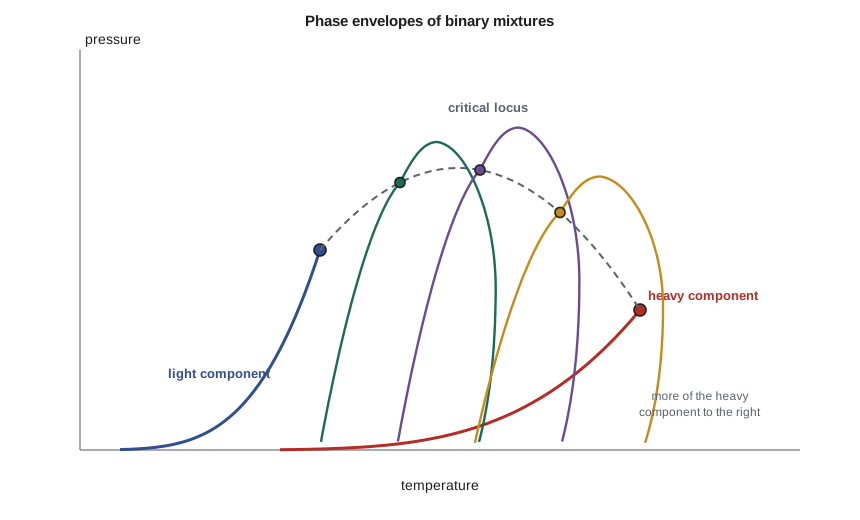
As the composition of a binary changes from pure light component to pure heavy component, the envelope sweeps across the diagram between the two vapour pressure curves. The locus of mixture critical points can rise far above the critical pressures of both pure components. For methane and n-decane, mixture critical pressures reach about 35 MPa (5,000 psia), compared with 4.6 MPa (668 psia) for methane and about 2.1 MPa (305 psia) for decane. Mixtures of components with very different volatilities therefore have large envelopes. Real reservoir fluids, with dozens of components, behave like a binary of a light pseudo-component and a heavy one, which is why binary diagrams are such a useful guide.
Composition diagrams and tie lines
At fixed temperature, a binary system can also be drawn on a pressure-composition diagram, with the mole fraction of the light component across the bottom. The bubble point curve and dew point curve form a lens-shaped two-phase region. A horizontal line through a point inside the lens, called a tie line, ends at the compositions of the equilibrium liquid and gas. The lever rule then gives the fraction of moles in each phase: the closer the overall composition is to the gas end of the tie line, the more of the mixture is gas. This simple geometry underlies the flash calculations of lesson 10, where the same idea is extended to many components with equilibrium ratios.
In the lever rule, z is the overall mole fraction of the light component, x its mole fraction in the liquid and y in the gas. If the overall mixture is 60 mole % methane and the equilibrium liquid and gas at the chosen pressure contain 35 and 95 mole % methane, the gas fraction is (0.60 − 0.35)/(0.95 − 0.35) = 0.42: 42 percent of the moles are in the gas.
Ternary diagrams
Reservoir engineers often lump a fluid into three pseudo-components, for example light (C1 and N2), intermediate (C2 to C6 and CO2) and heavy (C7+), and plot compositions on a triangular, or ternary, diagram at fixed pressure and temperature. Each corner represents a pure pseudo-component and each point inside a mixture. The two-phase region appears as a domed area with tie lines across it, ending at a plait point, the ternary version of the critical point. Ternary diagrams are the classic tool for explaining how injected gas becomes miscible with oil, the topic of lesson 12.
Worked problem
Using the phase rule and the lever rule
A binary mixture of methane and n-butane, 50 mole % methane overall, is held at a temperature and pressure where the equilibrium liquid contains 20 mole % methane and the equilibrium gas contains 88 mole % methane. (a) How many degrees of freedom does the system have? (b) What fraction of the moles is gas? (c) If the total is 10 moles, how many moles of methane are in the liquid?
Show solution
- (a) C = 2, P = 2, so F = 2 − 2 + 2 = 2: pressure and temperature can both vary while two phases remain.
- (b) Gas fraction = (0.50 − 0.20)/(0.88 − 0.20) = 0.30/0.68 = 0.441.
- (c) Liquid moles = 10 × (1 − 0.441) = 5.59; methane in liquid = 5.59 × 0.20 = 1.12 moles.
- Check: gas moles 4.41 × 0.88 = 3.88 methane; total methane 1.12 + 3.88 = 5.00, matching 50 percent of 10.
Answer: Material balance on a component always closes: the lever rule is simply that balance written for a two-phase system.
From binaries to reservoir fluids
Three lessons from binary systems carry straight into reservoir engineering. First, mixtures release gas or condense liquid over a range of pressures, not at one pressure, and the phase compositions change as they do. Second, the more different the volatilities of the components, the larger the two-phase envelope. Third, the critical point of a mixture can lie on either side of the cricondenbar and cricondentherm, so the location of the reservoir temperature relative to the critical point decides whether a reservoir fluid behaves as an oil or a gas. Lesson 3 applies these ideas to multicomponent envelopes and the classification of reservoir fluids.
Common mistakes
MistakeExpecting a mixture to boil at a single pressure, as a pure substance does.
InsteadMixtures have a bubble point and a lower dew point with a two-phase region between them.
MistakeAssuming the mixture critical point is the highest pressure on the envelope.
InsteadThe highest pressure is the cricondenbar; the critical point is where the bubble and dew point curves meet.
MistakeUsing gauge pressure or degrees Celsius in vapour pressure equations.
InsteadClausius-Clapeyron and most correlations need absolute pressure and absolute temperature.
MistakeReading phase amounts from the lever rule backwards.
InsteadGas fraction = (z − x)/(y − x); the phase nearer the overall composition is the larger one.
Summary and key terms
- The phase rule, F = C − P + 2, explains why a pure substance has a single vapour pressure curve and a mixture has a two-phase region.
- The vapour pressure curve ends at the critical point; above it, separate liquid and gas cannot exist.
- Clausius-Clapeyron links vapour pressure to temperature through the heat of vaporization.
- Binary mixtures show bubble point and dew point curves joined at a critical point, with a cricondenbar and cricondentherm.
- Tie lines and the lever rule give phase compositions and amounts; ternary diagrams extend the idea to three pseudo-components.
- Phase rule
- F = C − P + 2, the number of independent intensive variables at equilibrium.
- Vapour pressure
- The pressure at which a pure liquid and its vapour coexist at a given temperature.
- Critical point
- The state at which liquid and gas phases become identical.
- Bubble point
- The pressure at which the first gas bubble forms as a liquid is depressurized.
- Dew point
- The pressure at which the first liquid drop forms (or the last disappears) in a gas.
- Cricondenbar
- The highest pressure at which two phases can coexist for a mixture.
- Cricondentherm
- The highest temperature at which two phases can coexist for a mixture.
- Tie line
- A line joining the compositions of equilibrium liquid and gas.
Practice problems
Work each problem on paper first, then reveal the answer to check.
How many degrees of freedom has a three-component system with two phases?
Show answer
F = 3 − 2 + 2 = 3.
Propane's vapour pressure is 1,305 kPa at 37.8 °C and 2,121 kPa at 60 °C. Estimate its heat of vaporization.
Show answer
ΔH = −R ln(2121/1305)/(1/333.15 − 1/310.95) = 8.314 × 0.4857/2.143 × 10⁻⁴ ≈ 18.8 kJ/mol.
Why does the bubble point of a binary liquid fall as gas is removed at constant temperature?
Show answer
The gas removed is rich in the light component, so the remaining liquid becomes heavier and less volatile.
A binary is 30% light component; the tie line ends at x = 0.10 and y = 0.80. Find the gas fraction.
Show answer
(0.30 − 0.10)/(0.80 − 0.10) = 0.286.
Lesson quiz · 5 questions
Score 60% or more to complete this lesson.
Create a free account to save your progress, take quizzes and earn a certificate.