
PET-260 · Lesson 8 of 12 · 19 min
Constant composition expansion and differential liberation
The samples from the acquired pool reach the PVT laboratory at a commercial core laboratory in Calgary in good condition: two bottomhole samples with matching opening pressures, and a separator set as a backup. Three weeks later the first data arrive by email, a spreadsheet with tabs named CCE, DL, SEP and VISC. Nadia forwards it to Ethan with one line: 'Check it before I put it in the model. Start with the Y-function.'
The standard black-oil PVT study
A routine PVT study on a black oil or volatile oil sample has a standard set of experiments. Compositional analysis of the reservoir fluid, usually to C₁₀+ or C₃₆+, gives the starting point. Constant composition expansion (CCE), also called a flash vaporization or pressure-volume relation test, measures the bubble point and the volumetric behaviour of the whole fluid. Differential liberation (DL) simulates the depletion of the reservoir below the bubble point, measuring Rs, Bo, gas properties and oil density at each pressure. Separator tests, covered in Lesson 9, measure the effect of surface separation. Viscosity tests measure oil viscosity above and below the bubble point. Each experiment simulates a different process, and the engineer's job is to combine them correctly into the properties needed for reservoir calculations.
| Experiment | Process simulated | Main results |
|---|---|---|
| Constant composition expansion | Expansion of the total fluid with no removal | Bubble point, relative volume, oil compressibility, Y-function |
| Differential liberation | Gas removed at each pressure step, as in the reservoir | Rsd, Bod, gas z-factor and gravity, oil density |
| Separator test | Flash through the surface separators | Rsfb, Bofb, stock-tank gravity, separator GOR |
| Viscosity | Live oil flow at reservoir temperature | Oil viscosity against pressure |
| Constant volume depletion | Depletion of a gas condensate or volatile oil | Liquid dropout, produced compositions, two-phase z |
Constant composition expansion
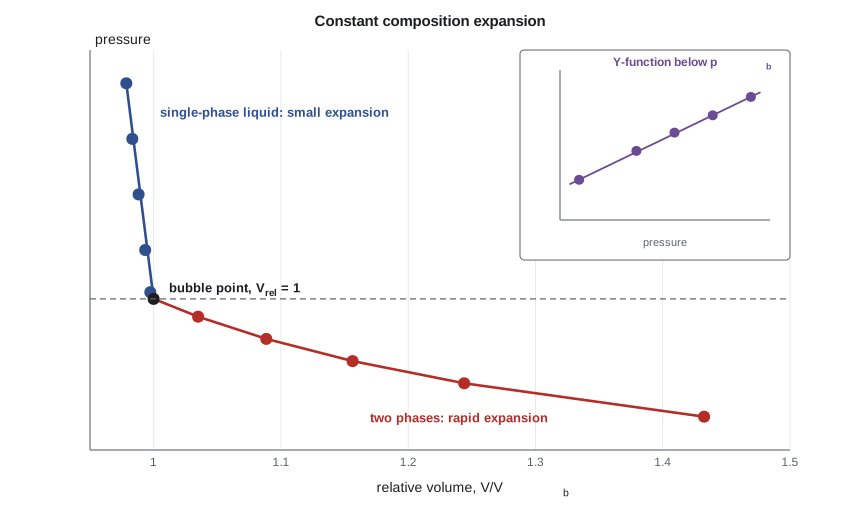
In a CCE test, a sample of reservoir fluid is placed in a visual cell at reservoir temperature and at a pressure above the reservoir pressure. The pressure is lowered in steps by withdrawing mercury or moving a piston, and the total volume of the cell contents is measured at each step. Nothing is removed from the cell, so the overall composition stays constant. Above the bubble point, the volume increases slowly, controlled by the oil compressibility. Below the bubble point, gas comes out of solution, and the volume increases much faster. The bubble point is found where the pressure-volume curve breaks in slope. In a visual cell, the first bubble can also be seen.
Results are reported as relative volume, the ratio of the total volume at each pressure to the volume at the bubble point. Above the bubble point, the relative volume is less than 1; below, it is greater than 1. The data above the bubble point give the oil compressibility directly. For a volatile oil, the break in slope is less sharp, because the oil and gas are more alike, and the bubble point is harder to pick; visual observation helps.
The Y-function
Below the bubble point, CCE relative volumes are hard to measure precisely near the bubble point, where the volume changes are small. The Y-function, defined below, smooths the data and checks the bubble point. For most black oils, Y plotted against pressure is a straight line. If the points near the bubble point curve up or down, the chosen bubble point is probably wrong, or the measurements near it are imprecise. Laboratories often report smoothed relative volumes calculated from a straight-line fit of Y.
The Y-function works poorly for oils with high concentrations of non-hydrocarbon gases, and for volatile oils close to their critical point. For those, other checks such as the material balance of the DL test are more useful.
Differential liberation
Differential liberation is designed to simulate what happens in the reservoir below the bubble point. Gas, being more mobile than oil, moves away from the oil it came out of, either toward the wells or upward to a gas cap. In the DL test, the sample in the cell is brought to the bubble point at reservoir temperature, and then the pressure is lowered in steps. At each step the liberated gas is removed at constant pressure by pushing mercury or a piston, and its volume, composition and gravity are measured. The oil volume is measured after each step. At the last step, the pressure reaches atmospheric and the cell is cooled to 60 °F (15.6 °C) to measure the residual oil volume.
The DL results are reported relative to the residual oil volume: the differential solution GOR, Rsd, is the volume of gas still in solution at each pressure per volume of residual oil, and the differential oil formation volume factor, Bod, is the oil volume at each pressure per volume of residual oil. The test also reports the gas z-factor and gravity at each step and the oil density, which is used to check the experiment's material balance.
Why DL data must be adjusted
Residual oil is not stock-tank oil. The residual oil from a DL test has been through a long series of small flashes at reservoir temperature, while stock-tank oil has been through one or two separators and a stock tank at surface temperatures. Different processes leave different amounts of liquid: in most black oils, the DL process leaves less liquid than field separation, so Bod is larger than Bo and Rsd is larger than Rs. Using DL data directly in reservoir calculations overstates the oil formation volume factor and the solution gas, and understates the oil in place.
The standard adjustment uses the separator test results at the bubble point, Bofb and Rsfb, to convert the DL data to a stock-tank oil basis. The equations scale Bod by the ratio Bofb/Bodb, and convert the gas liberated below the bubble point in the same ratio. At low pressures, this approach can give small negative values of Rs, which are set to zero; the adjustment is approximate, and for volatile oils an equation-of-state model calibrated on all the data is a better way to generate properties.
# Constant composition expansion: bubble point, Y-function, oil compressibility; differential liberation adjusted
import math
SI = True
cce = [(4500, 0.9785), (4000, 0.9832), (3500, 0.9882), (3000, 0.9934), (2620, 0.9974), (2560, 1.0000),
       (2400, 1.0349), (2200, 1.0885), (2000, 1.1563), (1800, 1.2440), (1500, 1.4325)]
pb = 2560.0                                   # break in slope of pressure against volume
print("Y-function below the bubble point (should be close to a straight line):")
for p, v in cce:
    if p < pb:
        y = (pb - p) / (p * (v - 1))
        print(f"  {p:5d} psia  Vrel {v:.4f}  Y {y:.3f}")
p1, v1 = cce[0]; p2, v2 = cce[3]
co = -math.log(v1 / v2) / (p1 - p2)           # average undersaturated compressibility
print(f"average oil compressibility {p2}-{p1} psia: {co * 1e6:.1f} x 10^-6 per psi" +
      (f" ({co * 1e6 / 6.895:.2f} x 10^-6 per kPa)" if SI else ""))

# differential liberation (Bod, Rsd) adjusted with the separator test (Bofb, Rsfb)
dl = [(2560, 1.482, 775), (2000, 1.418, 640), (1500, 1.360, 520), (1000, 1.302, 395), (500, 1.240, 255), (15, 1.085, 0)]
Bofb, Rsfb = 1.420, 700.0                     # from the chosen separator test
Bodb, Rsdb = dl[0][1], dl[0][2]
print("  p psia   Bo adjusted   Rs adjusted (scf/STB)")
for p, bod, rsd in dl:
    bo = bod * Bofb / Bodb
    rs = Rsfb - (Rsdb - rsd) * Bofb / Bodb
print(f"{p:7d} {bo:13.3f} {max(rs, 0):14.0f}")Y-function below the bubble point (should be close to a straight line):
2400 psia Vrel 1.0349 Y 1.910
2200 psia Vrel 1.0885 Y 1.849
2000 psia Vrel 1.1563 Y 1.791
1800 psia Vrel 1.2440 Y 1.730
1500 psia Vrel 1.4325 Y 1.634
average oil compressibility 3000-4500 psia: 10.1 x 10^-6 per psi (1.46 x 10^-6 per kPa)
p psia Bo adjusted Rs adjusted (scf/STB)
2560 1.420 700
2000 1.359 571
1500 1.303 456
1000 1.248 336
500 1.188 202
15 1.040 0The acquired pool's CCE gives a bubble point of 17,650 kPa (2,560 psia). The Y-function falls smoothly from 1.91 to 1.63 between 16,550 and 10,340 kPa, supporting the bubble point pick. Oil compressibility above the bubble point averages 1.46 × 10⁻⁶ per kPa. The adjusted DL gives Bo of 1.420 rm³/sm³ at the bubble point and Rs of 125 sm³/sm³ (700 scf/STB), compared with 1.482 and 138 sm³/sm³ in the raw DL data. Using the raw numbers would have understated the oil in place by about 4 percent.
Gas and oil density data from DL
Besides Rsd and Bod, the DL test reports the properties of each increment of liberated gas: its z-factor, its specific gravity and its gas formation volume factor at reservoir temperature. The gas gravity rises steadily as pressure falls, typically from about 0.7 at the first step to 1.2 or more at the last, because the light components leave first and the heavier ones follow. These gas properties go directly into reservoir simulation tables, and they also serve as a check on the gas gravity used in correlations. The DL also reports the density of the oil remaining in the cell at each step, which rises as gas leaves. Oil density at the bubble point, together with the stock-tank oil density, closes the mass balance of the whole test. Where a field will be produced by gravity drainage or will form a secondary gas cap, the changing densities of oil and gas also control the rate at which gas segregates upward, so they matter for recovery as well as for accounting.
Checking the data
Every PVT report should be checked before use. The CCE bubble point and the DL starting point should agree. The DL material balance should close: the mass of oil at the bubble point should equal the mass of residual oil plus the mass of all the gas removed, within about 1 to 2 percent. Rs and Bo should decrease smoothly with pressure, and the gas gravity should increase as heavier components come out at lower pressures. The reported composition, when used with an equation of state, should reproduce the bubble point within a few percent before any tuning. Data that fail these checks are not necessarily wrong, but they need an explanation from the laboratory.
Worked problem
Oil compressibility from CCE
A CCE test gives relative volumes of 0.9785 at 31,030 kPa and 0.9934 at 20,680 kPa, both above the bubble point. Find the average oil compressibility.
Show solution
- co = −ln(V₁/V₂)/(p₁ − p₂) = −ln(0.9785/0.9934)/(31,030 − 20,680).
- ln(0.98500) = −0.01511.
- co = 0.01511/10,350 = 1.46 × 10⁻⁶ per kPa.
Answer: The value is typical for a light black oil. It enters material balance above the bubble point, together with the rock and water compressibilities.
Viscosity measurements
Oil viscosity is measured at reservoir temperature with a rolling ball or electromagnetic viscometer, or with a capillary viscometer, at pressures above and below the bubble point. Below the bubble point, measurements are made on the oil remaining after each DL step. The resulting curve has the shape shown in Lesson 5: minimum viscosity at the bubble point, slowly rising above it and rising steeply below it. Measured viscosities are among the most valuable PVT data for waterflood and recovery calculations, because correlations for viscosity are so uncertain.
Choosing the experiments
Not every study needs every experiment. A black oil field with a single-stage separator may need only a composition, a CCE, a DL, one separator test and a viscosity curve. A volatile oil or near-critical fluid needs a CVD as well as, or instead of, a DL, because its gas carries significant liquid and the black-oil assumption becomes poor. Fields planned for gas injection need additional tests such as swelling tests and slim-tube or multiple-contact tests, covered in Lesson 12. The cost of a full study is small compared with the cost of developing a field with the wrong fluid model.
Common mistakes
MistakeUsing raw DL Bod and Rsd directly in material balance.
InsteadAdjust DL data to separator conditions using Bofb and Rsfb.
MistakePicking the bubble point from a single point without checking the Y-function.
InsteadPlot Y against pressure and check for a straight line.
MistakeAssuming CCE and DL measure the same process.
InsteadCCE keeps the gas in contact; DL removes it at each step.
MistakeAccepting a PVT report without a material balance check.
InsteadCheck that DL mass balance closes within about 1 to 2 percent.
Summary and key terms
- A standard black-oil PVT study includes composition, CCE, DL, separator tests and viscosity.
- CCE measures the bubble point, relative volumes and undersaturated compressibility at constant composition.
- The Y-function checks and smooths CCE data below the bubble point.
- DL removes gas at each step to simulate reservoir depletion, reporting Rsd and Bod relative to residual oil.
- DL data must be adjusted to separator conditions before use; Bofb and Rsfb from the separator test do this.
- Constant composition expansion
- A test that expands the whole fluid sample in steps without removing any material.
- Relative volume
- Total volume at a pressure divided by the volume at the bubble point.
- Y-function
- A function of CCE data below the bubble point that is close to a straight line for most black oils.
- Differential liberation
- A test that removes liberated gas at each pressure step, simulating reservoir depletion.
- Residual oil
- The oil left at atmospheric pressure and 60 °F at the end of a DL test.
- Bofb
- Oil formation volume factor at the bubble point from a separator test.
Practice problems
Work each problem on paper first, then reveal the answer to check.
CCE gives Vrel = 1.2440 at 1,800 psia with pb 2,560 psia. Find Y.
Show answer
Y = 760/(1,800 × 0.2440) = 1.730.
Bodb = 1.482, Bofb = 1.420. Find adjusted Bo where Bod = 1.302.
Show answer
1.302 × 1.420/1.482 = 1.248.
Why is Bod usually larger than Bo from separator tests?
Show answer
DL leaves less residual liquid than staged field separation, so volumes per residual barrel are larger.
Which experiment measures the bubble point most directly?
Show answer
Constant composition expansion.
Lesson quiz · 5 questions
Score 60% or more to complete this lesson.
Create a free account to save your progress, take quizzes and earn a certificate.