
PET-260 · Lesson 5 of 12 · 19 min
Oil properties and black-oil correlations
Prairie Crest has just bought a small Cardium pool from another operator. The data room has production histories, logs and one line about the fluid: 'light sweet crude, 40 API, solution GOR about 160 m³/m³'. There is no PVT report. Lena asks Ethan to estimate the bubble point, formation volume factor and viscosity so that the acquisition team can run early forecasts. 'Correlations will get you within ten or twenty percent,' she says. 'Good enough to decide whether the pool is worth a proper sample. Not good enough to design a waterflood.'
The black-oil model
Most oil reservoir engineering uses the black-oil model, which describes a reservoir fluid with just two surface components: stock-tank oil and surface gas. The oil phase in the reservoir is stock-tank oil plus dissolved gas; the gas phase is surface gas, which in some extensions can carry vaporized oil. Every property is expressed as a function of pressure at reservoir temperature: the solution gas-oil ratio Rs, the oil formation volume factor Bo, the gas formation volume factor Bg, and the oil and gas viscosities. This simple description works well for black oils, whose compositions change little during depletion, and is the basis of material balance and most reservoir simulators. PET-250 introduced these properties; this lesson looks at how they behave, how they are estimated and where the estimates fail.
Behaviour with pressure
Above the bubble point, the oil is undersaturated. Rs is constant, equal to its value at the bubble point, Rsb, because no gas has left solution. Bo increases slightly as pressure falls toward the bubble point, because the liquid expands, and the oil viscosity falls slightly. At the bubble point, Bo reaches its maximum, Bob. Below the bubble point, gas leaves solution: Rs falls, the oil shrinks so Bo falls, and the oil viscosity rises because the lightest, least viscous components have gone. At atmospheric pressure and reservoir temperature, Rs is zero and Bo is slightly above 1, due only to thermal expansion; cooling to standard temperature brings it to exactly 1.
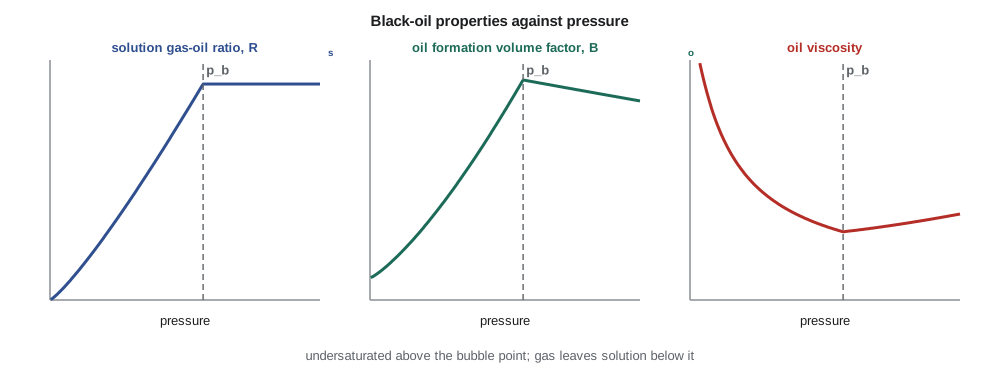
The undersaturated part of the Bo curve is governed by the oil compressibility, co, which is typically 5 to 20 × 10⁻⁶ per psi (0.7 to 3 × 10⁻⁶ per kPa) for black oils and higher for volatile oils. Above the bubble point, Bo = Bob exp[−co(p − pb)]. Below the bubble point, an apparent compressibility that includes gas coming out of solution is many times larger, which is why reservoir pressure falls much more slowly per barrel produced once a reservoir drops below its bubble point.
Two other quantities are often reported. The total formation volume factor, Bt, is the reservoir volume of oil plus its liberated gas per stock-tank volume of oil; below the bubble point it grows rapidly, because gas occupies so much volume. And oil density at reservoir conditions follows from a mass balance: the mass of stock-tank oil plus the mass of dissolved gas, divided by the reservoir volume Bo.
Bubble point and Rs correlations
Black-oil correlations estimate properties from four quantities that are usually available from production data: solution gas-oil ratio, stock-tank oil gravity, separator gas gravity and reservoir temperature. Standing's correlations, published in 1947 from California oils, were the first widely used set. Later sets fitted other regional data: Lasater, Vasquez and Beggs, Glasø for North Sea oils, Al-Marhoun for Middle East oils, and many more. All have the same structure: bubble point pressure rises with more dissolved gas, with lighter (lower gravity) gas, with heavier oil and with higher temperature.
Standing's bubble point equation is written in oilfield units, with pb in psia, Rsb in scf/STB and T in °F. The Vasquez-Beggs correlation, fitted to about 6,000 measurements, uses separate constants for oils above and below 30 API and an exponential temperature term. Below the bubble point, the same equations, solved for Rs at a given pressure, give the solution gas-oil ratio curve. Bo is correlated from Rs, gas and oil gravities and temperature.
Viscosity correlations
Oil viscosity correlations work in two steps. First, the dead oil viscosity, μod, of gas-free oil at reservoir temperature is estimated from API gravity and temperature, for example with the Beggs-Robinson correlation. Dead oil viscosity is the most uncertain step, because oils of the same gravity can differ in viscosity by a factor of several depending on their chemistry. Second, a live oil correlation reduces the dead oil viscosity for the dissolved gas, using Rs. Above the bubble point, a further correction raises viscosity slightly with pressure. Where possible, engineers measure dead oil viscosity on a stock-tank sample, a cheap test, and use correlations only for the live-oil corrections.
# Black-oil correlations: bubble point, Rs, Bo and viscosity (approximate published constants)
import math
SI = True
api, gg, T = 40.0, 0.78, 170.0               # oil gravity, gas gravity, reservoir temperature (F)
Rsb = 900.0                                   # solution GOR at the bubble point, scf/STB
og = 141.5 / (131.5 + api)

a = 0.00091 * T - 0.0125 * api                # Standing bubble point
pb = 18.2 * ((Rsb / gg) ** 0.83 * 10 ** a - 1.4)
print(f"Standing bubble point {pb:,.0f} psia" + (f" ({pb * 6.895:,.0f} kPa)" if SI else ""))

def rs_vb(p):                                 # Vasquez-Beggs, API above 30
    return 0.0178 * gg * p ** 1.1870 * math.exp(23.931 * api / (T + 460))
def bo_vb(rs):
    return 1 + 4.670e-4 * rs + 1.100e-5 * (T - 60) * (api / gg) + 1.337e-9 * rs * (T - 60) * (api / gg)
def bo_st(rs):
    return 0.9759 + 0.00012 * (rs * math.sqrt(gg / og) + 1.25 * T) ** 1.2

x = 10 ** (10 ** (3.0324 - 0.02023 * api) * T ** -1.163)    # Beggs-Robinson dead oil viscosity
mu_od = x - 1
print(f"Vasquez-Beggs Rs at that pressure: {rs_vb(pb):.0f} scf/STB (input {Rsb:.0f})")
print(f"dead oil viscosity {mu_od:.2f} cP")
print("  p psia   Rs scf/STB   Bo Standing   Bo V-B   live visc cP")
for p in (4000, 3000, round(pb), 2000, 1000, 300):
    rs = Rsb if p >= pb else Rsb * rs_vb(p) / rs_vb(pb)
    A_ = 10.715 * (rs + 100) ** -0.515; B_ = 5.44 * (rs + 150) ** -0.338
    mu = A_ * mu_od ** B_
    bs, bv = bo_st(rs), bo_vb(rs)
    if p > pb:                                # undersaturated: compress from the bubble point
        f = math.exp(-1.5e-5 * (p - pb)); bs, bv = bs * f, bv * f
        mu = mu * (p / pb) ** 0.1             # simple pressure correction, illustrative
print(f"{p:7d} {rs:11.0f} {bs:13.3f} {bv:9.3f} {mu:11.3f}")Standing bubble point 2,834 psia (19,543 kPa)
Vasquez-Beggs Rs at that pressure: 795 scf/STB (input 900)
dead oil viscosity 1.67 cP
p psia Rs scf/STB Bo Standing Bo V-B live visc cP
4000 900 1.478 1.463 0.412
3000 900 1.501 1.485 0.400
2834 900 1.504 1.489 0.398
2000 595 1.336 1.344 0.496
1000 261 1.167 1.186 0.742
300 63 1.077 1.092 1.225Standing gives a bubble point of about 2,830 psia (19.5 MPa) for the acquired pool's oil. Vasquez-Beggs, evaluated at that pressure, predicts only 795 scf/STB instead of 900: a 12 percent difference between two respected correlations, typical of the uncertainty. The two correlations give Bo values within about one percent of each other at 1.49 to 1.50 rm³/sm³. Dead oil viscosity is about 1.7 mPa·s, and the live oil viscosity is only about 0.4 mPa·s at the bubble point, rising to over 1.2 at low pressure as the gas leaves.
Choosing and checking a correlation
No correlation is best everywhere. A correlation fitted to Middle Eastern oils may perform poorly for Canadian or US oils, and correlations extrapolated beyond their data can fail badly. Good practice is to test several correlations against any measured data available in the same basin, choose the one that fits best, and, if possible, tune its constants to local data. Published evaluations typically find average errors of 5 to 15 percent for bubble point and 1 to 3 percent for Bo, with much larger errors for viscosity. The constants used in this lesson are as commonly published and should be treated as approximate.
Correlations also assume the inputs are consistent. The solution gas-oil ratio must be the initial producing gas-oil ratio of an undersaturated oil, measured before reservoir pressure falls below the bubble point; later ratios include free gas and overstate Rs. The gas gravity should be that of the separator gas, and the oil gravity that of the stock-tank oil. Two-stage separation and stock-tank vent gas must be added together for the total gas-oil ratio. Many errors in correlation results come from inconsistent inputs rather than from the correlation itself.
Separator effects
The volume of stock-tank oil obtained from a barrel of reservoir oil depends on how the gas is separated at the surface. Separating gas in stages, at intermediate pressures, keeps more intermediate components in the liquid and yields more stock-tank oil than flashing the fluid straight to atmospheric pressure. As a result, Bo and Rs are not unique properties of the reservoir oil: they depend on the separator conditions. Correlations implicitly assume typical field separation. Lesson 9 shows how laboratory separator tests measure these effects and how engineers choose the best separator pressure.
Worked problem
Undersaturated oil formation volume factor
The acquired pool's oil has a bubble point of 19.5 MPa and Bob of 1.50 rm³/sm³. Its compressibility above the bubble point is 2.2 × 10⁻⁶ per kPa. Initial reservoir pressure is 27.6 MPa. Find Bo at initial pressure, and the stock-tank oil in 1.0 × 10⁶ m³ of reservoir oil.
Show solution
- p − pb = 27,600 − 19,500 = 8,100 kPa.
- Bo = 1.50 exp(−2.2 × 10⁻⁶ × 8,100) = 1.50 × exp(−0.01782) = 1.50 × 0.9823 = 1.474 rm³/sm³.
- Stock-tank oil = 1.0 × 10⁶/1.474 = 6.79 × 10⁵ m³.
Answer: Above the bubble point Bo changes by only one or two percent, but ignoring it would still bias a large volume calculation. Below the bubble point the changes are far larger.
Oil compressibility below the bubble point
Below the bubble point the oil phase and its released gas behave together, and material balance uses an apparent oil compressibility that combines the shrinkage of the oil with the expansion of the gas leaving it. The expression includes the slope of Bo, the slope of Rs and the gas formation volume factor. With typical values, the apparent compressibility just below the bubble point is often 100 to 300 × 10⁻⁶ per psi (15 to 45 × 10⁻⁶ per kPa), ten or more times the undersaturated value. That jump explains why the pressure decline of a solution-gas-drive reservoir slows sharply once the bubble point is reached, and why the producing gas-oil ratio then rises as free gas becomes mobile once its saturation passes the critical gas saturation. Correlations for Rs and Bo, if they are smooth and consistent, can supply these slopes; inconsistent sets, such as Standing for Rs and a different author for Bo, can give slopes of the wrong sign and should be checked before use in a model.
Heavy oil and bitumen
Heavy oils, below about 22 API, and bitumen, below 10 API, stretch black-oil correlations beyond their limits. Their dead oil viscosities range from hundreds of mPa·s to millions, with very strong temperature dependence, which is why thermal recovery methods such as steam-assisted gravity drainage in the Alberta oil sands work by heating the bitumen. Their solution gas-oil ratios are small, often a few cubic metres per cubic metre, and some heavy oils produce as foamy oil, with gas bubbles dispersed in the oil rather than separating quickly. Special correlations, and above all measured viscosity-temperature data, are needed for these fluids.
Common mistakes
MistakeUsing a late-life producing GOR as Rsb in a correlation.
InsteadUse the initial GOR of an undersaturated oil, before free gas is produced.
MistakeTreating Bo as a fixed property of the oil.
InsteadBo depends on pressure and on separator conditions.
MistakeTrusting dead oil viscosity correlations to better than a factor of two.
InsteadMeasure dead oil viscosity on a stock-tank sample where possible.
MistakeExtrapolating a correlation outside its data range.
InsteadCheck the published range of gravities, temperatures and GORs, and compare with local measurements.
Summary and key terms
- The black-oil model describes reservoir fluids with stock-tank oil and surface gas, with properties as functions of pressure.
- Above the bubble point Rs is constant and Bo rises slightly as pressure falls; below it both fall.
- Correlations such as Standing and Vasquez-Beggs estimate pb, Rs and Bo from GOR, gravities and temperature.
- Viscosity is estimated in two steps: dead oil from gravity and temperature, then live oil from Rs.
- Correlation errors of 10 to 20 percent are common; inputs must be consistent and local data used to choose and tune correlations.
- Black-oil model
- A two-component description of reservoir fluids using stock-tank oil and surface gas.
- Bubble point pressure
- The pressure at which gas first leaves solution in an oil.
- Undersaturated oil
- Oil above its bubble point.
- Dead oil
- Oil with no dissolved gas, at stock-tank conditions.
- Live oil
- Oil containing dissolved gas at reservoir conditions.
- Total formation volume factor
- Reservoir volume of oil plus liberated gas per stock-tank volume of oil.
- Correlation
- An empirical equation fitted to measured data from many fluids.
Practice problems
Work each problem on paper first, then reveal the answer to check.
An oil has Rsb 600 scf/STB, γg 0.75, 35 API and T 160 °F. Estimate pb with Standing.
Show answer
a = 0.00091 × 160 − 0.0125 × 35 = −0.2919; (600/0.75)^0.83 = 800^0.83 ≈ 257; × 10^−0.2919 ≈ 131.5; pb = 18.2(131.5 − 1.4) ≈ 2,370 psia.
Why does oil viscosity rise below the bubble point?
Show answer
The lightest components leave as gas, leaving a heavier, more viscous oil.
Bob is 1.30 and co is 10 × 10⁻⁶ per psi. Find Bo 2,000 psi above pb.
Show answer
1.30 exp(−0.02) = 1.274.
Name the four inputs most black-oil correlations need.
Show answer
Solution GOR, separator gas gravity, stock-tank oil gravity and reservoir temperature.
Lesson quiz · 5 questions
Score 60% or more to complete this lesson.
Create a free account to save your progress, take quizzes and earn a certificate.