
MSAZ-342 · Lesson 3 of 12 · 19 min
Time series and parsing
▶ Video coming soon A video version of this lesson is on the way.
By the third session, on Thursday, October 29, Ama could count things. Nadia's next question was harder: is this count normal? The October 28–29 penetration test had just ended, and Defender for Identity had raised alerts for the test team's work. Nadia wanted to know whether the test had left any lasting change in how service accounts behaved, and the only way to tell was to compare each account's recent activity with its own history. That is time series analysis. The second half of the session turned to the other daily chore of hunting: pulling useful fields out of text and JSON that a source has packed into a single column.
From counts to series
A time series is a sequence of values at regular intervals, such as sign-ins per hour for thirty days. KQL builds one with make-series, which is like summarize by bin but with two differences: it fills empty intervals with a default value, usually zero, and it returns each series as an array in one row rather than one row per interval. Arrays are what the series functions work on.
IdentityLogonEvents
| where Timestamp > ago(30d)
| where AccountName startswith "svc-"
| make-series Logons = count() default = 0
    on Timestamp from ago(30d) to now() step 1h
    by AccountName
Filling empty intervals matters. If a service account normally logs on every hour and then stops for six hours, summarize by bin shows six missing rows, which are easy to overlook; make-series shows six zeros in the middle of the array, which anomaly functions and charts both notice.
Finding anomalies
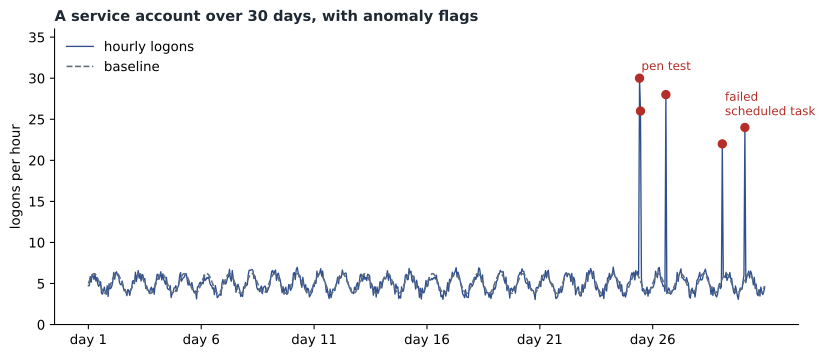
series_decompose_anomalies takes a series and returns, for each point, a flag: 1 for an unusually high value, -1 for an unusually low one and 0 otherwise. It works by splitting the series into a trend, a repeating seasonal pattern, such as the daily cycle of a working week, and a residual, then flagging residuals far from what the rest of the series predicts. A threshold parameter sets how far is far; the default of 1.5 flags quite a lot, and hunters often use 3 for fewer, stronger anomalies.
IdentityLogonEvents
| where Timestamp > ago(30d)
| where AccountName startswith "svc-"
| make-series Logons = count() default = 0
    on Timestamp from ago(30d) to now() step 1h by AccountName
| extend (Flags, Score, Baseline) = series_decompose_anomalies(Logons, 3)
| mv-expand Timestamp to typeof(datetime), Logons to typeof(long),
            Flags to typeof(int), Baseline to typeof(double)
| where Flags == 1
| project AccountName, Timestamp, Logons, Baseline = round(Baseline, 1)
The mv-expand operator turns the arrays back into rows, one per hour, so the result can be filtered and read. The query returned 23 flagged hours across 11 service accounts. Twenty of them fell on October 28 and 29 and belonged to the accounts the penetration testers had been authorized to use, which was expected. Three did not: svc-rpt01, the reporting service account whose weak password the testers had found, showed bursts of logons on November 1 and November 2, after the test had ended. Sunil checked the change log. The reporting team had reset the password on October 30 and had not updated one scheduled task, which then failed and retried every few minutes. It was a fault, not an attack, but it was exactly the kind of after-effect Nadia had been looking for, and without the series it would have been invisible inside the account's normal volume.
# hourly logons for one account: a quiet baseline with two bursts
values = [5, 4, 6, 5, 4, 5, 6, 5, 31, 28, 5, 4, 6, 5, 4, 19, 22, 5, 6, 5]
n = len(values)
med = sorted(values)[n // 2]
# median absolute deviation: a spread measure that ignores the bursts
mad = sorted(abs(v - med) for v in values)[n // 2]
limit = med + 3 * 1.4826 * mad
print("median", med, "MAD", mad, "flag above", round(limit, 1))
for hour, v in enumerate(values):
    if v > limit:
print(f"hour {hour:2d}: {v} logons, flagged")median 5 MAD 1 flag above 9.4 hour 8: 31 logons, flagged hour 9: 28 logons, flagged hour 15: 19 logons, flagged hour 16: 22 logons, flagged
What this code does
Twenty hourly counts stand in for one account's logons. The program finds the middle value and a measure of normal spread that is not pulled up by the bursts, then flags any hour more than three spreads above the middle. Four hours are flagged, the two pairs of bursts, which is the same idea as series_decompose_anomalies with a threshold of 3, without its seasonal and trend parts.
The Python simulation is deliberately simpler than KQL's function, which also removes the daily pattern before looking for outliers. The point Nadia wanted Ama to take from it was that an anomaly score is relative to a baseline the function built from the data itself. If the data already contains the attack, the baseline includes it, which is why hunters use thirty days or more of history and are suspicious of an account with no quiet period at all.
Other series tools
series_fit_line fits a straight line and returns its slope, which finds slow growth, such as a mailbox forwarding a few more messages each day. series_outliers flags points by a similar method without the seasonal decomposition. series_stats returns the minimum, maximum, average and standard deviation of each series in one step. And render timechart draws any of them, which in the clinic usually settled an argument faster than a table.
Comparing rows in order
Some questions compare each event with the one before: how long between a user's sign-in and their first file download, or how far apart two sign-ins were. The serialize operator fixes the order of rows, after which prev() and next() read values from neighbouring rows. datetime_diff then gives the gap in a chosen unit.
EntraIdSignInEvents
| where Timestamp > ago(7d)
| where AccountUpn =~ "rdelgado@harrowfinch.example"
| where ErrorCode == 0
| project Timestamp, Country, City, IPAddress
| sort by Timestamp asc
| serialize
| extend PrevCountry = prev(Country), PrevTime = prev(Timestamp)
| extend MinutesApart = datetime_diff("minute", Timestamp, PrevTime)
| where Country != PrevCountry and isnotempty(PrevCountry)
For Rosa Delgado, the store manager whose account was taken over on November 3, the query showed a sign-in from Selkirk at 09:31 and one from another continent at 09:44, thirteen minutes later. No traveller covers that distance in thirteen minutes. Defender had already flagged it; the query showed Ama how the flag could be reproduced and how to check other users for the same pattern.
Parsing text
Many sources do not split their data neatly into columns. Syslog messages, firewall extensions and custom application logs often arrive as one long string. KQL has three main tools for getting fields out of them.
| Tool | Best for | Example |
|---|---|---|
| parse | Text with a fixed pattern of literal words around the values | parse Message with * "user=" User " src=" SourceIP " " * |
| extract | One value matched by a regular expression | extract(@"src=(\d+\.\d+\.\d+\.\d+)", 1, Message) |
| split | Values separated by one character | split(Path, "\\")[2] |
| parse-kv | Key and value pairs such as key=value; | parse-kv Message as (user:string, action:string) with (pair_delimiter=" ", kv_delimiter="=") |
Harrow & Finch's door access controllers, which Sunil planned to connect in January 2027, sent Syslog lines like 'badge=40311 door=DC-DOCK-2 result=GRANTED'. In the clinic Ama practised on a sample: parse-kv split it into three columns in one step, where parse would have needed the exact order of the keys and broken if the vendor ever changed it. The habit Nadia taught was to parse once in a function or a data collection rule transformation rather than in every query, so that every analyst used the same field names.
Parsing JSON and dynamic columns
Microsoft's own tables store a lot of detail in dynamic columns, which hold JSON objects or arrays. AdditionalFields in advanced hunting tables, the Parameters of an Exchange operation and the TargetResources of an Entra ID audit record are all dynamic. Dot notation and brackets read values directly, parse_json converts a JSON string into a dynamic value, and mv-expand turns an array into one row per element.
CloudAppEvents
| where Timestamp > ago(14d)
| where ActionType == "New-InboxRule"
| extend Params = todynamic(RawEventData).Parameters
| mv-expand Param = Params
| where Param.Name in ("ForwardTo", "RedirectTo", "DeleteMessage", "MoveToFolder")
| project Timestamp, AccountDisplayName, Setting = tostring(Param.Name), Value = tostring(Param.Value)
This query found the rule created in Marek Novak's mailbox on October 20, which moved any message containing the word invoice to the RSS Feeds folder, a known way to hide replies from the victim. MITRE ATT&CK lists it as Email Hiding Rules, a sub-technique of Hide Artifacts. It also found eleven legitimate rules created by staff, which became the baseline for a detection Sunil built later.
Checking a baseline before trusting it
An anomaly is only as good as the baseline it is measured against. Before using series_decompose_anomalies on a new series, Ama learned to check three things. First, length: the function needs enough history to separate trend and seasonality, and two weeks of daily points is too short for a weekly pattern. Second, gaps: make-series fills missing bins with the default value, usually zero, so a day when a connector was down looks like a sudden quiet period, and the day after looks like a spike. The data collection health workbook from MSAZ-341 shows when a table went silent, and a hunter should look before calling a dip suspicious. Third, known events: a store opening, a holiday weekend or a password reset like the one for svc-rpt01 on October 30 can move a series for reasons nobody needs to investigate. Ama kept a short list of such events beside each baseline query, with dates, so that the next hunter reading an anomaly could rule them out in a minute instead of an afternoon.
Parsing has a similar check. Before relying on a parse or extract pattern across a month of data, run it with a count of rows where the new column is empty. If even a small share of rows fail to parse, the format has variants, and those rows may be exactly the unusual ones a hunter wants. Nadia's rule was that a parse is finished when the empty count is zero or every remaining empty row has been read and explained.
Worked problem
Building a baseline query
Nadia asks: did any mailbox forward more external messages last week than in its previous four weeks? EmailEvents has one row per message with a direction column and a sender. How should Ama approach it?
Show solution
- Filter EmailEvents to outbound messages from internal senders to external recipients, the last 35 days.
- make-series Messages = count() default = 0 on Timestamp step 1d by SenderFromAddress gives each mailbox a daily series.
- Split each series: the first 28 days are the baseline and the last 7 are the period of interest. series_stats on the baseline part gives an average and a standard deviation.
- Flag mailboxes whose average over the last 7 days is more than the baseline average plus three standard deviations, and that sent at least 20 messages, to ignore mailboxes with tiny counts.
- Review the flagged list manually: a new project, a holiday or a newly hired buyer explains most rises, and the rest are worth a closer look.
Answer: Build a daily series per mailbox, compare the last week with the four weeks before using series statistics and a minimum volume, then review the short list by hand.
Common mistakes
MistakeUse summarize by bin for anomaly detection.
InsteadUse make-series, which fills empty intervals with zeros so gaps are visible.
MistakeTrust an anomaly score on a short history.
InsteadUse thirty days or more so the baseline has a quiet period.
MistakeParse the same text differently in every query.
InsteadParse once in a function or a transformation and reuse the fields.
MistakeUse parse for key and value text whose order may change.
InsteadUse parse-kv, which does not depend on the order of the keys.
Summary and key terms
- make-series builds regular time series and fills empty intervals with a default value.
- series_decompose_anomalies separates trend, seasonality and residual, and flags points with 1, -1 or 0; a threshold of 3 gives fewer, stronger anomalies.
- mv-expand turns arrays back into rows for filtering.
- serialize with prev() and next() compares each row with its neighbours; datetime_diff measures the gap.
- parse, extract, split and parse-kv pull fields out of text; dynamic columns are read with dot notation, parse_json and mv-expand.
- make-series
- A KQL operator that builds time series arrays with regular steps and default values for gaps.
- series_decompose_anomalies()
- A function that flags points in a series that depart from its trend and seasonal pattern.
- mv-expand
- An operator that turns each element of an array or bag into its own row.
- serialize
- An operator that fixes row order so prev() and next() can be used.
- parse-kv
- An operator that extracts key and value pairs from text.
- Dynamic column
- A column that holds JSON objects or arrays.
Practice problems
Work each problem on paper first, then reveal the answer to check.
Why did svc-rpt01 show anomalies after the test ended?
Show answer
A scheduled task kept using the old password after a reset and retried every few minutes.
What do the values 1, -1 and 0 mean in the anomaly output?
Show answer
Unusually high, unusually low, and normal.
Which operator is safest for key=value text whose order may change?
Show answer
parse-kv.
What did the inbox rule query find in Marek Novak's mailbox?
Show answer
A rule moving messages containing invoice to the RSS Feeds folder, a way of hiding replies.
Lesson quiz · 5 questions
Score 60% or more to complete this lesson.
Create a free account to save your progress, take quizzes and earn a certificate.