
MSAZ-341 · Lesson 12 of 12 · 20 min
Workbooks and reporting
▶ Video coming soon A video version of this lesson is on the way.
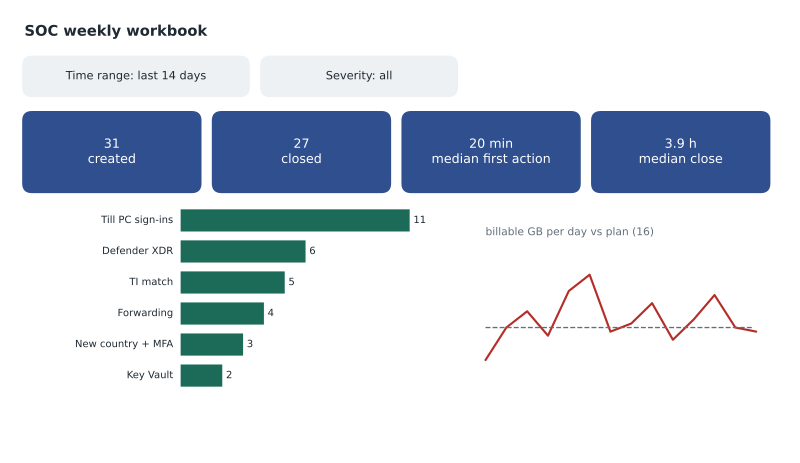
On the morning of Friday, November 13, the day after the sprint ended, Nadia had a meeting with Sunil's manager and the chief financial officer about the Sentinel budget. She wanted to show three things: that the data was arriving, that the rules were finding real problems, and that the SOC was getting faster at handling them. None of that is visible in an incident queue. It needs reports, and in Sentinel reports are mostly built with workbooks. Ama spent the last hour of the sprint on November 12 building the workbook Nadia took to the meeting.
What workbooks are
Sentinel workbooks are Azure Monitor workbooks connected to the security workspace. A workbook is an interactive report made of steps: text, parameters such as a time range or a store, KQL queries, and visualizations of their results as tables, charts, tiles, maps or grids. Because every step is a query against the workspace, a workbook is always current, and an analyst can change the time range or filter and see the effect immediately. Workbooks are Azure resources saved in a resource group, so Sunil kept the SOC's in rg-secops-prod-cc with everything else.
Most content hub solutions include workbook templates, and installing a solution makes them available in the workbooks gallery. A template becomes a saved workbook when you save a copy, which you can then edit; saved copies are not updated when the template changes. Creating or editing a workbook needs the Workbook Contributor role, or Sentinel Contributor with it, as lesson 2 described; viewing one needs only Sentinel Reader. In the Defender portal, workbooks are found under Microsoft Sentinel in the navigation.
| Workbook | Source | Used for |
|---|---|---|
| Data collection health | Template from the Sentinel health content | Which connectors and tables are receiving data |
| Microsoft Entra ID sign-ins | Template from the Entra ID solution | Sign-in failures, locations and multifactor authentication use |
| Firewall overview | Template from the firewall vendor's solution | Top blocked sources and destinations by store |
| SOC weekly | Built by Ama | Incident volume, sources, outcomes and response times |
| Cost and usage | Built by Sunil | Billable volume by table against the plan |
Measuring the SOC
The workbook Nadia needed most was the one nobody else provides: how the SOC itself is doing. The SecurityIncident table holds a record for every incident and every change to it, including when it was created, when it was first assigned or modified, when it was closed, its severity, its classification and the analytics rules that produced its alerts. From it you can calculate the two measures SOCs most often report. Mean time to acknowledge (MTTA) is the average time from an incident being created to someone starting work on it. Mean time to resolve (MTTR) is the average time from creation to closure. Both are better shown with medians as well, because one long incident can distort an average.
SecurityIncident
| where TimeGenerated > ago(14d)
| summarize arg_max(TimeGenerated, *) by IncidentNumber
| where Status == "Closed"
| extend MinutesToAck = datetime_diff("minute", FirstModifiedTime, CreatedTime),
         HoursToClose = datetime_diff("minute", ClosedTime, CreatedTime) / 60.0
| summarize Incidents = count(), MedianAckMinutes = percentile(MinutesToAck, 50),
            MedianCloseHours = percentile(HoursToClose, 50) by Severity, Classification
The arg_max step is the detail that catches people. SecurityIncident is written every time an incident changes, so a simple count counts changes, not incidents. Keeping only the latest record per incident number fixes that. Microsoft also notes that after a workspace is connected to the Defender portal, SecurityIncident no longer contains the Description field, so reports that relied on it need another source for that text.
from statistics import mean, median
# minutes to first action and hours to close for the incidents closed in the sprint
incidents = [
    ("High", 6, 1.5), ("High", 9, 2.2), ("Medium", 14, 3.0), ("Medium", 18, 4.1),
    ("Medium", 25, 3.8), ("Medium", 31, 5.6), ("Low", 40, 6.0), ("Low", 55, 26.0),
    ("Medium", 22, 3.9), ("High", 11, 2.0),
]
ack = [a for _, a, _ in incidents]
close = [c for _, _, c in incidents]
print(f"Incidents: {len(incidents)}")
print(f"Time to first action: mean {mean(ack):.1f} min, median {median(ack):.1f} min")
print(f"Time to close:        mean {mean(close):.2f} h,  median {median(close):.2f} h")
for sev in ("High", "Medium", "Low"):
    c = [h for s, _, h in incidents if s == sev]
print(f" {sev:<6} {len(c)} incidents, median close {median(c):.1f} h")Incidents: 10 Time to first action: mean 23.1 min, median 20.0 min Time to close: mean 5.81 h, median 3.85 h High 3 incidents, median close 2.0 h Medium 5 incidents, median close 3.9 h Low 2 incidents, median close 16.0 h
What this code does
The program lists ten closed incidents with their severity, the minutes until someone first acted and the hours until closure. It calculates the mean and the median of each measure, then the median time to close for each severity. The output shows a mean time to close of almost six hours but a median under four, because one low-severity incident stayed open for a day while the team waited for a vendor; the median gives the truer picture of a typical incident, which is why the workbook shows both.
High-severity incidents had the shortest times, which was what Nadia wanted to show: the queue was being worked in the right order. The one slow incident, the reporting vendor's new location from lesson 9, had waited a day for the vendor to reply, which Ama labelled in the workbook so nobody would read it as a slow analyst.
Showing that rules earn their keep
Nadia's second point for the meeting was that the rules were finding real problems. The workbook showed, for each analytics rule, how many incidents it had produced and how they were classified when closed: true positive, benign positive (real activity that was allowed, such as the penetration test) or false positive. A rule with many incidents and nearly all false positives is a tuning task; a rule with no incidents at all may be fine, or may be watching data that never arrives. Over the two weeks the till PC rule had produced the most incidents, almost all from the expired service account password, which the automation rule in lesson 10 now closed automatically, while the new-country-then-MFA-change rule had found one true positive, a contractor's account signing in from a phishing kit's hosting address, contained the same day.
The Defender portal also offers SOC optimization, a set of recommendations Microsoft generates from your own workspace: tables you ingest but never query, threats for which you have the data but no detections, and similar suggestions about coverage and value. Ama added its recommendations as a link on the workbook's last page, because they answer the CFO's likely question about whether the company was paying for data it did not use.
Reporting outside the SOC
Not everyone who needs security reports should open the Defender portal. For the executive team, Nadia planned a one-page monthly summary: incidents by severity and outcome, median response times, the largest risks found and fixed, and cost against budget. The figures come from the workbook's queries, exported each month, rather than from a separate data pipeline. A Power BI report connected to the workspace was considered and postponed: it would be useful once the Finch Data Hub described in other courses existed, but for one page a month it was more machinery than the SOC needed.
For auditors, the evidence is different. They want to see that the controls work: that data has been collected continuously, that rules ran, that incidents were handled according to the procedure. The data collection health workbook, the SentinelHealth table and the SecurityIncident history together show that, and the two-year retention for incidents and alerts set in lesson 5 means the evidence will still exist when the auditors ask.
The sprint in review
At the end of the session Ama wrote a one-page review of the sprint for the design record. It listed what was built and what was planned, using the same distinction the whole course has used: what had been done by November 13, and what would happen later.
| Done by November 13 | Planned |
|---|---|
| Security workspace in the primary region, connected to the Defender portal | Sentinel data lake onboarding and retention settings, December 7, 2026 |
| Roles assigned with PIM; table-level access for store support | Retainer firm guest access, only if the retainer is invoked |
| Connectors for Defender XDR, Entra ID, Office 365, Azure activity, Key Vault, firewalls and Windows | HR and payroll connector, January 2027 |
| Windows Event Forwarding for till PCs through one collector | Second collector, spring 2027 |
| Five analytics rules, threat intelligence matching and UEBA | UEBA review before any automation uses its scores, mid-December 2026 |
| Six automation rules and two playbooks | Firewall block playbook design, and sharing indicators with the community, January 2027 |
| Five workbooks, including SOC weekly and cost | Monthly executive summary from December 2026 |
Designing a workbook people will read
A workbook that tries to show everything shows nothing. Ama followed a few rules Nadia gave her. Put the answer at the top: the four tiles say in a glance whether the week was normal. Use parameters so one workbook serves several audiences, such as a store filter for the regional managers and a severity filter for the SOC. Label anything that needs explaining in the workbook itself, as she did with the slow vendor incident. And show the trend, not just the total: a line of incidents per day over 14 days says more than a single count.
Workbook queries run every time someone opens or refreshes the workbook, and against the data lake they would be billed per data scanned. The SOC weekly workbook queries only the analytics tier and only 14 days, so it is quick and costs nothing extra; Sunil noted that any future workbook reading lake data should use a scheduled KQL job to summarize the data first and query the summary instead.
Worked problem
Answering the budget question
At the meeting the CFO asked: "If we cut the Sentinel budget by a third, what do we lose?" Billable analytics ingestion is about 16 GB a day, of which non-interactive sign-ins are 1.6 GB, Defender for Endpoint raw tables 6.5 GB, server security events 3.2 GB and firewalls 4.0 GB. Using the cost workbook and the earlier lessons, how could Nadia answer?
Show solution
- A third of 16.1 GB a day is about 5.4 GB a day that would have to go from the analytics tier.
- The largest candidates are the Defender for Endpoint raw tables (6.5 GB) and the firewalls (4.0 GB).
- Removing the Defender raw tables from the analytics tier would cut about 40 in every 100 billable gigabytes, but device evidence older than about 30 days would then exist only if kept in the lake, and Sentinel rules on those tables would stop.
- Moving firewall logs to the lake only would save less, about a quarter, but the threat intelligence matching rule on firewall traffic from lesson 8 would stop working, because rules need the analytics tier.
- A better answer is a menu: trim the AdditionalExtensions column and the computer-account logons already identified (lessons 4 and 5), then decide on one large table, with the detection lost stated plainly for each option.
Answer: Nadia could show that a one-third cut means removing one of the two largest sources from the analytics tier, name exactly which detections and how much evidence each choice would lose, and offer the low-risk savings first.
The CFO took the menu. The budget stayed as planned, with the two low-risk savings to be applied in December and reported in the January cost review. Ama noted that the most useful thing in the meeting had not been any single chart, but being able to say, for every gigabyte, what it was for.
Common mistakes
MistakeCount rows in SecurityIncident to count incidents.
InsteadEach incident has a record per change; keep the latest with arg_max by IncidentNumber.
MistakeReport only averages for response times.
InsteadShow medians too, because one long incident distorts the mean.
MistakeEdit a workbook template directly.
InsteadSave a copy and edit that; saved copies do not change when templates are updated.
MistakeGive executives access to the Defender portal for reports.
InsteadGive them a summary built from workbook queries; keep portal access to SOC roles.
Summary and key terms
- Sentinel workbooks are Azure Monitor workbooks built from parameters, KQL queries and visualizations.
- Content hub solutions provide workbook templates; save a copy to customize it.
- Viewing needs Sentinel Reader; editing needs Workbook Contributor.
- SecurityIncident supports SOC measures such as time to acknowledge and time to resolve; use the latest record per incident.
- Show medians as well as means, and classifications per rule to judge rule value.
- SOC optimization recommends where data is unused or coverage is missing.
- Report to executives and auditors from the same queries, with evidence kept for the retention period.
- Workbook
- An interactive report of parameters, queries and visualizations over the workspace.
- Workbook template
- A workbook supplied by a solution, which you save as a copy to customize.
- MTTA
- Mean time to acknowledge: the average time from an incident's creation to the first action on it.
- MTTR
- Mean time to resolve: the average time from an incident's creation to its closure.
- Benign positive
- A classification for real activity that was correctly detected but allowed, such as a penetration test.
- SOC optimization
- Defender portal recommendations about data value and detection coverage.
Practice problems
Work each problem on paper first, then reveal the answer to check.
Why does the SOC query use arg_max by IncidentNumber?
Show answer
SecurityIncident has a record per change, so the latest record per incident is needed.
Why did the workbook show medians?
Show answer
One long incident made the mean time to close misleading.
What role is needed to edit a workbook?
Show answer
Workbook Contributor.
What does SOC optimization help answer?
Show answer
Whether the company ingests data it never uses and where detection coverage is missing.
What would moving firewall logs to the lake only have broken?
Show answer
The threat intelligence matching rule on firewall traffic.
Lesson quiz · 5 questions
Score 60% or more to complete this lesson.
Create a free account to save your progress, take quizzes and earn a certificate.