
MSAZ-310 · Lesson 11 of 12 · 22 min
Monitoring capacity and usage
▶ Video coming soon A video version of this lesson is on the way.
On the afternoon of Thursday, November 5, two store managers testing reports on the trial capacity complained that pages were taking twenty seconds to open. Nothing had changed in the reports. Nikolai found the cause within ten minutes: Ines had started a Spark notebook that reprocessed three years of sales history in one go, while Keiko was running repeated full refreshes of the test semantic model for a load test. Together they had consumed so much capacity that Fabric was deliberately slowing down new interactive requests. The eleventh hub session, on the morning of Wednesday, November 11, used that afternoon to explain how Fabric meters compute, how it protects itself when a capacity is overloaded, and how to see it all in the monitoring tools.
Every operation costs capacity units
As lesson 2 described, a capacity provides a fixed number of capacity units each second: an F16 provides 16 CU-seconds every second. Every Fabric operation consumes CU-seconds. Fabric classifies operations into two kinds. Interactive operations are triggered by a person and expected to respond quickly, such as a report query or a SQL query run from the editor. Background operations run without someone waiting on screen, such as a semantic model refresh, a data pipeline, a scheduled notebook or a warehouse load. The distinction matters because Fabric treats the two differently when it spreads out their cost.
Bursting and smoothing
An operation is allowed to use more compute than the capacity's size while it runs; that is bursting, and it lets a small capacity finish a large job quickly instead of crawling through it. The cost is then spread forward in time, which is smoothing. Fabric accounts for usage in 30-second timepoints, 2,880 of them in a day. An interactive operation's cost is smoothed over at least 5 minutes and up to 64 minutes, depending on how much it consumed. A background operation's cost is smoothed over 24 hours. So a refresh that used 172,800 CU-seconds in ten minutes is counted, after smoothing, as 2 CU of continuous use for the next day, a small share of an F16.
# Smoothed load from a background job: its CU-seconds spread over 24 hours
def smoothed_cu(cu_seconds, window_hours):
    return cu_seconds / (window_hours * 3600)

jobs = {"nightly load": 410_000, "model refresh": 172_800, "history backfill": 2_900_000}
capacity = 16
for name, cus in jobs.items():
    cu = smoothed_cu(cus, 24)
print(f"{name:17} {cu:5.2f} CU for a day, {cu / capacity * 100:3.0f} in 100 of an F16")nightly load 4.75 CU for a day, 30 in 100 of an F16 model refresh 2.00 CU for a day, 12 in 100 of an F16 history backfill 33.56 CU for a day, 210 in 100 of an F16
What this code does
The program divides each job's total CU-seconds by the number of seconds in 24 hours, which is the window Fabric spreads background work over, to get the continuous capacity units the job takes up for that day. It then compares that with the 16 units of an F16. The output shows that the nightly load and the refresh take small shares, while the history backfill alone takes up more than twice the whole capacity.
The backfill explained most of the incident. Its 2.9 million CU-seconds, smoothed over a day, came to about 33.6 CU, about half of the trial's 64 CU. On top of the morning's other work and Keiko's back-to-back refreshes, that was enough to push the trial past its limit for part of the afternoon, even though the backfill itself had finished within an hour. On the F16 planned for the pilot, the same backfill would by itself need more than twice the whole capacity, which is why the team took the incident seriously even though the trial recovered.
Throttling
When smoothed usage exceeds the capacity, Fabric does not fail jobs immediately. It measures how far into the future the capacity has been used up, and applies throttling in stages.
| Future capacity already consumed | Stage | Effect |
|---|---|---|
| Up to 10 minutes | Overage protection | No throttling |
| 10 to 60 minutes | Interactive delay | New interactive operations are delayed by 20 seconds |
| 60 minutes to 24 hours | Interactive rejection | New interactive operations are rejected; background operations still run |
| More than 24 hours | Background rejection | All new operations are rejected |
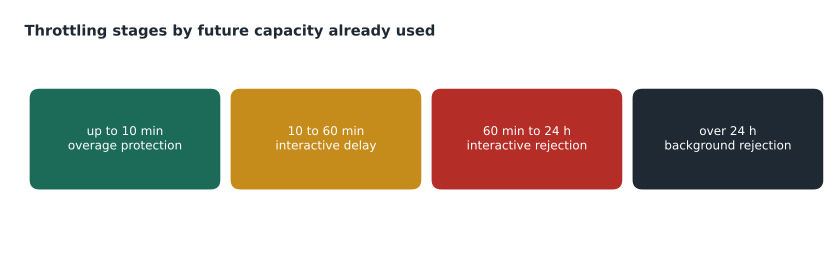
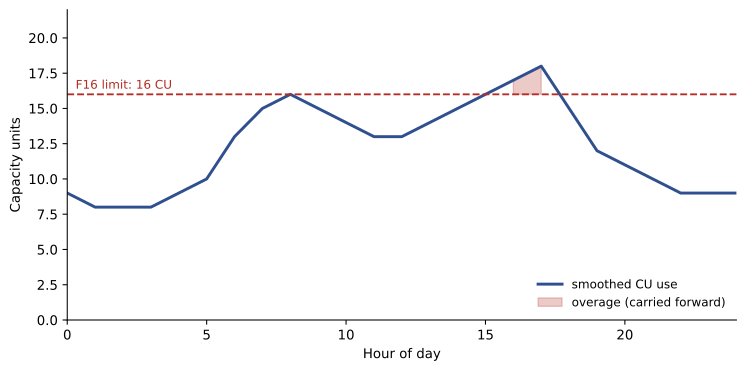
Usage above the capacity, after the 10-minute protection, is carried forward as a debt. Each later timepoint in which the capacity is not fully used pays some of it off, which is called burndown. Throttling continues until the carried-forward debt is gone. On November 5 the trial capacity sat in the interactive delay stage for about forty minutes, which is exactly what the store managers felt as twenty-second waits. It never reached rejection, because the trial is an F64-sized capacity and the backfill, large as it was, consumed less than an hour of its future capacity.
Worked problem
Which stage?
On an F16, a sequence of jobs leaves 1,400,000 CU-seconds of carried-forward overage. The capacity's other work uses 10 CU on average, leaving 6 CU a second for burndown. How many minutes of future capacity have been consumed, and which stage applies? How long until the debt is paid off if usage stays the same?
Show solution
- One minute of an F16 is 16 × 60 = 960 CU-seconds.
- \[\frac{1\,400\,000}{960} \approx 1458 \text{ minutes} \approx 24.3 \text{ hours}\]
- More than 24 hours of future capacity is consumed, so the capacity is in the background rejection stage: all new operations are rejected.
- Burndown runs at 6 CU-seconds per second, which is 21,600 an hour.
- \[\frac{1\,400\,000}{21\,600} \approx 64.8 \text{ hours}\]
Answer: About 24 hours ahead, so background rejection; at 6 spare CU a second it takes about 65 hours to burn down, unless the capacity is scaled up.
The example shows why a severe overload is best fixed by scaling up temporarily. Doubling the capacity to an F32 would leave 22 CU a second spare instead of 6, and burn the debt down in under 18 hours. Pausing a capacity also settles its carried-forward usage, which is then billed at once, so pausing is a way to pay the debt immediately rather than to avoid it.
The Fabric Capacity Metrics app
The main tool for watching a capacity is the Microsoft Fabric Capacity Metrics app, a Power BI app that capacity admins install from the app marketplace and connect to their capacities. It shows consumption by item and by operation, interactive against background usage, smoothed usage against the capacity's limit over time, and throttling and overage. Drilling into a timepoint shows which operations contributed to it, by whom, and in which workspace. Nikolai installed it on October 22, and after the November 5 incident its timepoint view named the backfill notebook, its user and its cost within minutes.
| Tool | Who uses it | What it shows |
|---|---|---|
| Capacity Metrics app | Capacity admins | CU consumption, smoothing, throttling and overage per item and operation |
| Monitoring hub | Anyone, for items they can see | Status, duration and history of pipeline runs, notebook runs, refreshes and other activities |
| Workspace monitoring | Workspace admins | Detailed logs and metrics for a workspace, collected in an eventhouse for KQL queries |
| Admin monitoring workspace | Fabric administrators | Tenant-wide reports on activity, adoption and content |
| Warehouse query insights | Warehouse users | Completed queries, durations and costs, as in lesson 6 |
Monitoring hub and workspace monitoring
The monitoring hub, opened from the Fabric navigation, lists recent activities across the items a person can see: data pipeline runs, notebook and Spark job runs, semantic model refreshes, dataflow refreshes and more, with their status, start time, duration and submitter. It is the first place an engineer looks when a nightly load fails. Workspace monitoring goes deeper: when a workspace admin turns it on, Fabric collects logs and metrics from the workspace's items into an eventhouse in that workspace, where they can be queried with KQL and kept for longer, for example to chart semantic model query durations over a month. Workspace monitoring stores its data on the capacity, so it costs capacity units and storage like any other eventhouse.
// KQL against workspace monitoring: slowest semantic model queries this week
SemanticModelLogs
| where Timestamp > ago(7d) and OperationName == "QueryEnd"
| summarize p95_ms = percentile(DurationMs, 95), queries = count() by ItemName
| order by p95_ms desc
Settings that help
A few capacity settings help avoid repeat incidents. Capacity admins can be notified by email when consumption crosses a threshold they choose, so a busy afternoon is noticed before users complain. Surge protection, where available, lets an admin set a limit on background consumption so that background jobs are rejected before they push interactive work into throttling. Spark workloads can also be configured to run on separate pay-as-you-go billing for Spark, so large Spark jobs do not draw on the shared capacity at all. Each has trade-offs, and the current options should be checked in the capacity settings, because they have changed several times since Fabric launched.
The hub's changes after November 5 were mostly about habits. Large backfills run at night and in slices, one year at a time, instead of all at once. Development and production will be on separate capacities once production reports are in daily use, as lesson 2 suggested. Nikolai set a notification at 80 in 100 of capacity, and Ines reviews the Capacity Metrics app every Monday morning, looking for the five most expensive operations of the previous week.
Who watches what
Monitoring works when each tool has an owner. In the hub, Ines owns the monitoring hub: she checks every morning that the nightly pipelines and refreshes succeeded and reruns anything that failed. Nikolai, as capacity admin, owns the Capacity Metrics app and the consumption notification, and decides when a capacity needs resizing. Keiko owns the reporting side through query insights and the semantic model's refresh history. Renata, as Fabric administrator, owns the admin monitoring workspace and the tenant-wide view. Writing those owners down took five minutes on November 11 and removed the most common monitoring failure, which is everyone assuming someone else is watching.
Reading the numbers well
Two habits make monitoring more useful. The first is to compare like with like. A report that feels slow on Monday at 7 a.m. should be compared with Monday at 7 a.m. the week before, not with a quiet Sunday, because store managers' morning checks are the hub's busiest period. The Capacity Metrics app keeps several weeks of history, which is enough to see weekly patterns and to notice when a new item adds a steady cost.
The second is to look for the cause, not just the peak. A capacity that is often near its limit may have one expensive item, such as a semantic model refreshing every half hour when once a day would do, or many small ones. The app's breakdown by item and operation answers that in minutes, and the fix for one expensive item, such as a cheaper refresh schedule, is usually far cheaper than a bigger capacity. Keiko found one such item on November 11 itself: a test report with a visual that queried the full sales table on every page load. Replacing it with an aggregated table cut the report's consumption by about four fifths.
Common mistakes
MistakeA background job that runs for ten minutes only affects the capacity for ten minutes.
InsteadBackground usage is smoothed over 24 hours, so its cost is counted for the next day.
MistakeThrottling rejects jobs as soon as a capacity is over its limit.
InsteadThe first 10 minutes of future use are protected; delays and rejections come only as overage grows.
MistakeInteractive rejection also stops scheduled refreshes.
InsteadIn interactive rejection, background operations still run; only background rejection stops them.
MistakeThe monitoring hub shows capacity unit consumption.
InsteadThe monitoring hub shows activity status and duration; the Capacity Metrics app shows consumption and throttling.
Summary and key terms
- Operations are interactive or background and consume CU-seconds.
- Bursting lets operations exceed the capacity briefly; smoothing spreads interactive cost over 5 to 64 minutes and background cost over 24 hours.
- Throttling stages are overage protection, interactive delay, interactive rejection and background rejection, by minutes of future capacity used.
- Overage is carried forward and burned down by spare capacity; scaling up clears it faster.
- The Capacity Metrics app shows consumption and throttling; the monitoring hub shows activity runs; workspace monitoring collects logs into an eventhouse.
- Notifications, surge protection, separate Spark billing and better scheduling reduce incidents.
- Interactive operation
- An operation triggered by a person waiting for a result, such as a report query.
- Background operation
- An operation run without a person waiting, such as a refresh or pipeline.
- Bursting
- Using more compute than the capacity size while an operation runs.
- Smoothing
- Spreading an operation's cost over future time: 5 to 64 minutes for interactive, 24 hours for background.
- Throttling
- Delaying or rejecting new operations when too much future capacity has been consumed.
- Carryforward and burndown
- Overage owed to later timepoints, and its repayment from unused capacity.
- Capacity Metrics app
- The Power BI app capacity admins use to monitor consumption and throttling.
Practice problems
Work each problem on paper first, then reveal the answer to check.
Over what period is background usage smoothed?
Show answer
24 hours.
What happens in the interactive delay stage?
Show answer
New interactive operations are delayed by 20 seconds.
At what level of future consumption are background operations rejected?
Show answer
More than 24 hours.
Which tool shows whether last night's pipeline run failed?
Show answer
The monitoring hub.
Where does workspace monitoring store its data?
Show answer
In an eventhouse in the workspace, queried with KQL.
Why does scaling up clear carried-forward overage faster?
Show answer
A larger capacity leaves more unused capacity in each timepoint, so burndown is faster.
What was the hub's main change in habits after the November 5 incident?
Show answer
Large backfills now run at night and in slices, and consumption above 80 in 100 triggers a notification.
Lesson quiz · 5 questions
Score 60% or more to complete this lesson.
Create a free account to save your progress, take quizzes and earn a certificate.