
MSAZ-282 · Lesson 3 of 12 · 20 min
Alerts and notifications
▶ Video coming soon A video version of this lesson is on the way.
Walt has a rule he learned the hard way: a job nobody watches is a job that has already failed, you just don't know it yet. In 2019 the StockLine log backup job stopped running for nine days because its owner's account was disabled, and nobody noticed until the log file filled the disk. Automation without alerting only moves the failure somewhere quieter. This lesson covers how Azure tells people that something needs attention: the alert rules that watch metrics, logs and the activity log, the action groups that decide who hears about it and how, and the SQL Server Agent alerts that still have a place inside managed instances and virtual machines. MSAZ-281 covers which performance signals to watch; here the subject is the plumbing that turns a signal into a notification, especially for the automated tasks built in lessons 1 and 2.
The parts of an Azure Monitor alert
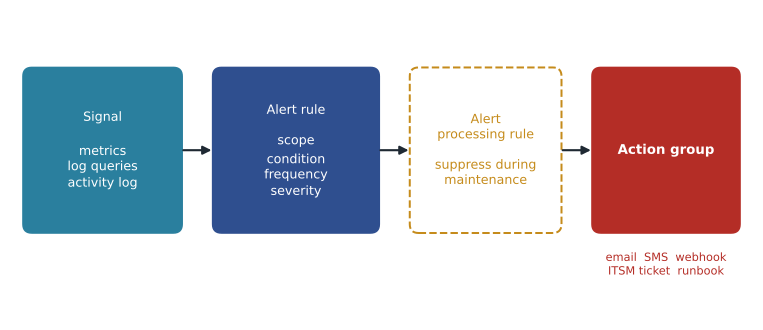
An Azure Monitor alert has three parts. The scope is the resource or resources being watched, such as one managed instance, every database on a logical server, or a Log Analytics workspace. The condition is the signal and the test applied to it: average CPU above 85 for 15 minutes, any failed elastic job in the last hour, a delete operation on a database. The actions are carried out by one or more action groups when the condition is met. Each alert rule also has a severity, from 0 (critical) to 4 (verbose), which is a label that teams use to decide how urgently to respond, and a setting for whether the alert resolves itself automatically when the condition clears.
Kinds of alert rules
Metric alerts test a numeric metric that Azure collects for the resource, such as CPU percentage, storage used, deadlocks, failed connections or, for geo-replicated databases, the replication lag. They evaluate quickly, usually every minute, and can watch many databases of the same type with one rule. Log search alerts run a Kusto query against data sent to a Log Analytics workspace, such as diagnostic logs, Automation job logs or elastic job results copied there, and fire when the query returns rows or a count passes a threshold. Activity log alerts fire on control-plane events, such as someone deleting a database, a failover group failover starting, or a service health notice about an Azure region. Each kind answers a different question, and a good alert design for a database estate uses all three.
| Kind of rule | Watches | Harrow & Finch example |
|---|---|---|
| Metric alert | A numeric metric of a resource | StockLine instance storage above 85 in every 100 of the reserved size |
| Metric alert (multi-resource) | The same metric across many databases | Any store scheduling database with deadlocks in the last 15 minutes |
| Log search alert | A KQL query over a workspace | Any Automation runbook job that ended in Failed or Suspended |
| Log search alert | A KQL query over a workspace | Fewer than 23 successful elastic job rows for the nightly purge |
| Activity log alert | Control-plane operations | Any database or server deleted in a production resource group |
| Service health alert | Azure incidents and planned maintenance | A health incident affecting Azure SQL in Canada Central |
The elastic job example is worth a second look, because it catches a failure the other rules cannot. If the purge job itself fails, the error is visible. But if the agent loses permission to enumerate the pool, it might run against no databases at all and report success. Walt's rule instead counts the successful target rows each night and alerts when the count is below the number of stores. This is the difference between alerting on errors and alerting on missing success, and missing-success rules are what would have caught the 2019 backup failure.
// Log search alert: runbook jobs that did not succeed in the last hour
AzureDiagnostics
| where ResourceProvider == "MICROSOFT.AUTOMATION" and Category == "JobLogs"
| where ResultType in ("Failed", "Suspended", "Stopped")
| project TimeGenerated, RunbookName_s, ResultType, JobId_g
How often a rule checks, and over what window
Two settings decide how quickly an alert fires and how noisy it is. The evaluation frequency is how often the rule checks. The lookback period, or window, is how much data each check considers. A CPU rule that checks every minute and averages the last 15 minutes will not fire on a ten-second spike, but will fire within a few minutes of a sustained problem. Some metric alerts can also require several failing periods in a row before firing. Shorter windows react faster and raise more false alarms; longer windows are calmer and slower. Log search alerts usually run every 5 to 15 minutes, and each evaluation adds a small cost, so a rule that runs every minute across a busy workspace is rarely justified.
Worked problem
How many checks, and how fast does it fire?
Walt's storage rule for the StockLine instance checks every 5 minutes and looks at the average storage used over the last 30 minutes, with a threshold of 85 in every 100 of reserved storage. Storage jumps from 80 to 90 at 01:00 and stays there because of an unexpected bulk import. How many evaluations does the rule make in a day, and roughly when will the average first cross 85?
Show solution
- Evaluations per day: 24 hours × 60 minutes ÷ 5 = 288.
- From 01:00, each 30-minute window contains some minutes at 80 and some at 90.
- The average crosses 85 when more than half of the window is at 90, which is after 15 minutes: at about 01:15.
- The next evaluation after 01:15 runs at 01:20 at the latest, so the alert fires at about 01:15 to 01:20.
Answer: The rule runs 288 times a day and fires about 15 to 20 minutes after the jump, which is acceptable for storage, where the danger builds over hours.
Action groups
An action group is a reusable list of things to do when an alert fires. Its notifications send email, SMS, a voice call or an Azure mobile app push, and its actions can call a webhook, open a ticket in an IT service management tool, run an Automation runbook, call an Azure Function or start a Logic App. Because many rules share one action group, changing who is on call means editing one action group rather than forty rules. Walt creates three: ag-dba-urgent, which texts and calls the on-call DBA and posts to the DBA channel in Teams; ag-dba-daytime, which only emails the team mailbox; and ag-dba-selfheal, which runs a runbook before telling anyone. Alerts with severity 0 or 1 go to the urgent group, the rest to the daytime group.
Self-healing deserves caution. A runbook that raises the storage limit when storage crosses 85 sounds sensible, and for a General Purpose managed instance it is, because more storage is a safe, quick change. A runbook that adds vCores when CPU is high is riskier: it hides query problems, adds cost and, on Managed Instance, starts a long operation at the worst moment. Walt allows self-healing only for changes that are safe, cheap and quick to reverse, and every self-heal action still posts a message so a person reviews it the next morning.
Alert processing rules and maintenance
Planned work creates alerts nobody needs. When Walt runs the scale-up in May, the instance's failover at the end will drop connections and might trip a failed-connections rule. Alert processing rules handle this. They sit between alert rules and action groups and can suppress notifications for a scope and a time window, or add an action group to every alert in a scope. Walt adds one that suppresses notifications for the StockLine resource group during each planned maintenance window, so the alerts are still recorded and can be reviewed, but nobody's phone rings for a change they scheduled.
SQL Server Agent alerts and notifications
Inside the engine, SQL Server Agent has its own alert system, which still matters on Managed Instance and virtual machines. An Agent alert fires on an error number, a severity level or a performance condition, and can notify operators by email through Database Mail or run a job in response. The classic set, which Walt has added to every server he has built, covers severities 17 to 25 (resource problems, fatal errors and hardware faults) and errors 823, 824 and 825, which report input-output problems and possible corruption. On Managed Instance, error 825 and the severity alerts are still useful, although storage faults are Microsoft's to repair; on a virtual machine, they may be the first sign of a failing disk.
USE msdb;
EXEC dbo.sp_add_operator @name = N'DBA on call', @email_address = N'dba-oncall@harrowfinch.example';
EXEC dbo.sp_add_alert @name = N'Error 825 - read retry', @message_id = 825,
     @delay_between_responses = 300, @include_event_description_in = 1;
EXEC dbo.sp_add_notification @alert_name = N'Error 825 - read retry',
     @operator_name = N'DBA on call', @notification_method = 1;   -- 1 = email

-- Database Mail must be set up first: an account, a profile, and Agent told to use the profile.
EXEC msdb.dbo.sysmail_add_profile_sp @profile_name = N'AzureManagedInstance_dbmail_profile';
Managed Instance has one quirk here. Agent uses the Database Mail profile named AzureManagedInstance_dbmail_profile for its notifications, so that is the profile name Walt must create, with an SMTP account pointing to the company's mail relay or an Azure Communication Services email endpoint. Job notifications in lesson 1 used the same path. The delay between responses stops one recurring error from sending hundreds of emails.
Notifications for automated tasks
Each automation tool has its own way of reporting. Agent jobs notify operators on failure, success or completion. Elastic jobs have no built-in notification, so failures are found by querying jobs.job_executions, either by a step at the end of the job that raises an error if any target failed, or by a log search alert over results exported to a workspace. Automation runbooks send job logs to Log Analytics when diagnostic settings are enabled, and log search alerts watch them. Deployment pipelines notify through the pipeline tool and the activity log. Walt draws the whole map on one page, because the question the auditors ask is simple: for each automated task, how would you know it did not run?
| Automated task | Tool | How a failure is noticed |
|---|---|---|
| StockLine nightly statistics | Agent on Managed Instance | Job notification to DBA on call; daily job summary |
| Store database purge | Elastic job | Log alert when fewer than 23 targets succeeded |
| Spring scale-up and scale-down | Automation runbook | Log alert on failed or suspended runbook jobs |
| Quarterly test copy of Finch Rewards | Automation runbook | Same runbook alert, plus a Teams post on success |
| New store database deployment | Pipeline with Bicep | Pipeline failure notice; activity log alert on deletes |
Keeping alerts useful
An alert that fires every night and is always ignored is worse than no alert, because it trains people to ignore the one that matters. Walt reviews the alert history every month with three questions: which alerts fired and needed no action, which incidents happened without an alert, and which alerts reached the wrong people. Rules in the first group get higher thresholds, longer windows or a lower severity; gaps in the second group get new rules; and the third group means an action group or processing rule needs changing. Each rule's description field records why it exists and what the first response should be, so the rule list doubles as part of the runbook.
Common mistakes
MistakeAn alert rule sends email itself.
InsteadAlert rules call action groups, which hold the notifications and actions.
MistakeA job that reports success is enough proof that a multi-target task ran.
InsteadAlert on missing success too, such as fewer targets than expected.
MistakeSuppressing alerts during maintenance means deleting the alert rules.
InsteadUse an alert processing rule for the time window; the alerts are still recorded.
MistakeAgent on Managed Instance can use any Database Mail profile name for its notifications.
InsteadAgent on Managed Instance uses the profile named AzureManagedInstance_dbmail_profile.
Summary and key terms
- An Azure Monitor alert has a scope, a condition and actions, plus a severity from 0 to 4.
- Metric alerts watch numeric metrics, log search alerts run KQL queries, and activity log alerts watch control-plane events.
- Evaluation frequency and window trade speed against noise; alert on missing success as well as on errors.
- Action groups hold the notifications and actions; share them across rules and keep self-healing to safe, quick changes.
- Alert processing rules suppress or reroute notifications, for example during planned maintenance.
- Agent alerts on errors and severities still matter on Managed Instance and VMs, and use Database Mail.
- Alert rule
- An Azure Monitor rule with a scope, a condition and one or more action groups.
- Action group
- A reusable set of notifications and actions run when an alert fires.
- Log search alert
- An alert rule whose condition is a Kusto query over a Log Analytics workspace.
- Activity log alert
- An alert rule that fires on Azure control-plane events.
- Alert processing rule
- A rule that suppresses or adds action groups to alerts in a scope and time window.
- Operator
- A SQL Server Agent contact that receives notifications.
Practice problems
Work each problem on paper first, then reveal the answer to check.
What are the three parts of an Azure Monitor alert rule?
Show answer
Scope, condition and actions (action groups).
Which kind of rule fires when someone deletes a database?
Show answer
An activity log alert.
Why does Walt count successful elastic job targets?
Show answer
To catch a run that reported success but reached fewer databases than expected.
What stops planned maintenance from paging the on-call DBA?
Show answer
An alert processing rule that suppresses notifications during the window.
Which Database Mail profile does Agent use on Managed Instance?
Show answer
AzureManagedInstance_dbmail_profile.
Lesson quiz · 5 questions
Score 60% or more to complete this lesson.
Create a free account to save your progress, take quizzes and earn a certificate.