
JAVA-260 · Lesson 11 of 12 · 26 min
Observability: logging, metrics and health checks
▶ Video coming soon A video version of this lesson is on the way.
On Wednesday, March 29, the last regular session, Leif brought a question from the server room: "When the website goes live and a customer says booking didn't work, how will we know what happened?" Tamsin, who had been trying the development server, added a second. She had looked at its log and found customers' phone numbers in plain text on every booking line. This lesson covers the three things that make a running service understandable from outside, logs, metrics and health checks, together with tracing, which connects them, and the care those signals need with personal data.
Three kinds of signal
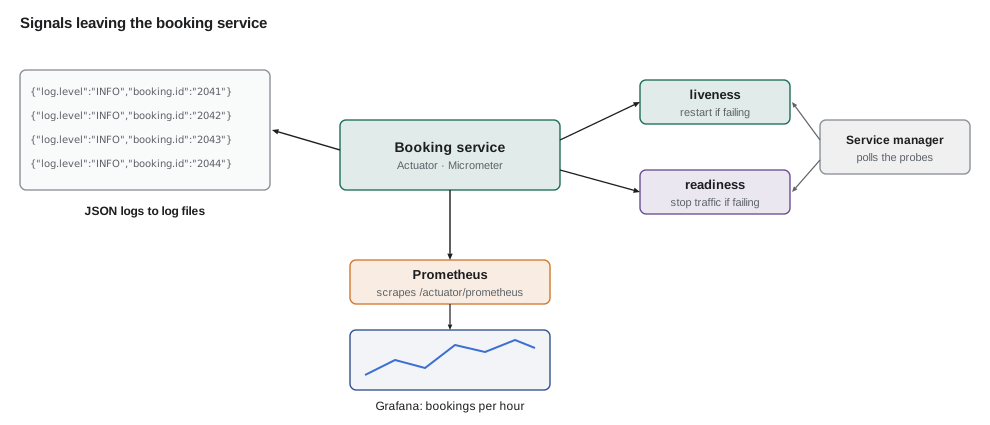
Logs are timestamped records of individual events: a booking was created, a supplier call timed out. They answer *what happened to this request*. Metrics are numbers aggregated over time: how many bookings per hour, how long requests take, how many supplier calls fail. They answer *how is the service doing overall* and they are cheap to keep for months. Health checks answer a yes-or-no question for machines: is this instance alive, and is it ready for traffic? Traces follow one request across services, so that a slow booking can be broken down into the time spent in the controller, the database and the supplier call. Together these are called observability.
| Signal | Answers | Spring Boot piece | Where it goes |
|---|---|---|---|
| Logs | What happened to this request? | SLF4J and Logback, structured logging | Files or a log service |
| Metrics | How is the service doing overall? | Micrometer and Actuator | Prometheus, graphed in Grafana |
| Health | Is this instance alive and ready? | Actuator health groups | The server's service manager or load balancer |
| Traces | Where did the time go? | Micrometer Tracing or the OpenTelemetry starter | A tracing back end such as Jaeger or Tempo |
Structured logs without personal data
Spring Boot logs through SLF4J, with Logback underneath. A line of plain text is easy for a person to read and hard for a program to search. Structured logging writes each event as a JSON object with named fields, which a log service can filter, for example every event with level WARN and path /api/v1/repair-bookings in the last hour. Since Spring Boot 3.4 a single property turns it on, with a choice of standard formats such as Elastic Common Schema (ecs), Graylog (gelf) and Logstash.
Tamsin's point was about content, not format. A log is read by more people, and kept for longer, than the database it describes, so it must not contain what it does not need: passwords, API keys, full card numbers, and personal data such as customers' phone numbers and email addresses. The booking ID identifies the booking well enough for the staff, who can look up the rest in the protected database. Privacy law in both countries the course follows, PIPEDA in Canada and state laws such as Ohio's data breach rules in the United States, makes the shop responsible for personal data wherever it is copied, logs included.
import java.time.*;
import java.util.*;
import java.util.regex.*;

public class Main {
    static final Pattern PHONE = Pattern.compile("\\b(\\d{3})-(\\d{3})-(\\d{4})\\b");
    static final Pattern EMAIL = Pattern.compile("[\\w.+-]+@[\\w-]+\\.[\\w.]+");

    static String redact(String text) {
        String t = PHONE.matcher(text).replaceAll("***-***-$3");
        return EMAIL.matcher(t).replaceAll("[email removed]");
    }

    static String esc(String s) { return s.replace("\\", "\\\\").replace("\"", "\\\""); }

    static String json(Instant at, String level, String logger, String message, Map<String, String> fields) {
        StringBuilder sb = new StringBuilder("{\"@timestamp\":\"").append(at).append("\",\"log.level\":\"").append(level)
                .append("\",\"log.logger\":\"").append(logger).append("\",\"message\":\"").append(esc(redact(message))).append('"');
        new TreeMap<>(fields).forEach((k, v) -> sb.append(",\"").append(k).append("\":\"").append(esc(redact(v))).append('"'));
        return sb.append('}').toString();
    }

    public static void main(String[] args) {
        Instant at = Instant.parse("2028-03-29T23:05:12Z");
        System.out.println(json(at, "INFO", "BookingService",
                "Booked 2028-05-06T10:30 for Ana Ferreira, phone 905-555-0142",
                Map.of("booking.id", "2041", "trace.id", "4bf92f3577b34da6")));
        System.out.println(json(at.plusSeconds(3), "WARN", "VelotekStock",
                "Supplier timeout for CHAIN-11 after 1000 ms",
                Map.of("supplier", "Velotek", "trace.id", "a3ce929d0e0e4736")));
        System.out.println(json(at.plusSeconds(9), "INFO", "BookingService",
                "Confirmation sent to dev.okafor@example.com",
                Map.of("booking.id", "2042", "trace.id", "00f067aa0ba902b7")));
    }
}{"@timestamp":"2028-03-29T23:05:12Z","log.level":"INFO","log.logger":"BookingService","message":"Booked 2028-05-06T10:30 for Ana Ferreira, phone ***-***-0142","booking.id":"2041","trace.id":"4bf92f3577b34da6"}
{"@timestamp":"2028-03-29T23:05:15Z","log.level":"WARN","log.logger":"VelotekStock","message":"Supplier timeout for CHAIN-11 after 1000 ms","supplier":"Velotek","trace.id":"a3ce929d0e0e4736"}
{"@timestamp":"2028-03-29T23:05:21Z","log.level":"INFO","log.logger":"BookingService","message":"Confirmation sent to [email removed]","booking.id":"2042","trace.id":"00f067aa0ba902b7"}What this code does
Each event becomes one JSON object with a timestamp, a level, the logger name, the message and extra fields sorted by name, so a log service can search on any of them. Before anything is written, redact replaces all but the last four digits of a phone number and removes email addresses, both in the message and in the fields. The timestamp is fixed in the example so the output is repeatable; a real logger uses the current time.
logging:
  structured:
    format:
      console: ecs
  level:
    root: INFO
    org.secondgear.api: INFO
    org.hibernate.SQL: WARN
What this code does
One property switches the console log to Elastic Common Schema JSON, one object per line. Levels are set per package, and SQL logging stays off in production because statements can contain customers' data. A developer can raise a level temporarily on the development server through the Actuator loggers endpoint, which is restricted to the ADMIN role.
@Service
class BookingService {
    private static final Logger log = LoggerFactory.getLogger(BookingService.class);

    public BookingView book(NewBooking request) {
        Booking saved = bookings.save(Booking.from(request));
        log.atInfo()
           .addKeyValue("booking.id", saved.id())
           .addKeyValue("booking.start", saved.start())
           .log("Repair booked");          // no name, phone or email in the log
        return BookingView.from(saved);
    }
}
What this code does
SLF4J's fluent API adds key-value pairs that the structured format writes as separate JSON fields, so the message stays short and fixed while the details are searchable. The booking ID and start time are enough for the staff to find the booking. The customer's name, phone and email stay in the database, where access is controlled.
Metrics with Micrometer
Micrometer is the metrics library behind Spring Boot Actuator, a little like SLF4J for metrics: your code records measurements through one API, and a registry sends them to whichever monitoring system is installed. The basic kinds are a counter, a number that only goes up, such as bookings created; a gauge, a value that is sampled, such as open bookings today; and a timer, which records how many times something happened and how long it took. Each metric has a name and tags, such as outcome=created or outcome=slot_taken, so one metric can be broken down without inventing a new name for each case.
import java.time.Duration;
import java.util.*;

public class Main {
    record Id(String name, Map<String, String> tags) {
        @Override public String toString() {
            StringJoiner j = new StringJoiner(",", "{", "}");
            new TreeMap<>(tags).forEach((k, v) -> j.add(k + "=\"" + v + "\""));
            return name + j;
        }
    }

    static class Registry {
        final Map<String, Double> counters = new TreeMap<>();
        final Map<String, List<Duration>> timers = new TreeMap<>();
        void count(String name, String... tags) { counters.merge(id(name, tags), 1.0, Double::sum); }
        void time(Duration d, String name, String... tags) { timers.computeIfAbsent(id(name, tags), k -> new ArrayList<>()).add(d); }
        static String id(String name, String... tags) {
            Map<String, String> m = new HashMap<>();
            for (int i = 0; i < tags.length; i += 2) m.put(tags[i], tags[i + 1]);
            return new Id(name, m).toString();
        }
    }

    public static void main(String[] args) {
        Registry r = new Registry();
        String[] outcomes = {"created", "created", "slot_taken", "created", "invalid", "created"};
        long[] millis = {42, 38, 51, 47, 6, 40};
        for (int i = 0; i < outcomes.length; i++) {
            r.count("bookings_total", "outcome", outcomes[i]);
            r.time(Duration.ofMillis(millis[i]), "http_server_requests_seconds", "method", "POST", "uri", "/api/v1/repair-bookings");
        }
        r.counters.forEach((id, v) -> System.out.println(id + " " + v));
        r.timers.forEach((id, list) -> {
            double sum = list.stream().mapToLong(Duration::toMillis).sum() / 1000.0;
            long max = list.stream().mapToLong(Duration::toMillis).max().orElse(0);
            System.out.println(id.replace("_seconds{", "_seconds_count{") + " " + list.size());
            System.out.println(id.replace("_seconds{", "_seconds_sum{") + " " + sum);
            System.out.println(id.replace("_seconds{", "_seconds_max{") + " " + max / 1000.0);
        });
    }
}bookings_total{outcome="created"} 4.0
bookings_total{outcome="invalid"} 1.0
bookings_total{outcome="slot_taken"} 1.0
http_server_requests_seconds_count{method="POST",uri="/api/v1/repair-bookings"} 6
http_server_requests_seconds_sum{method="POST",uri="/api/v1/repair-bookings"} 0.224
http_server_requests_seconds_max{method="POST",uri="/api/v1/repair-bookings"} 0.051What this code does
The registry keys each measurement by its name and its sorted tags, so the three outcomes of bookings_total are three separate counters under one name. The timer keeps the recorded durations and is printed as a count, a total and a maximum, the same three series Micrometer exposes for Prometheus. The durations are given as fixed numbers rather than measured, so the output does not change between runs.
@Service
class BookingService {
    private final Counter created, slotTaken;

    BookingService(MeterRegistry meters /* , other dependencies */) {
        this.created = Counter.builder("bookings").tag("outcome", "created").register(meters);
        this.slotTaken = Counter.builder("bookings").tag("outcome", "slot_taken").register(meters);
    }

    public BookingView book(NewBooking request) {
        try {
            BookingView v = doBook(request);
            created.increment();
            return v;
        } catch (SlotTaken e) {
            slotTaken.increment();
            throw e;
        }
    }
}
What this code does
Spring Boot supplies the MeterRegistry bean, and the service registers its counters once in the constructor. Each outcome increments its own tagged counter. Request timings need no code at all, because Spring MVC already records an http.server.requests timer for every endpoint, tagged with method, URI template and status.
Tags must have a small, fixed set of values. A tag such as outcome with three values is fine; a tag holding the booking ID or the customer's phone number would create a new time series for every booking, which overloads the monitoring system and copies personal data into it. Spring MVC tags requests with the URI *template*, /api/v1/repair-bookings/{id}, rather than the actual path, for exactly that reason.
management:
  endpoints:
    web:
      exposure:
        include: health,info,prometheus
  endpoint:
    health:
      probes:
        enabled: true
      show-details: when-authorized
  server:
    port: 9090
What this code does
Only three Actuator endpoints are exposed over HTTP: health, info and the Prometheus scrape endpoint. Health details such as the database state are shown only to authorized users. The management port 9090 is separate from the application's port, and Leif's firewall allows it only from the shop network, which keeps the Prometheus data off the internet.
Health checks: liveness and readiness
A health check is a URL that a machine polls. Spring Boot Actuator's /actuator/health combines health indicators, one per dependency such as the database or disk space, into one status: UP if all are up, DOWN if any is down. Two probe groups separate the questions a server asks. Liveness asks whether the process is working at all; if it fails, the right action is to restart it. Readiness asks whether it can serve requests right now; if it fails, the right action is to stop sending it traffic until it recovers. A database outage should make the service not ready, but restarting it would not bring the database back, so the database belongs in readiness and not in liveness.
import java.util.*;

public class Main {
    enum Status { UP, DOWN }
    record Indicator(String name, Status status, String detail) {}

    static Status aggregate(List<Indicator> indicators) {
        return indicators.stream().anyMatch(i -> i.status() == Status.DOWN) ? Status.DOWN : Status.UP;
    }

    static void report(String title, Map<String, List<String>> groups, List<Indicator> all) {
        System.out.println(title);
        for (var g : groups.entrySet()) {
            List<Indicator> members = all.stream().filter(i -> g.getValue().contains(i.name())).toList();
            Status s = aggregate(members);
            System.out.println("  /actuator/health/" + g.getKey() + " -> " + (s == Status.UP ? 200 : 503) + " " + s);
            for (Indicator i : members) System.out.println("      " + i.name() + ": " + i.status() + " (" + i.detail() + ")");
        }
    }

    public static void main(String[] args) {
        Map<String, List<String>> groups = new LinkedHashMap<>();
        groups.put("liveness", List.of("livenessState"));
        groups.put("readiness", List.of("readinessState", "db", "diskSpace"));

        List<Indicator> normal = List.of(
                new Indicator("livenessState", Status.UP, "CORRECT"),
                new Indicator("readinessState", Status.UP, "ACCEPTING_TRAFFIC"),
                new Indicator("db", Status.UP, "PostgreSQL"),
                new Indicator("diskSpace", Status.UP, "41 GB free"));
        List<Indicator> dbOutage = List.of(
                new Indicator("livenessState", Status.UP, "CORRECT"),
                new Indicator("readinessState", Status.UP, "ACCEPTING_TRAFFIC"),
                new Indicator("db", Status.DOWN, "connection refused"),
                new Indicator("diskSpace", Status.UP, "41 GB free"));

        report("Normal Saturday:", groups, normal);
        report("Database restarting:", groups, dbOutage);
    }
}Normal Saturday:
/actuator/health/liveness -> 200 UP
livenessState: UP (CORRECT)
/actuator/health/readiness -> 200 UP
readinessState: UP (ACCEPTING_TRAFFIC)
db: UP (PostgreSQL)
diskSpace: UP (41 GB free)
Database restarting:
/actuator/health/liveness -> 200 UP
livenessState: UP (CORRECT)
/actuator/health/readiness -> 503 DOWN
readinessState: UP (ACCEPTING_TRAFFIC)
db: DOWN (connection refused)
diskSpace: UP (41 GB free)What this code does
aggregate reports DOWN if any member of a group is down, which is Spring Boot's default ordering of statuses in miniature. During the database outage the readiness group goes DOWN and answers 503, telling the server to stop sending traffic, while liveness stays UP with 200, so nobody restarts a process that is working correctly. The checks are given as data so the example runs the same way every time.
A custom health indicator is a bean that implements HealthIndicator. The booking service has one for Velotek, but it is deliberately *not* in the readiness group: when Velotek is down the shop can still take bookings and simply shows "delivery date unknown", so the outage must not take the booking service out of service. A health check should reflect what the instance itself needs, not every system it talks to.
@Component("velotek")
class VelotekHealth implements HealthIndicator {
    private final SupplierStatus status;

    VelotekHealth(SupplierStatus status) { this.status = status; }

    @Override
    public Health health() {
        return status.lastCallSucceeded()
                ? Health.up().withDetail("circuit", status.circuitState()).build()
                : Health.down().withDetail("circuit", status.circuitState()).build();
    }
}
What this code does
The indicator reports the result of recent supplier calls and the circuit breaker's state from lesson 8, without making a network call of its own each time it is polled. It appears in the full health report for staff. Because it is not listed in the readiness group, a Velotek outage never stops the shop from taking bookings.
Tracing and correlation
When a request passes through several services, or simply through several threads, its log lines need something in common. A trace ID is created at the edge, passed along in an HTTP header between services, and added to every log line and timing for that request. Spring Boot does this through Micrometer Tracing or, since Boot 4, the OpenTelemetry starter, which uses the W3C traceparent header and puts trace.id and span.id into the structured logs automatically. With it, Leif can take the trace ID from a customer's error page and find every log line and supplier call for that one request.
curl -s http://localhost:9090/actuator/prometheus | grep -E '^(bookings_total|http_server_requests_seconds_count)'bookings_total{outcome="created"} 4.0
bookings_total{outcome="slot_taken"} 1.0
http_server_requests_seconds_count{error="none",exception="none",method="POST",outcome="SUCCESS",status="201",uri="/api/v1/repair-bookings"} 4
http_server_requests_seconds_count{error="none",exception="SlotTaken",method="POST",outcome="CLIENT_ERROR",status="409",uri="/api/v1/repair-bookings"} 1What this code does
The Prometheus endpoint lists every metric as text, one series per line, and the grep keeps two of them. Prometheus scrapes this page every fifteen seconds and keeps the history.
Metrics become useful when someone is told about a problem before a customer is. Leif set two alerts in Grafana: readiness DOWN for more than two minutes during opening hours, and more than five slot_taken outcomes in ten minutes, which would mean the website was offering slots that were no longer free. Both send a text to his phone.
Try it yourself
Redact the logs
Complete redact so that every phone number written as three digits, a dash, three digits, a dash and four digits keeps only its last four digits, as ***-***-0142, and every word containing @ becomes [email removed].
Words are separated by single spaces; a trailing comma or period stays in place.
public class Main {
    static String redact(String line) {
        return line;
    }

    public static void main(String[] args) {
        System.out.println(redact("Booked 2041 for phone 555-555-0142, reminder at 09:00."));
        System.out.println(redact("Confirmation sent to dev.okafor@example.com."));
        System.out.println(redact("Two numbers: 555-555-0199 and 555-555-0110"));
        System.out.println(redact("Part TUBE-700 low: 12 left"));
    }
}
Try it yourself
Summarize a timer
Complete summary so that it returns count=N mean=M ms max=X ms for a list of request durations in milliseconds, with the mean rounded down to a whole number.
An empty list gives count=0.
import java.util.*;

public class Main {
    static String summary(List<Long> millis) {
        return "count=0";
    }

    public static void main(String[] args) {
        System.out.println(summary(List.of(42L, 38L, 51L, 47L, 6L, 40L)));
        System.out.println(summary(List.of(980L, 1010L, 1002L)));
        System.out.println(summary(List.of()));
    }
}
Tamsin checked the development server's log the following morning. The booking lines showed a booking ID, a start time and a trace ID, and nothing else about the customer. She closed the issue she had opened.
Common mistakes
MistakeLogging whole request bodies to help debugging.
InsteadLog IDs and outcomes; personal data and secrets stay out of logs.
MistakeUsing booking IDs or phone numbers as metric tags.
InsteadKeep tag values few and fixed, such as outcome=created.
MistakePutting every dependency into the readiness check.
InsteadInclude only what this instance needs to serve requests; a supplier outage has a fallback.
MistakeRestarting the service when the database is down.
InsteadLet readiness stop traffic; liveness is only for a broken process.
MistakeExposing every Actuator endpoint on the public port.
InsteadExpose only what is needed, on a management port reachable from the internal network.
Summary and key terms
- Observability combines logs (what happened to one request), metrics (how the service is doing overall), health checks (is this instance alive and ready) and traces (where the time went).
- Spring Boot logs through SLF4J and Logback, and logging.structured.format.console writes JSON such as ecs; logs must not hold personal data or secrets.
- Micrometer records counters, gauges and timers with a few fixed-value tags, Spring MVC times every request as http.server.requests, and Actuator exposes them for Prometheus.
- Actuator's health groups separate liveness, which triggers restarts, from readiness, which stops traffic; dependencies with fallbacks stay out of readiness.
- Micrometer Tracing or the OpenTelemetry starter adds trace IDs to logs and headers.
- Only needed endpoints are exposed, ideally on a separate management port.
- Observability
- Being able to understand a running system from the signals it emits.
- Structured logging
- Writing log events as machine-readable records such as JSON objects.
- Redaction
- Removing or masking sensitive values before they are written.
- Micrometer
- The metrics library used by Spring Boot, with registries for many monitoring systems.
- Counter
- A metric that only increases, such as bookings created.
- Timer
- A metric that records the count and duration of events.
- Tag
- A name and value attached to a metric to break it down, such as outcome=created.
- Liveness
- Whether a process works at all; failing it leads to a restart.
- Readiness
- Whether an instance can take traffic now; failing it stops traffic.
- Trace ID
- An identifier shared by all the work done for one request, across threads and services.
Practice problems
Work each problem on paper first, then reveal the answer to check.
Which property turns on JSON console logs in the ecs format?
Show answer
logging.structured.format.console=ecs.
Why must a booking ID not be a metric tag?
Show answer
Every booking would create a new time series.
The database is down. Which probe should fail?
Show answer
Readiness, not liveness.
What does Spring MVC record for every request without extra code?
Show answer
An http.server.requests timer tagged with method, URI template and status.
What should replace a customer's phone number in a log line?
Show answer
Nothing, or a masked form; the booking ID is enough to find the customer.
Lesson quiz · 5 questions
Score 60% or more to complete this lesson.
Create a free account to save your progress, take quizzes and earn a certificate.