
JAVA-120 · Lesson 8 of 12 · 21 min
Debugging in the IDE
▶ Video coming soon A video version of this lesson is on the way.
Kofi's first real complaint about PartsDesk arrived in late February: the weekly restock list asked for more inner tubes than he expected. Hamza's instinct was to sprinkle System.out.println lines through the code and rerun it. On Monday, March 8, 2027 Leif sat him down with the debugger instead. Printing tells you what you thought to print; a debugger lets you stop the program at any line and look at everything, and then change your question without rebuilding. Ten minutes with it is usually faster than an evening of println.
What a debugger does
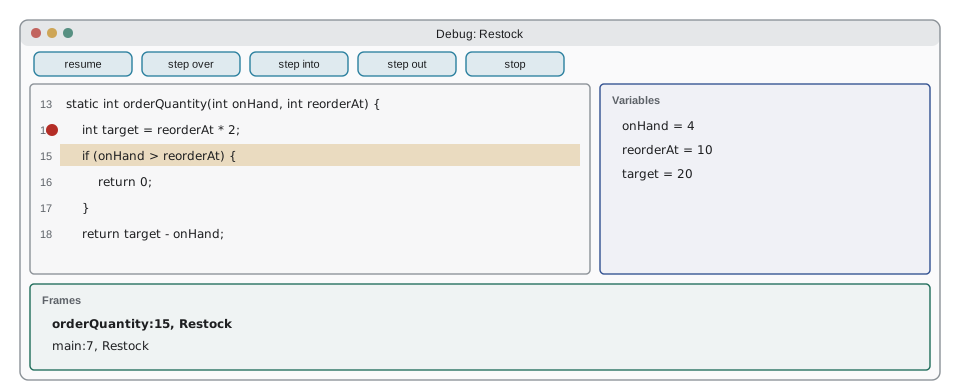
A debugger runs your program under control. You mark lines with breakpoints; when execution reaches one, the program pauses, and the IDE shows the current line, the values of all variables in scope, and the call stack, the chain of method calls that led there. From a pause you can step: run one line and pause again, step into a method call to follow it, or step out to return to the caller. Then you resume, and the program runs until the next breakpoint. Nothing about the program changes; you are watching it run at your own pace.
| Action | What it does | IntelliJ | VS Code |
|---|---|---|---|
| Toggle breakpoint | Pause here next time this line runs | Ctrl+F8 or click the gutter | F9 or click the gutter |
| Debug | Start the program under the debugger | Shift+F9 | F5 |
| Step over | Run this line, including any calls, then pause | F8 | F10 |
| Step into | Follow the call on this line into the method | F7 | F11 |
| Step out | Finish this method and pause in the caller | Shift+F8 | Shift+F11 |
| Resume | Run to the next breakpoint | F9 | F5 |
| Evaluate expression | Compute any expression using the paused values | Alt+F8 | Debug console |
The same thing in a terminal: jdb
Every IDE debugger is a front end for the same machinery inside the JVM, the Java Debug Wire Protocol, and the JDK includes a command-line debugger, jdb, that uses it directly. Leif showed it once, not because Hamza will use it daily, but because it makes plain what the IDE's buttons do. The session below is real, on a cut-down copy of PartsDesk's restock calculation. The program was compiled with javac -g so the class files keep local variable names for the debugger.
public class Restock {
    public static void main(String[] args) {
        int[] onHand = {4, 22, 3};
        int[] reorderAt = {10, 8, 4};
        int total = 0;
        for (int i = 0; i < onHand.length; i++) {
            int order = orderQuantity(onHand[i], reorderAt[i]);
            total += order;
        }
        System.out.println("Units to order: " + total);
    }

    static int orderQuantity(int onHand, int reorderAt) {
        int target = reorderAt * 2;
        if (onHand > reorderAt) {
            return 0;
        }
        return target - onHand;
    }
}
What this code does
For each part, orderQuantity orders enough to bring the stock up to twice its reorder level, but only when the part is at or below that level. main adds up the units for all three parts and prints the total. Line 14 is the first line of orderQuantity, where the debugging session sets its breakpoint.
$ javac -g Restock.java
$ jdb -classpath . Restock
Initializing jdb ...
> stop at Restock:14
Deferring breakpoint Restock:14.
It will be set after the class is loaded.
> run
run Restock
Set uncaught java.lang.Throwable
Set deferred uncaught java.lang.Throwable
VM Started: Set deferred breakpoint Restock:14

Breakpoint hit: "thread=main", Restock.orderQuantity(), line=14 bci=0
14            int target = reorderAt * 2;

main[1] locals
Method arguments:
onHand = 4
reorderAt = 10
Local variables:
main[1] next
>
Step completed: "thread=main", Restock.orderQuantity(), line=15 bci=4
15            if (onHand > reorderAt) {

main[1] next
>
Step completed: "thread=main", Restock.orderQuantity(), line=18 bci=11
18            return target - onHand;

main[1] print target - onHand
 target - onHand = 16
main[1] where
  [1] Restock.orderQuantity (Restock.java:18)
  [2] Restock.main (Restock.java:7)
main[1] cont
>
Breakpoint hit: "thread=main", Restock.orderQuantity(), line=14 bci=0
14            int target = reorderAt * 2;

main[1] cont
>
Breakpoint hit: "thread=main", Restock.orderQuantity(), line=14 bci=0
14            int target = reorderAt * 2;

main[1] cont
> Units to order: 21

The application exited
What this code does
stop at Restock:14 sets a breakpoint, and run starts the program, which pauses at the first call. locals shows the arguments for the tubes; next steps one line at a time; print evaluates an expression; and where shows the call stack, orderQuantity called from main at line 7. cont resumes, pausing again for each of the other two parts, until the program prints its total and exits.
Stepping through showed Hamza that the code did exactly what it says: for the tubes, 4 on hand and a reorder level of 10, it orders 16 to reach a target of 20. The total of 21 was right. The surprise was in the data: Kofi had raised the tubes' reorder level to 10 after the October shortages and forgotten. Many bugs turn out to be like this, and the debugger found it faster than reading the code would have, because it showed the real values rather than the ones Hamza assumed.
Breakpoints that are smarter
A plain breakpoint pauses every time its line runs, which is useless inside a loop that runs a thousand times. IDEs offer better ones. A conditional breakpoint pauses only when an expression is true, such as code.equals("TUBE-700x25") or i == 412. An exception breakpoint pauses the moment a given exception is thrown, anywhere, before it is caught or the program dies, which takes you straight to the cause of a crash. A logpoint, or non-suspending breakpoint, prints a message when the line runs without pausing at all, a println you do not have to add, rebuild or remember to remove.
public class Main {
    static int orderQuantity(int onHand, int reorderAt) {
        int target = reorderAt * 2;
        return onHand > reorderAt ? 0 : target - onHand;
    }

    public static void main(String[] args) {
        String[] codes = {"TUBE-700x25", "PAD-RIM", "CHAIN-8", "CABLE-BRK"};
        int[] onHand = {4, 22, 3, 0};
        int[] reorderAt = {10, 8, 4, 6};
        int total = 0;
        for (int i = 0; i < codes.length; i++) {
            int order = orderQuantity(onHand[i], reorderAt[i]);
            // A logpoint here with the condition order > 10 would print only this line:
            if (order > 10) {
                System.out.println("[log] " + codes[i] + " orders " + order);
            }
            total += order;
        }
        System.out.println("Units to order: " + total);
    }
}[log] TUBE-700x25 orders 16 [log] CABLE-BRK orders 12 Units to order: 33
What this code does
The if statement plays the part of a conditional logpoint, reporting only the iterations where a large order is placed. In the debugger you would set this condition on a breakpoint instead of writing it into the code, so nothing has to be removed afterwards. Two parts, the tubes and the brake cables, cross the threshold.
Reading a stack trace
When a program stops with an exception, the JVM prints a stack trace: the exception's type and message, then the call stack at the moment it was thrown, innermost call first, each line giving the class, method, file and line number. Read it from the top. The first line that names your own code, rather than a JDK or library class, is usually where to look. If the trace has a Caused by section, the real cause is at the bottom: code often catches a low-level exception and throws a more meaningful one that wraps it.
public class Main {
    static int parseCount(String text) {
        return Integer.parseInt(text.trim());
    }

    static int readLine(String line) {
        String[] parts = line.split(",");
        try {
            return parseCount(parts[1]);
        } catch (NumberFormatException e) {
            throw new IllegalArgumentException("Bad count in line: " + line, e);
        }
    }

    public static void main(String[] args) {
        try {
            readLine("TUBE-700x25, four");
        } catch (IllegalArgumentException e) {
            e.printStackTrace(System.out);
        }
    }
}java.lang.IllegalArgumentException: Bad count in line: TUBE-700x25, four at Main.readLine(Main.java:11) at Main.main(Main.java:17) Caused by: java.lang.NumberFormatException: For input string: "four" at java.base/java.lang.NumberFormatException.forInputString(NumberFormatException.java:67) at java.base/java.lang.Integer.parseInt(Integer.java:662) at java.base/java.lang.Integer.parseInt(Integer.java:778) at Main.parseCount(Main.java:3) at Main.readLine(Main.java:9) ... 1 more
What this code does
readLine catches the NumberFormatException from parsing and throws an IllegalArgumentException that carries it as its cause. The printed trace shows the outer exception first, with the call chain from readLine up to main, and then a Caused by section for the original exception. The ... 1 more line means the rest of the cause's stack is the same as the outer one and has been left out.
Two habits make stack traces useful. Always pass the original exception as the cause when you wrap one, as readLine does with its second argument, or the trace loses the real reason. And never catch an exception only to print a vague message and carry on; let it propagate, or handle it properly, so the trace survives to be read.
Assertions
An assertion states something the programmer believes is always true at a point in the code, such as a stock count never being negative. The assert statement checks it, but only when assertions are enabled with the -ea option, which test runs and debugging sessions often use and production runs usually do not. Assertions are for catching your own mistakes during development, never for checking user input, because they may be switched off.
$ javac Checks.java
$ java Checks
Stock count accepted: -2
$ java -ea Checks
Exception in thread "main" java.lang.AssertionError: negative stock count: -2
	at Checks.main(Checks.java:4)
What this code does
Without -ea the assert statement is skipped entirely, and the program accepts a negative count. With -ea the same class stops with an AssertionError carrying the message, and the stack trace points to line 4. Build tools such as Gradle and Maven's Surefire enable assertions when they run tests.
public class Main {
    public static void main(String[] args) {
        boolean enabled = false;
        assert enabled = true;   // runs only when assertions are on
        System.out.println("Assertions enabled: " + enabled);

        int[] counts = {4, 22, 3};
        int total = 0;
        for (int c : counts) {
            assert c >= 0 : "negative count " + c;
            total += c;
        }
        System.out.println("Total on hand: " + total);
    }
}Assertions enabled: false Total on hand: 29
What this code does
The first assert uses a deliberate side effect: the assignment inside it runs only when assertions are enabled, so the variable reports whether they are. Run normally, as here, it prints false, and the checks in the loop are skipped. Run with java -ea, it would print true, and a negative count would stop the program with an AssertionError.
Debugging a program that is already running
The JVM can also be debugged while it runs somewhere else, on a server or in a container, by starting it with the JDWP agent, which opens a port the IDE connects to. IntelliJ calls this a Remote JVM Debug configuration, and VS Code an attach configuration. The option below starts a program that waits for a debugger to attach on port 5005 of the local machine before running its first line; with suspend=n it starts at once and lets a debugger attach later.
java -agentlib:jdwp=transport=dt_socket,server=y,suspend=y,address=127.0.0.1:5005 -jar partsdesk.jarWhat this code does
The -agentlib:jdwp option loads the JVM's debugging agent with a socket transport, acting as the server the debugger connects to. suspend=y makes the program wait for the debugger before it starts, so you can catch problems in start-up code. Binding to 127.0.0.1 keeps the port reachable only from the same computer, which matters because anyone who can connect to a debug port can run any code in the program.
Leif's warning about that last point is serious: never leave a debug port open on a server reachable from a network. Attaching a debugger gives complete control of the program.
A method for hard bugs
The debugger is a tool; the method matters more. Leif's checklist for a bug he cannot see at once:
- Reproduce it reliably first, with the smallest input that shows it.
- Write down what you expected and what actually happened, in numbers.
- Halve the search: put a breakpoint halfway through the suspect code and check whether the values are already wrong there.
- Change one thing at a time, and rerun after each change.
- When you find the cause, write a test that fails because of it, then fix it, so it cannot come back unnoticed (JAVA-220 covers tests).
Try it yourself
Find the off-by-one
The total method is meant to add up every count in the array, but Kofi's report comes out short. Step through it in your head, or in the debugger, find the bug and fix it.
The program should print Total: 29.
public class Main {
    static int total(int[] counts) {
        int sum = 0;
        for (int i = 0; i < counts.length - 1; i++) {
            sum += counts[i];
        }
        return sum;
    }

    public static void main(String[] args) {
        System.out.println("Total: " + total(new int[] {4, 22, 3}));
    }
}
Try it yourself
Keep the cause
readCount wraps a NumberFormatException in an IllegalArgumentException but throws away the original, so the stack trace loses the real reason. Pass the original exception as the cause.
The program should print Bad count: four and then Cause: NumberFormatException.
public class Main {
    static int readCount(String text) {
        try {
            return Integer.parseInt(text);
        } catch (NumberFormatException e) {
            throw new IllegalArgumentException("Bad count: " + text);
        }
    }

    public static void main(String[] args) {
        try {
            readCount("four");
        } catch (IllegalArgumentException e) {
            System.out.println(e.getMessage());
            Throwable c = e.getCause();
            System.out.println("Cause: " + (c == null ? "lost" : c.getClass().getSimpleName()));
        }
    }
}
Common mistakes
MistakeAdding println lines everywhere and forgetting to remove them.
InsteadUse breakpoints and logpoints, which change nothing in the code.
MistakePausing inside a busy loop on every pass.
InsteadMake the breakpoint conditional, such as i == 412.
MistakeReading a stack trace from the bottom of the outer exception.
InsteadStart at the top, find the first line in your own code, and check any Caused by section.
MistakeWrapping an exception without passing the original as the cause.
InsteadUse the constructor that takes a cause so the trace keeps the real reason.
MistakeUsing assert to check user input.
InsteadAssertions may be disabled; validate input with ordinary code and exceptions.
Summary and key terms
- A debugger runs a program under control: breakpoints pause it, the IDE shows variables and the call stack, and step over, into and out move through the code one line at a time.
- Conditional breakpoints, exception breakpoints and logpoints avoid pausing at the wrong time and replace temporary println lines. jdb shows the same operations on the command line, through the Java Debug Wire Protocol every IDE uses; compile with -g to keep local variable names.
- Stack traces are read from the top, looking for the first line in your own code and any Caused by section, and wrapped exceptions should keep their cause.
- Assertions check the programmer's assumptions and run only with -ea.
- A running JVM can be debugged remotely through the JDWP agent, whose port must never be exposed to a network.
- Debugger
- A tool that runs a program under control so it can be paused and examined.
- Breakpoint
- A marked line where the debugger pauses the program.
- Conditional breakpoint
- A breakpoint that pauses only when an expression is true.
- Exception breakpoint
- A breakpoint that pauses when a given exception is thrown.
- Logpoint
- A breakpoint that prints a message without pausing.
- Step over, into, out
- Run the current line, follow a call into a method, or finish the current method.
- Call stack
- The chain of method calls active at a point in the program.
- Stack trace
- The printed call stack at the moment an exception was thrown.
- Cause
- The original exception carried inside a wrapping exception.
- Assertion
- An assert statement checking an assumption, active only with -ea.
- JDWP
- The Java Debug Wire Protocol, used by debuggers to control a JVM.
Practice problems
Work each problem on paper first, then reveal the answer to check.
What does step into do that step over does not?
Show answer
It follows the method call on the current line into that method instead of running it in one go.
Why compile with javac -g before using jdb?
Show answer
So the class files keep local variable names for the debugger to show.
Where do you look first in a stack trace?
Show answer
At the top, for the first line that names your own code, and then at any Caused by section.
Why might an assert statement not run?
Show answer
Assertions are disabled unless the JVM is started with -ea.
Why must a JDWP debug port not be reachable from a network?
Show answer
Anyone who connects can control the program and run code in it.
Lesson quiz · 5 questions
Score 60% or more to complete this lesson.
Create a free account to save your progress, take quizzes and earn a certificate.