
INS-410 · Lesson 3 of 12 · 20 min
Choosing an economic thickness
▶ Video coming soon A video version of this lesson is on the way.
In INS-120, Devon Marsh finally answered Bernie's question from the first week, "Why 76 mm on the header?", by showing that each extra layer of insulation saves less than the one before. Raj wanted Priya to go one step further and put money on it. "Every thickness has two costs," he said. "What you pay once to put it on, and what you pay every year for the heat that still gets through. Add them up properly and one thickness comes out cheapest. That's the economic thickness."
This lesson explains the idea of economic thickness, how to put a one-time installed cost and a yearly energy cost on the same footing, and how to find the thickness with the lowest total cost. It works the full calculation for the new kettle room steam line, and then looks at what changes the answer and how the NAIMA 3E Plus program handles the same question.
Two costs that pull in opposite directions
As insulation gets thicker, the energy cost of the heat that still escapes falls, quickly at first and then slowly, as lesson 2 showed with the logarithm in the resistance. At the same time the installed cost rises: more material, larger jackets and bands, more labour and, for very thick systems, multiple layers and bigger supports. Plotted against thickness, the energy cost curve falls and the installed cost line rises. Their sum, the total cost, falls, reaches a minimum and rises again. The thickness at the bottom of that curve is the economic thickness.
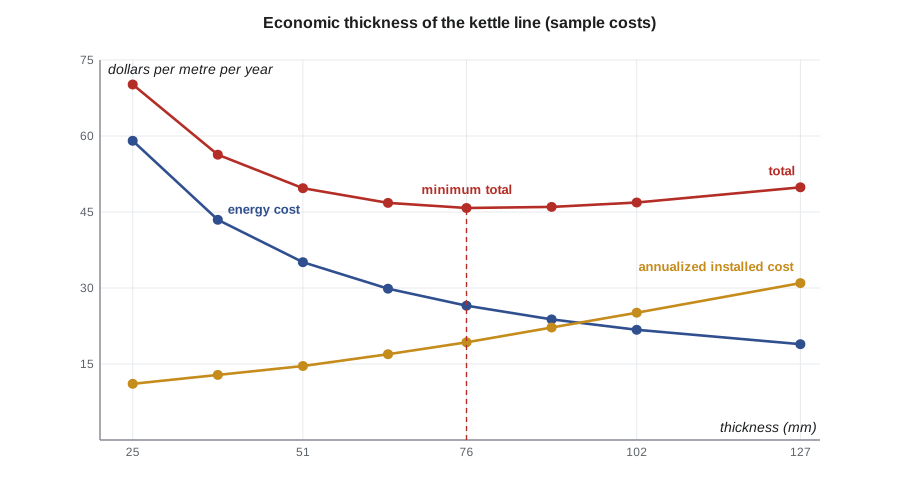
The minimum is usually broad and flat. Several thicknesses near the bottom cost almost the same in total, which leaves room for practical choices: a standard size the supplier stocks, the same thickness as the rest of the plant, or a thickness that also meets personnel protection or a code minimum.
Putting both costs on a yearly basis
An installed cost is paid once, while the energy cost recurs every year. To add them, the installed cost is spread over the life of the insulation as an equal yearly amount, the way a loan is repaid. The factor that does this is the capital recovery factor (CRF):
where i is the interest or discount rate the owner uses for investments and n is the life in years. With i = 0.08 (8 in 100) and n = 15 years:
So each dollar of installed cost is equivalent to about 0.117 dollars a year over 15 years at 8 in 100. The annual total cost for each thickness is:
The owner supplies the rate, the life and the energy price. Raj asked Anika for Kellerton's figures; for this course the energy price is the same sample used in INS-340, 0.40 dollars per cubic metre of gas, about 13.16 dollars per GJ of steam, with 7,550 hours a year.
The kettle line, worked
The new kettle room line from INS-120 is an NPS 6 line at 186 °C (366 °F), with 64 m (210 ft) on the outdoor rack in an ambient of 10 °C (50 °F). The heat losses below use the same method and assumptions as INS-120: mineral wool at k = 0.045 W/m·K and an outdoor surface coefficient of 10 W/m²·K. The installed costs are SAMPLE figures per metre, including the aluminum jacket, bands and labour, for illustration only.
| Thickness (mm) | Heat loss (W/m) | Energy cost (dollars per m per year) | Installed cost, SAMPLE (dollars per m) | Annualized installed cost (dollars per m per year) | Total (dollars per m per year) |
|---|---|---|---|---|---|
| 25 | 165.1 | 59.06 | 95 | 11.10 | 70.16 |
| 38 | 121.5 | 43.46 | 110 | 12.85 | 56.31 |
| 51 | 98.1 | 35.10 | 125 | 14.60 | 49.70 |
| 64 | 83.5 | 29.86 | 145 | 16.94 | 46.80 |
| 76 | 74.1 | 26.50 | 165 | 19.28 | 45.78 |
| 89 | 66.6 | 23.81 | 190 | 22.20 | 46.00 |
| 102 | 60.8 | 21.75 | 215 | 25.12 | 46.87 |
| 127 | 52.9 | 18.91 | 265 | 30.96 | 49.87 |
Worked problem
Checking one row of the table
Show how the 76 mm row of the table is calculated.
Show solution
- Heat loss: 74.1 W/m, from the same calculation as INS-120.
- Energy per year: 74.1 W × 7,550 h × 3,600 s/h = 2.014 × 10⁹ J = 2.014 GJ per metre.
- Energy cost: 2.014 × 13.16 = 26.50 dollars per metre per year.
- Annualized installed cost: 165 × 0.1168 = 19.28 dollars per metre per year.
- Total: 26.50 + 19.28 = 45.78 dollars per metre per year.
Answer: The lowest total in the table is the 76 mm row, at 45.78 dollars per metre per year, so 76 mm is the economic thickness on these figures, the thickness INS-120 chose.
The table also shows how flat the bottom is. The 64 mm and 89 mm rows are within about 1 in 100 to 3 in 100 of the minimum. Going from 76 to 89 mm costs almost nothing extra in total, which is why some owners choose one size up as a hedge against rising energy prices.
The incremental view
Another way to see the same answer is to ask what each step up in thickness buys. The incremental payback of a step is its extra installed cost divided by its extra yearly saving:
| Step | Extra installed cost, SAMPLE | Extra saving per year | Incremental payback |
|---|---|---|---|
| 51 to 76 mm | 40 dollars per m | 8.60 dollars per m | 4.7 years |
| 76 to 102 mm | 50 dollars per m | 4.75 dollars per m | 10.5 years |
| 102 to 127 mm | 50 dollars per m | 2.85 dollars per m | 17.6 years |
With money at 8 in 100 and a 15-year life, a step that pays back in about 8 years or less earns more than it costs. The step to 76 mm clears that easily; the step to 102 mm does not. Over the whole 64 m (210 ft) outdoor run, the step from 76 to 102 mm would save only about 64 × 4.75 = 304 dollars a year for an extra 3,200 dollars of installed cost.
What moves the answer
The economic thickness is not a fixed property of a pipe. It changes with every input, and an insulator who knows the direction of each change can sense-check any recommendation:
| If this goes up | The economic thickness | Why |
|---|---|---|
| Energy price | Increases | Each unit of heat saved is worth more |
| Operating hours | Increases | More hours of loss each year |
| Operating temperature | Increases | More heat to save |
| Installed cost | Decreases | Each layer costs more |
| Interest rate | Decreases | Future savings are worth less today |
| Expected life | Increases | Savings accumulate for more years |
| Pipe size | Increases slightly | Larger surface, though cost also rises |
For example, at twice the sample energy price, the same table gives its minimum total at 102 mm instead of 76 mm: the energy column doubles while the installed cost column stays the same. A plant that expects fuel prices or carbon charges to rise may reasonably choose the thicker option.
Carbon pricing is one such factor. Large industrial emitters in Canada face carbon costs under federal or provincial output-based pricing systems, many companies set an internal carbon price for their decisions, and an owner who includes a carbon cost in the energy price will find a thicker economic thickness. Anika told Raj that Kellerton's corporate office asks each project to show its emissions saving as well as its cost saving; lesson 7 shows how.
How the software does it
NAIMA's 3E Plus program, which lesson 10 describes, calculates economic thickness with a more detailed method than the simple table above. It asks for the fuel type and cost, the boiler or system efficiency, the operating hours, the installed cost of each thickness or a cost estimator, the expected life, the interest rate and, in the full method, fuel price escalation, maintenance costs and tax effects. The principle is the same: it finds the thickness with the lowest total life-cycle cost. For maintenance work, many contractors use the simpler annualized method shown here, or simple payback alone, and use 3E Plus or the owner's own method for larger capital projects.
Two cautions apply. First, the installed cost used in an economic thickness calculation must be the real installed cost on that job, including access, scaffolding and jacketing, not just the material price; on a high pipe rack, access can be more than half the cost and pushes the economic thickness up, because most of the cost is paid whatever the thickness. Second, an economic thickness is a minimum for energy, not a maximum. If personnel protection, condensation or a code requires more, the larger thickness governs.
Economic thickness for a whole line
Per-metre and per-foot tables are convenient, but owners decide on whole lines and whole jobs. Scaling the kettle line table to its full outdoor length makes the choice concrete:
| Option for the 64 m outdoor run | Installed cost, SAMPLE | Energy cost per year | Total per year (annualized) |
|---|---|---|---|
| 51 mm | 8,000 dollars | 2,246 dollars | 3,181 dollars |
| 76 mm | 10,560 dollars | 1,696 dollars | 2,930 dollars |
| 102 mm | 13,760 dollars | 1,392 dollars | 3,000 dollars |
Seen this way, the difference between the middle and thick options is about 70 dollars a year on the whole run, small enough that the owner's other priorities, such as matching the plant standard or allowing for future price rises, can decide. The difference between the thin and middle options is larger and points clearly to the middle one.
Cold systems and economic thickness
Economic thickness applies to cold systems too, with the energy priced as refrigeration electricity, as lesson 5 shows. In practice, cold systems are almost always governed by condensation control or by the owner's minimum, because the thickness that keeps the jacket dry is usually greater than the economic one, and because the consequences of a wet cold system, ice, corrosion and failed insulation, cost far more than the energy. The economic calculation is still useful to show the owner the running cost of a cold system and to justify thicker insulation in very humid or very cold service.
Why plants keep a standard
Most plants, like Kellerton, keep a short table of standard thicknesses by temperature and pipe size, worked out once from economic thickness at the plant's prices and then used for every repair. A standard saves the calculation on each job, keeps stocks simple and makes inspection easy, because anyone can see what should be on a line. The cost is that the standard drifts away from the true optimum as energy prices change, so it should be reviewed every few years. When Raj checked Kellerton's standard against the sample prices in this lesson, he found it still sat at or near the economic minimum, which is why he kept it in lesson 12.
When an owner asks for a thickness different from the standard, the economic thickness calculation is the evidence. A table like the one in this lesson, with the owner's prices, shows plainly whether the extra thickness pays and how much the decision is worth either way.
Reading an economic thickness table
Economic thickness tables from programs or manufacturers are read like any other table: find the pipe size and temperature, check that the energy price, hours, interest rate and life in the heading match the owner's, and read the thickness. If the heading's inputs differ from the owner's, the table is only a starting point, and the calculation should be redone. A table built for a plant running one shift, with low energy prices, will recommend far less insulation than a plant running around the clock needs.
Common mistakes
MistakeComparing a one-time installed cost with a yearly energy cost directly.
InsteadAnnualize the installed cost with the capital recovery factor, or compare the total over the life.
MistakeChoosing the thickness with the lowest energy loss.
InsteadThe thickest insulation always has the lowest loss; choose the lowest total cost.
MistakeUsing only material prices as the installed cost.
InsteadInclude labour, jacketing, access and scaffolding, which may dominate.
MistakeTreating the economic thickness as exact.
InsteadThe minimum is broad; choose a practical standard size near it and check the other purposes.
MistakeForgetting that an economic thickness changes with energy price and hours.
InsteadRedo it with the owner's figures, and test what happens if prices rise.
Summary and key terms
- Economic thickness is the thickness with the lowest total of annualized installed cost and yearly energy cost.
- The capital recovery factor spreads an installed cost over the life: CRF = i(1 + i)ⁿ ÷ ((1 + i)ⁿ − 1); 0.1168 for 8 in 100 over 15 years.
- For the kettle line at the sample price, 76 mm gives the lowest total, with 64 to 89 mm within a few in 100 of it.
- Higher energy prices, hours, temperatures and life increase the economic thickness; higher installed costs and interest rates decrease it.
- Economic thickness is a minimum for energy; personnel protection, condensation and codes can require more.
- Economic thickness
- The insulation thickness that gives the lowest total cost of installation and lost energy over the life of the system.
- Capital recovery factor
- A factor that converts a one-time cost into an equal yearly amount over a given life at a given interest rate.
- Annualized cost
- A one-time cost expressed as an equal amount per year.
- Incremental payback
- The extra installed cost of a step in thickness divided by the extra yearly saving it gives.
- Life-cycle cost
- The total of all costs of a system over its life, including installation, energy and maintenance.
- Discount rate
- The rate an owner uses to compare future amounts of money with money today.
Practice problems
Work each problem on paper first, then reveal the answer to check.
What is the CRF for 8 in 100 over 15 years?
Show answer
0.1168.
An installed cost of 200 dollars per metre is annualized with a CRF of 0.1168. What is the yearly amount?
Show answer
23.36 dollars per metre per year.
Why is the total cost curve flat near its minimum?
Show answer
Because near the minimum, the extra installed cost of a step is almost balanced by its extra saving.
If the energy price doubles, does the economic thickness go up or down?
Show answer
Up; on the kettle line it moves from 76 to 102 mm.
On a high rack, access is half the installed cost. How does that affect the economic thickness?
Show answer
It pushes it up, because access is paid whatever the thickness, so extra thickness costs relatively little.
Lesson quiz · 5 questions
Score 60% or more to complete this lesson.
Create a free account to save your progress, take quizzes and earn a certificate.