
HSE-223 · Lesson 4 of 12 · 31 min
Risk matrices: design, calibration and limits
The risk matrix is the most widely used risk tool in the world. Almost every company has one, usually a grid of 3 by 3, 4 by 4, 5 by 5 or 6 by 6 cells with likelihood on one axis, severity on the other and cells coloured green, yellow and red. HSE-103 showed how to use one. This lesson is about how to design one properly, how to calibrate its categories so that different teams get the same answer, and why risk researchers warn that poorly designed matrices can give answers that are worse than useless.
A matrix does three jobs. It ranks risks so that effort goes to the worst first. It links each risk level to a required response, such as stop work, senior management approval or routine control. And it gives people a shared language. It does these jobs well only if its categories are defined clearly, its scales match the kinds of events the organization faces, and its users understand its limits.
Defining the severity scale
Severity categories should describe outcomes in concrete terms, and most organizations use several consequence types side by side: people, environment, asset damage and business interruption, reputation and sometimes legal or community impact. The rule is to rate each scenario on every applicable column and use the worst. Each category should be clearly separated from its neighbours. Phrases such as "serious" or "significant" invite argument; descriptions such as "lost time injury" or "permanent disability or single fatality" do not.
| Level | People | Environment | Asset and production |
|---|---|---|---|
| 1 Minor | First aid only | Contained on site, cleaned up the same shift | Under $10,000 |
| 2 Moderate | Medical treatment or restricted work | Reportable release, no lasting effect | $10,000 to $100,000 |
| 3 Serious | Lost time injury | Off-site release, short-term effect | $100,000 to $1 million |
| 4 Major | Permanent disability or single fatality | Significant off-site harm, months to recover | $1 million to $10 million |
| 5 Catastrophic | Multiple fatalities | Long-term or widespread harm | Over $10 million |
Defining the likelihood scale
Likelihood scales are where most matrices go wrong. Words such as "likely" and "rare" mean very different things to different people: in studies, people asked to assign a probability to "likely" give answers from about 40 to 90 per cent. Good matrices attach numbers to each category, usually as frequency ranges per year, and make each category about ten times the one below. Many also give a plain-language anchor, such as "has happened at this site" or "has happened in the industry", to help people who are not comfortable with numbers.
| Level | Description | Frequency (per year) | Anchor |
|---|---|---|---|
| A Rare | Not expected in the life of the facility | Less than 1 in 10,000 | Not heard of in the industry |
| B Unlikely | Could happen but not expected | 1 in 1,000 to 1 in 10,000 | Has happened in the industry |
| C Possible | Might happen in the life of the facility | 1 in 100 to 1 in 1,000 | Has happened in the company |
| D Likely | Expected in the life of the facility | 1 in 10 to 1 in 100 | Has happened at this site |
| E Almost certain | Expected several times | More than 1 in 10 | Happens several times a year here |
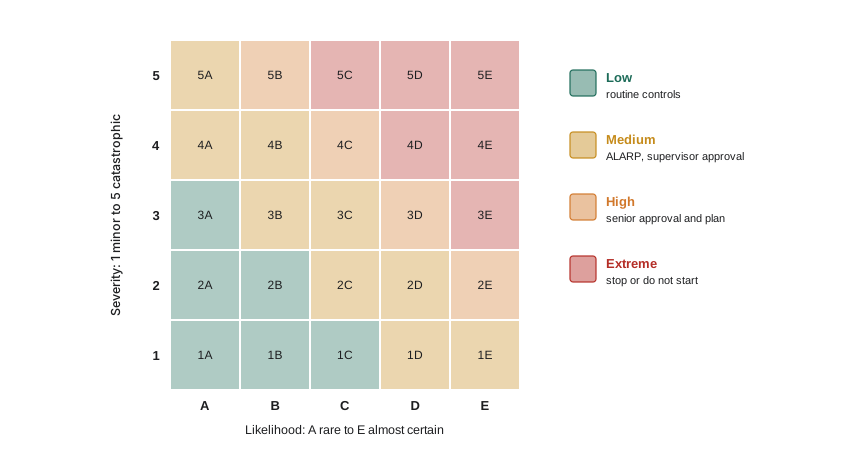
With both scales logarithmic, each cell represents a band of risk. Moving one step up in severity or likelihood multiplies the risk by about ten. That is why cell colours should run along diagonals: a 4-A (major, rare) and a 2-C (moderate, possible) are roughly comparable if the scales are designed this way. It is also why multiplying the level numbers, such as 4 times 1, has no real meaning. If the scales are logarithmic, the levels should be added, not multiplied, to rank risk consistently, or better, the cells should simply be assigned a risk level directly.
Worked problem
Adding versus multiplying
On a 5 by 5 matrix with logarithmic scales (each level ten times the last), compare two risks: risk P is severity 5, likelihood 1; risk Q is severity 2, likelihood 3. Rank them by multiplying levels and by adding levels. Which ranking reflects the actual risk?
Show solution
- Multiplying: P is \( 5 \times 1 = 5 \); Q is \( 2 \times 3 = 6 \). Q looks worse.
- Adding: P is \( 5 + 1 = 6 \); Q is \( 2 + 3 = 5 \). P looks worse.
- With logarithmic scales, actual risk is proportional to \( 10^{S} \times 10^{L} = 10^{S+L} \). P is \( 10^6 \), Q is \( 10^5 \): P is ten times higher.
- Adding matches the actual risk; multiplying reverses the order.
Answer: Adding gives the correct ranking: P is about ten times riskier than Q.
Linking cells to responses
A matrix is only useful if each risk level triggers a defined response. A typical scheme has four levels. Low risk: manage with routine procedures. Medium risk: reduce as low as reasonably practicable, with supervisor approval. High risk: senior manager approval and an action plan with dates. Extreme or intolerable: stop or do not start the work until the risk is reduced. Some companies also have a rule that any scenario with a catastrophic severity is reviewed by a more detailed method, such as LOPA, regardless of its cell, because likelihood estimates for rare events are so uncertain.
Calibration
Calibration means making sure the matrix gives consistent answers and that its risk levels match the organization's risk criteria. One method is to place known reference events on the matrix. For example, if the company's tolerable risk of a single worker fatality is 1 in 10,000 per year per scenario, the cell at major severity and rare likelihood should be the boundary between medium and high. Another method is a calibration exercise: give several teams the same five scenarios and compare their ratings. Large differences point to unclear definitions or a need for training.
Worked problem
Checking calibration against criteria
A company's criteria say: a scenario with a potential single fatality must have a frequency below 1 in 10,000 per year to be tolerable without senior approval, and below 1 in 100,000 per year to be broadly acceptable. Using the likelihood scale in this lesson, which likelihood categories for severity 4 should be coloured high, medium and low?
Show solution
- Severity 4 is a single fatality.
- Category A is below 1 in 10,000 per year. Part of A is below 1 in 100,000, but the category spans both, so A is at best medium (tolerable, reduce ALARP).
- Category B (1 in 1,000 to 1 in 10,000) exceeds the tolerable limit: high.
- Categories C, D and E are higher still: high or extreme.
- There is no category fine enough to show broadly acceptable for a fatality on this scale; the company may need a sixth, lower likelihood category or must accept that fatal scenarios are never rated low.
Answer: Severity 4: A medium, B high, C to E high or extreme; no cell qualifies as low without a finer scale.
Known limitations
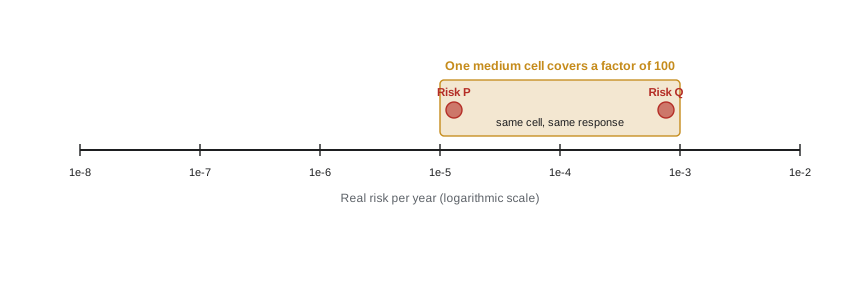
Risk analyst Louis Anthony Cox published a widely cited paper in 2008, "What's wrong with risk matrices?", showing several mathematical problems. Range compression: a matrix squeezes a huge range of real risks into a few cells, so risks that differ by a factor of 100 can share a cell. Ties and reversals: risks in different cells can be assigned the wrong order, especially when consequences and likelihood are negatively correlated, as they often are (big events are rare). Subjective inputs: the categories are judged, not measured, and people are poor at estimating rare frequencies. Ambiguous inputs and outputs: a scenario can have several outcomes with different severities, and the matrix forces the team to pick one.
Other practical problems are common. Teams game the matrix by lowering the likelihood until the colour changes to an acceptable one. Matrices are copied from other companies without checking that the categories fit. Severity is rated for the most likely outcome rather than the worst credible one, or for the worst conceivable rather than credible one, inconsistently. And the matrix encourages people to treat a number such as "12" as if it were a measurement rather than a label.
None of this means matrices should be abandoned. For screening and ranking large numbers of ordinary risks, nothing is faster, and IEC 31010 lists the consequence-likelihood matrix as a valid technique. The answer is to design matrices carefully, define the categories in numbers, use them for screening rather than final decisions on high-consequence risks, and escalate scenarios with catastrophic potential to more rigorous methods. ANSI/ASSP Z590.3 and CSA Z1002 both include example matrices and note that they should be adapted to the organization.
Worked problem
Spotting gaming
A team first rates a scenario as severity 4 (single fatality), likelihood C (possible). The cell is red, requiring a vice-president's approval. After discussion, they change the likelihood to B, giving yellow. Nothing about the controls has changed. What should a reviewer ask?
Show solution
- What evidence supports the change from C to B? Has this happened in the company? If it has, C is the honest rating by the anchor.
- Is the likelihood being lowered to avoid the approval step? That is gaming, and it defeats the purpose of the matrix.
- If the team genuinely cannot agree, the scenario is a candidate for a more rigorous method such as LOPA, which forces the frequency estimate to be broken into parts.
Answer: Ask for evidence; if none, keep C and red, or escalate to LOPA to settle the frequency.
Multiple consequence types and outcomes
Most scenarios have more than one possible outcome. A small gas leak may usually disperse harmlessly, sometimes cause a flash fire and rarely cause an explosion. Rating only the most likely outcome hides the catastrophic tail; rating only the worst conceivable outcome makes every scenario red. A practical approach is to rate the worst credible outcome and, where the team is unsure, rate two or three outcomes separately, each with its own likelihood. The highest resulting risk level governs. This takes more time but avoids the ambiguity Cox described.
Worked problem
Rating two outcomes of one scenario
A propane hose fails during cylinder filling. The team judges two outcomes: (1) release disperses with a minor cold burn, severity 1, likelihood D; (2) release ignites as a flash fire with a potential fatality, severity 4, likelihood B. Using the added levels on the scales in this lesson, which outcome governs?
Show solution
- Outcome 1: severity 1 plus likelihood D (level 4) gives 5.
- Outcome 2: severity 4 plus likelihood B (level 2) gives 6.
- Outcome 2 is about ten times higher risk and governs the rating, even though it is less likely.
Answer: The flash fire outcome governs, at about ten times the risk of the minor cold burn.
Common mistakes
MistakeUsing words such as "likely" without numbers.
InsteadDefine each likelihood category as a frequency range with an anchor.
MistakeMultiplying level numbers on logarithmic scales.
InsteadAssign risk levels to cells directly, or add levels when scales are logarithmic.
MistakeCopying another company's matrix unchanged.
InsteadCalibrate the categories against your own risk criteria and consequence types.
MistakeLowering likelihood until the cell turns yellow.
InsteadRequire evidence for ratings and change them only when controls change.
MistakeTreating the matrix as the final word on catastrophic risks.
InsteadUse it to screen and escalate catastrophic scenarios to LOPA or QRA.
Summary and key terms
- A matrix ranks risks, links levels to responses and gives a shared language.
- Severity scales use concrete descriptions across several consequence types; rate the worst column.
- Likelihood scales should be numerical, logarithmic and anchored in plain language.
- With logarithmic scales, colour bands follow diagonals and level numbers should not be multiplied.
- Calibrate the matrix against the organization's risk criteria and test it with reference scenarios.
- Cox (2008) showed range compression, ties and reversals, and subjective inputs.
- Use matrices for screening; escalate catastrophic scenarios to more rigorous methods.
- Risk matrix
- A grid ranking risk by likelihood and severity categories.
- Severity category
- A defined band of consequence, such as lost time injury.
- Likelihood category
- A defined band of frequency or probability.
- Logarithmic scale
- A scale where each step is a fixed multiple, often ten, of the last.
- Calibration
- Aligning a matrix with risk criteria and checking consistency between users.
- Range compression
- Squeezing a wide range of real risks into a few categories.
- Risk reversal
- A matrix ranking a lower risk above a higher one.
- Anchor
- A plain-language reference that helps people choose a category.
- Worst credible outcome
- The most severe outcome that could realistically happen.
- Gaming
- Adjusting ratings to reach a desired result rather than an honest one.
Practice problems
Work each problem on paper first, then reveal the answer to check.
Name three consequence types often used in a severity scale.
Show answer
People, environment, asset and production (also reputation).
Why should likelihood categories have numbers?
Show answer
Words such as "likely" are interpreted very differently by different people.
On a scale where each level is ten times the last, how much riskier is one step up in severity?
Show answer
About ten times.
Why do colour bands on a calibrated matrix follow diagonals?
Show answer
Because a step in severity and a step in likelihood both change risk by about ten times.
Risk X is S3 L4 and risk Y is S5 L1. Rank them by adding levels.
Show answer
X is 7, Y is 6, so X ranks higher.
What is range compression?
Show answer
Very different risks sharing the same cell.
Who published a well-known critique of risk matrices in 2008?
Show answer
Louis Anthony Cox Jr.
How can a company test whether its matrix is applied consistently?
Show answer
Give several teams the same scenarios and compare ratings.
What should happen to a catastrophic-severity scenario rated yellow?
Show answer
Escalate it to a more rigorous method such as LOPA.
What is the warning sign of gaming?
Show answer
Ratings change without any change in controls or evidence.
Lesson quiz · 5 questions
Score 60% or more to complete this lesson.
Create a free account to save your progress, take quizzes and earn a certificate.