
HSE-223 · Lesson 1 of 12 · 30 min
From hazard to risk: definitions, perception and risk criteria
HSE-103 introduced hazard recognition, the basic likelihood and severity matrix, job hazard analysis and the idea of reducing risk as low as reasonably practicable. This course goes further. It is about the formal methods that safety professionals, engineers and joint committees use when a simple checklist is not enough: structured task analysis, calibrated risk matrices, what-if reviews, hazard and operability studies (HAZOP), failure modes and effects analysis (FMEA), bowtie diagrams, fault trees and event trees, layer of protection analysis (LOPA) and quantitative risk assessment. Before any of those methods makes sense, the words they use must be clear, because most arguments in risk workshops are really arguments about definitions.
This first lesson sets out the vocabulary, explains why people judge risks differently from the numbers, and introduces risk criteria: the yardsticks an organization uses to decide whether a risk is acceptable, tolerable with further work, or intolerable. The course is an awareness and practitioner introduction. It prepares you to take part in formal studies and to read their results critically. It does not qualify you to facilitate a HAZOP, certify a safety instrumented system or sign off a quantitative risk assessment.
Hazard, risk and the words in between
A hazard is a source of potential harm: stored energy, a toxic chemical, a moving machine part, a height, a hostile person. ISO 31000:2018 defines risk more broadly as the effect of uncertainty on objectives, which covers financial and reputational risk as well as safety. For occupational and process safety, the working definition is narrower: risk is a combination of how likely a harmful event is and how bad its consequences would be. Most methods in this course estimate one or both of those two things.
Several other terms appear in every study. An initiating event, sometimes called a cause, is what starts a sequence: a valve left open, a seal failure, a forklift strike. A hazardous event, or top event, is the point at which control of the hazard is lost, such as a loss of containment. A consequence is the outcome: injury, fire, environmental release or lost production. Controls, safeguards and barriers are all words for the measures that prevent the event or reduce its consequences. Residual risk is what remains once those controls are in place and working.
| Term | Meaning | Example in a solvent store |
|---|---|---|
| Hazard | Source of potential harm | Flammable solvent in drums |
| Initiating event | What starts the sequence | Forklift tine punctures a drum |
| Hazardous event | Loss of control of the hazard | Solvent spill and vapour release |
| Consequence | The harm that results | Flash fire injuring the driver |
| Preventive control | Stops the event happening | Drum racking with impact guards |
| Mitigating control | Reduces the harm once it happens | Spill containment and no ignition sources |
| Residual risk | Risk with controls working | Low likelihood of a small spill, rare ignition |
Likelihood, frequency and probability
Likelihood is a general word for how probable something is. In quantitative work it is split into two different ideas that must not be mixed. Frequency is how often an event happens per unit time, for example 0.1 per year, meaning once every ten years on average. Probability is a dimensionless number between 0 and 1, for example the probability that a relief valve fails to open when demanded is 0.01. Fault trees and LOPA combine both: an initiating frequency multiplied by one or more probabilities of failure on demand gives the frequency of the final outcome. Multiplying two frequencies together, a common mistake, gives a meaningless unit of per year squared.
Severity, or consequence, is described in categories such as minor injury, lost-time injury, permanent disability and fatality, or as numbers such as the expected number of people harmed, the litres released, or the dollar cost. Many organizations use several consequence types side by side, for example people, environment, assets and reputation, and rate each scenario on the worst of them.
Worked problem
Frequency or probability?
A cooling water pump trips about twice a year. When it trips, a high-temperature alarm should alert the operator, but alarms like this are ignored or missed about one time in ten. If the operator does not respond, a reactor overheats. Estimate how often the reactor overheats, and state the units.
Show solution
- The pump trip is an initiating event with a frequency: 2 per year.
- The failed operator response is a probability on demand: 0.1, with no units.
- Outcome frequency: \( 2 \text{ per year} \times 0.1 = 0.2 \) per year.
- That is once every five years on average, which most organizations would treat as far too frequent for a serious overheating event.
Answer: About 0.2 overheating events per year, once every five years; frequency times probability gives a frequency.
Risk perception: why numbers are not the whole story
People do not judge risks only by their expected harm. Research by Paul Slovic and others since the 1970s shows that risks feel larger when they are involuntary, unfamiliar, catastrophic, invisible, unfairly distributed or controlled by someone else, and smaller when they are voluntary, familiar and under our own control. That is why a community may oppose a chemical plant whose calculated risk is lower than the risk of driving to work, and why experienced workers may underrate a task they have done safely a thousand times.
Perception matters in formal risk assessment in two ways. First, it shapes the criteria an organization and society are willing to accept: most criteria are stricter for the public than for workers, and stricter for events that could kill many people at once. Second, it biases the people in the workshop. Familiar hazards get rated too low, vivid recent incidents get rated too high, and the person with the loudest voice often sets the score. Lesson 12 returns to these biases and how a good facilitator manages them.
Risk criteria and the ALARP framework
Risk criteria are decided in advance so that the result of an assessment can be judged consistently. Without them, every study ends with the question "Is that good enough?" and the answer depends on who is in the room. ISO 31000 asks organizations to set criteria as part of establishing the context, and ISO 45001 clause 6.1 requires an organization to determine and assess OHS risks and opportunities using methods it defines.
The most widely used structure for safety criteria is the ALARP framework developed by the UK Health and Safety Executive in its 2001 document Reducing Risks, Protecting People. Risks are sorted into three regions. In the intolerable region, the risk cannot be justified except in extraordinary circumstances and must be reduced. In the broadly acceptable region, the risk is so low that further effort is rarely needed, though it must be maintained. In between is the tolerable or ALARP region, where risk is accepted only if further reduction would be grossly disproportionate in cost, time or effort to the benefit gained.
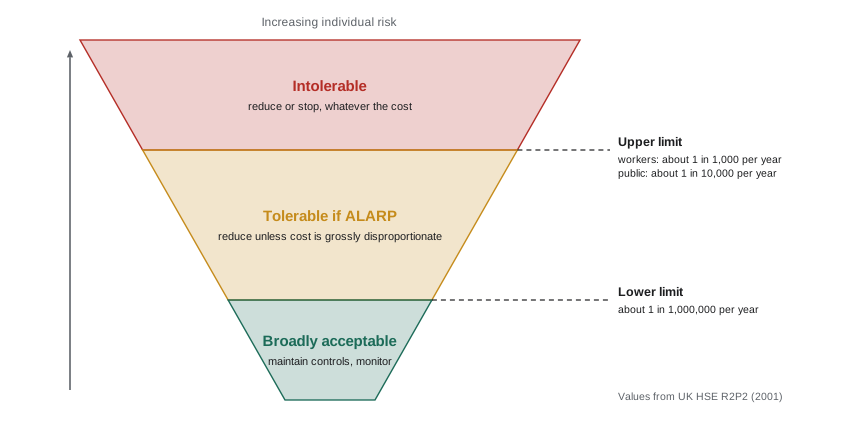
The UK boundaries are expressed as individual risk of death per year. The top boundary is about 1 in 1,000 per year for workers and 1 in 10,000 for members of the public; the bottom boundary is about 1 in a million per year for both. Other jurisdictions and companies choose different numbers, and many use frequency targets per scenario rather than individual risk. Lesson 11 covers these quantitative criteria, including the Canadian land use guidelines that grew out of the work of the Major Industrial Accidents Council of Canada (MIACC).
Canadian OHS law does not use the term ALARP, but the general duty in every jurisdiction to take every precaution reasonable in the circumstances, together with the due diligence defence recognized by the courts, works in a similar way. An employer that has identified a hazard and stopped reducing the risk while further reasonable precautions were available is exposed. CSA Z1002 and CSA Z1000 give the management-system expectations.
Worked problem
Placing a risk in the ALARP framework
A study estimates that a maintenance technician who works on a high-pressure test rig faces an individual risk of death of about 3 in 100,000 per year from rig failure. The company uses the UK boundaries for workers: intolerable above 1 in 1,000 per year, broadly acceptable below 1 in a million per year. Where does the risk sit, and what does that require?
Show solution
- Convert to the same form: 3 in 100,000 = \( 3 \times 10^{-5} \) per year.
- Top boundary for workers: 1 in 1,000 = \( 10^{-3} \) per year. The risk is below it, so it is not intolerable.
- Bottom boundary: 1 in a million = \( 10^{-6} \) per year. The risk is 30 times above it, so it is not broadly acceptable.
- The risk is in the ALARP region. The company must look for further practicable measures, such as remote operation, a blast enclosure or a lower test pressure, and adopt them unless the cost is grossly disproportionate to the benefit.
Answer: About \( 3 \times 10^{-5} \) per year, in the ALARP region; further reduction is required unless grossly disproportionate.
The risk assessment process
Whatever method is used, the overall process is the same. ISO 31000 describes it as establishing the scope, context and criteria; risk identification; risk analysis; risk evaluation; and risk treatment, surrounded by communication, consultation, monitoring and review. Identification finds what could go wrong. Analysis estimates likelihood and consequence, qualitatively or numerically. Evaluation compares the result with the criteria. Treatment selects and implements controls, using the hierarchy of controls from HSE-103, and the cycle repeats with the residual risk.
The formal methods in this course fit into that process at different points. HAZOP and what-if are mainly identification methods. Risk matrices, LOPA and quantitative risk assessment are analysis and evaluation methods. Bowties and fault trees do both, and also communicate how controls work. Choosing the right method for the question, the stage of the project and the level of risk is the subject of Lesson 2.
Worked problem
Using the same criteria for two different scenarios
A distribution centre uses a simple consequence-frequency table: any scenario that could cause a fatality must have an estimated frequency below 1 in 10,000 per year; any scenario that could cause a lost-time injury must be below 1 in 100 per year. Scenario A, a forklift striking a pedestrian in an aisle, has an estimated fatal frequency of 1 in 2,000 per year. Scenario B, a strain injury from manual handling of returns, has an estimated lost-time frequency of 1 in 50 per year. Which scenarios meet the criteria?
Show solution
- Scenario A: 1 in 2,000 = \( 5 \times 10^{-4} \) per year, against a target of \( 10^{-4} \). It exceeds the target by a factor of 5.
- Scenario B: 1 in 50 = \( 2 \times 10^{-2} \) per year, against a target of \( 10^{-2} \). It exceeds the target by a factor of 2.
- Neither meets the criteria. Scenario A is further from its target and has the worse consequence, so it gets priority, for example through physical separation of pedestrians and forklifts.
Answer: Neither meets its criterion; the forklift scenario is five times over its target and comes first.
Common mistakes
MistakeUsing hazard and risk as if they meant the same thing.
InsteadA hazard is the source of harm; risk combines how likely and how severe the harm is.
MistakeMultiplying two frequencies together in a calculation.
InsteadMultiply one frequency by probabilities on demand; the result is still a frequency.
MistakeDeciding what is acceptable only after seeing the results.
InsteadSet risk criteria in advance so results are judged consistently.
MistakeTreating the ALARP region as automatically acceptable.
InsteadRisks in the ALARP region need further reduction unless the cost is grossly disproportionate.
MistakeAssuming the numbers settle every argument.
InsteadExpect perception, fairness and catastrophic potential to shape both criteria and workshop judgements.
Summary and key terms
- This course builds on HSE-103 with formal methods: task analysis, matrices, what-if, HAZOP, FMEA, bowtie, fault and event trees, LOPA and QRA.
- A hazard is a source of harm; risk combines likelihood and consequence.
- Frequency is per unit time; probability is dimensionless. Frequency times probabilities gives a frequency.
- People perceive involuntary, unfamiliar and catastrophic risks as larger, which shapes criteria and biases workshops.
- Risk criteria should be set before an assessment so results are judged consistently.
- The ALARP framework has intolerable, tolerable and broadly acceptable regions; typical UK boundaries are 1 in 1,000 per year for workers and 1 in a million per year.
- ISO 31000 describes the process: scope and criteria, identify, analyse, evaluate, treat, with review throughout.
- Hazard
- A source of potential harm.
- Risk
- A combination of the likelihood of harm and the severity of its consequences.
- Initiating event
- The event that starts a sequence leading to harm.
- Hazardous event
- The point at which control of a hazard is lost, also called the top event.
- Frequency
- How often an event occurs per unit time, such as per year.
- Probability of failure on demand
- The chance that a safeguard fails when it is needed.
- Residual risk
- The risk that remains with controls in place.
- Risk criteria
- Reference terms against which the significance of a risk is judged.
- ALARP
- As low as reasonably practicable; further reduction is required unless grossly disproportionate.
- Risk perception
- How people judge risk, influenced by factors such as control, familiarity and dread.
Practice problems
Work each problem on paper first, then reveal the answer to check.
Define hazard and risk in one sentence each.
Show answer
A hazard is a source of potential harm; risk combines how likely harm is with how severe it would be.
A compressor trips 4 times a year and the backup fails to start 1 time in 20. How often is cooling lost?
Show answer
4 × 0.05 = 0.2 per year.
Why is multiplying two frequencies wrong?
Show answer
It produces a meaningless unit, per year squared; only frequency times probabilities gives a frequency.
Name three factors that make a risk feel larger than its numbers suggest.
Show answer
Involuntary exposure, unfamiliarity, catastrophic potential, dread, unfair distribution or lack of control.
What are the three regions of the ALARP framework?
Show answer
Intolerable, tolerable or ALARP, and broadly acceptable.
An individual risk is 2 in a million per year. Using UK boundaries, where does it sit?
Show answer
Just above the broadly acceptable boundary, in the lower part of the ALARP region.
Why set risk criteria before an assessment?
Show answer
So results are judged consistently rather than by whoever is in the room.
List the main steps of the ISO 31000 process.
Show answer
Scope, context and criteria; identification; analysis; evaluation; treatment; with communication, monitoring and review.
Give an example of a preventive control and a mitigating control for a drum store.
Show answer
Preventive: racking with impact guards. Mitigating: spill containment and control of ignition sources.
Which part of the process do HAZOP and what-if mainly support?
Show answer
Risk identification.
Lesson quiz · 5 questions
Score 60% or more to complete this lesson.
Create a free account to save your progress, take quizzes and earn a certificate.