
GEOM-360 · Lesson 6 of 12 · 20 min
Positioning at sea
A depth is useless without a position, and in a berth survey the position must be good to decimetres: a shoal assigned to the wrong place could put a dredger in the wrong spot, and a sounding that does not line up with its neighbours on overlapping lines looks like noise. On land, Coulee's surveyors set up on a point and take their time; on the water, the antenna moves at several knots, rolls and pitches, and sits metres away from the transducer whose position is actually needed. This lesson covers how hydrographic surveys are positioned horizontally and, increasingly, vertically, using GNSS, and how the position of the antenna becomes the position of each sounding.
A short history
For centuries, soundings were positioned by sextant angles to known marks ashore, plotted on a board with a station pointer. In the twentieth century, surveyors used intersection from theodolites on shore and then radio positioning systems that measured ranges or range differences from shore transmitters. Since the 1990s, GNSS has replaced them all. Differential GNSS, using corrections from coastal beacon stations or satellite-based augmentation, gave metre-level positions at sea; real-time kinematic (RTK) positioning, using carrier-phase measurements and a nearby base station or network, now gives centimetres horizontally and a few centimetres vertically. Post-processed kinematic (PPK) and precise point positioning (PPP) give similar results after the survey, without a radio link.
Horizontal positioning
For the berth survey, Northshore runs an RTK base on a control point at the terminal, tied to NAD83(CSRS) through the national network and checked against a CHS control monument. The launch's two GNSS antennas provide position and, from the baseline between them, a heading good to a few hundredths of a degree. Positions are logged in NAD83(CSRS) at the current realization and reference epoch, and projected to UTM zone 9 for the drawings; the terminal's engineers also want the site grid of the old wharf drawings, so Leah sets up a documented transformation from UTM to that grid. As a backup to the radio link, the raw GNSS data are logged for post-processing against the base and against the national active control stations, and the base's own position is confirmed by a PPP solution from Natural Resources Canada's online service.
Horizontal uncertainty of a sounding is more than the antenna's uncertainty. The position must be carried from the antenna to the transducer through the lever arm, rotated by the vessel's heading, roll and pitch; then from the transducer to the seabed along each beam, through the beam angle, the sound speed profile and the vessel's attitude at the moment of transmission and reception. For an outer beam in 17 m of water, the beam-pointing part dominates. The total horizontal uncertainty (THU) of each sounding is computed from all of these, and compared with the standard's allowance (Lesson 10).
The vertical problem
In a traditional survey, the depth below the water surface is measured by the sonar and then reduced to chart datum with a water level from a tide gauge (Lesson 2). That chain contains several corrections, each with its own error: the transducer's draft, which changes as fuel is burned; squat and settlement, which change with speed; heave, the vertical motion in waves, measured by the motion sensor; and the water level at the vessel, which differs from the level at the gauge by an amount that tide zoning only estimates. In a harbour with a seven-metre tide, or in a river with a sloping surface, the water level correction can be the largest error in the survey.
Ellipsoid-referenced surveying
RTK and PPK give the antenna's height above the ellipsoid to a few centimetres. If the antenna's height is known, and the lever arm to the transducer is known, the transducer's ellipsoid height follows, and so does the seabed's, by subtracting the measured depth below the transducer. All the water-surface corrections, draft, squat, heave and tide, disappear: the vessel is located in height directly, whatever the water is doing. What remains is to relate the ellipsoid to chart datum, using a separation model: a surface giving the height of chart datum above the ellipsoid everywhere in the survey area. This is ellipsoid-referenced surveying (ERS).
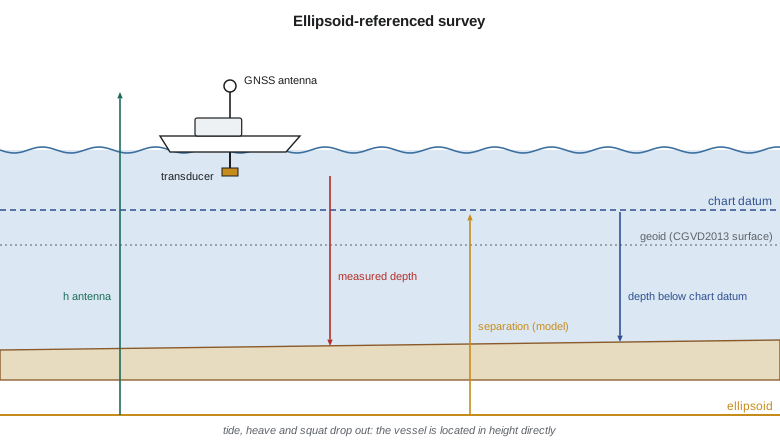
where \(h_{\text{ant}}\) is the antenna's ellipsoid height, \(L_z\) the vertical component of the lever arm rotated by the vessel's attitude, \(r_z\) the vertical distance from the transducer to the seabed along the beam, and \(N_{\text{CD}}\) the ellipsoid height of chart datum given by the separation model. On this coast both chart datum and the seabed lie below the ellipsoid, so all the heights are negative numbers; the depth below chart datum is simply the height of chart datum minus the height of the seabed.
The separation model is the key. The CHS publishes hydrographic vertical separation surfaces (HyVSEPs), which relate chart datum to the ellipsoid in NAD83(CSRS) along Canada's coasts and inland waters, built from tide gauge datums, a geoid model and ocean models. Their uncertainty varies, from a few centimetres near well-observed gauges to decimetres far offshore or in complex inlets. Before relying on the surface, Northshore checks it against its own gauge on the wharf: the gauge's chart datum, levelled to benchmarks with known ellipsoid heights, gives an independent separation at that point.
import math
# Ellipsoid-referenced survey: depth below chart datum from GNSS heights, with no tide gauge in the loop
SEP = -18.36     # separation: chart datum height above the ellipsoid at the berth, from the separation model, m
lever_up = 3.12  # antenna reference point above the transducer (vertical in the vessel frame), m
# Epochs: (ellipsoid height of antenna m, roll deg, pitch deg, range-derived depth below transducer m)
epochs = [(-11.27, 1.8, -0.6, 19.48), (-11.81, -2.4, 0.9, 19.06), (-10.95, 0.7, 0.4, 19.80), (-12.10, 3.1, -1.2, 18.71)]
print("antenna h   transducer h   seabed h   seabed below chart datum")
for h_ant, roll, pitch, dz in epochs:
    tilt = math.cos(math.radians(roll)) * math.cos(math.radians(pitch))
    h_tr = h_ant - lever_up * tilt          # rotating the lever arm by the vessel's attitude
    h_bed = h_tr - dz
    print(f"{h_ant:9.2f}   {h_tr:11.2f}   {h_bed:9.2f}   {SEP - h_bed:12.2f}")

# The same seabed by the traditional route: depth below the surface minus the tide above chart datum
# The vessel's water line rides on the tide and the waves, so heave and tide never need separating here
wl_ell = -11.27 - 3.12 + 0.42 + 0.05   # water line height at epoch 1 from the antenna (draft 0.42 m, squat 0.05 m)
tide = wl_ell - SEP
print(f"water level above chart datum implied at epoch 1: {tide:.2f} m")

# Vertical uncertainty budget (1 sigma, m) for the ellipsoid-referenced depth
parts = {'GNSS height (RTK)': 0.03, 'separation model': 0.05, 'lever arm and attitude': 0.01,
         'sound speed and range': 0.04, 'transducer draft not needed': 0.0}
s1 = math.sqrt(sum(v * v for v in parts.values()))
print(f"combined 1 sigma {s1:.3f} m -> 95 % {1.96*s1:.3f} m")
# Positioning: horizontal uncertainty of the sounding includes the antenna-to-transducer offset error
h_gnss, heading_err, offset = 0.02, math.radians(0.1), 6.5
thu = math.hypot(h_gnss, offset * heading_err) * 2.45
print(f"horizontal uncertainty of the transducer at 95 %: {thu:.3f} m")antenna h transducer h seabed h seabed below chart datum -11.27 -14.39 -33.87 15.51 -11.81 -14.93 -33.99 15.63 -10.95 -14.07 -33.87 15.51 -12.10 -15.21 -33.92 15.56 water level above chart datum implied at epoch 1: 4.44 m combined 1 sigma 0.071 m -> 95 % 0.140 m horizontal uncertainty of the transducer at 95 %: 0.056 m
The four epochs come from the same spot on the berth's east side, logged a few seconds apart as the launch rolled and pitched in a wake. The antenna heights vary by more than a metre because of the waves, but the seabed heights agree to about 0.1 m, and the depths below chart datum come out between 15.51 and 15.63 m. No heave, tide or draft correction was applied; the vessel's motion is in the GNSS heights themselves. The water level implied at the first epoch, 4.44 m above chart datum, can be compared with the wharf gauge as an independent check. The vertical budget, dominated by the separation model and the sound speed, gives 0.14 m at 95 percent, and the horizontal position of the transducer is good to about 6 cm.
Daily checks
Positioning systems fail quietly, so a survey builds in checks. Each morning, before leaving the wharf, Grant places the launch alongside a mark on the wharf face whose position and height were surveyed from the control network, and compares the GNSS-derived transducer position and height with the known values. During the survey, the acquisition software flags any epoch when the RTK solution drops from a fixed to a float solution, and those epochs are reprocessed by PPK or rejected. Once a week, the base station's position is recomputed from a fresh static session, to catch a bumped tripod or a corrupted configuration. Overlapping lines and cross lines provide a final check: if the positioning were off, features and slopes would not line up between lines run in different directions, and the depths at crossings would disagree. Each check is recorded in the survey log, because the client and the charting office will ask how the survey proved its positioning.
Heave and GNSS heights
GNSS heights are noisier over seconds than a motion sensor's heave, and they can drop out under bridges or near tall cranes. Most ERS systems therefore combine the two: the motion sensor provides the fast vertical motion, and GNSS provides the slow, absolute level, blended in an inertial navigation solution or by filtering. Tightly coupled GNSS-inertial systems, processed after the survey with precise orbits, give the best results, bridging GNSS outages of a minute or more with little loss. The launch's system logs everything needed for this processing, and Leah processes each day's navigation in post-processing software before merging it with the sonar data.
Latency and timing
Every measurement must be stamped with the time it was made, on one clock. If the position arrives 50 ms late relative to the pings, a launch at 6 knots places each sounding 15 cm behind its true position, and a slope surveyed in opposite directions shows two offset surfaces. Modern systems distribute GNSS time with a pulse-per-second signal and time-stamp each data stream at the sensor, so latency is small and constant, but it must still be measured during calibration (Lesson 7). The traditional test is to run the same line over a slope or a distinctive feature in the same direction at two very different speeds: a latency error displaces the feature by an amount proportional to speed.
Positioning inland
On the reservoir and the St. Mary River, positioning is simpler: the district's RTK base is already set up on the canal control network from earlier projects, and the boat's antenna is mounted directly above the transducer, so the lever arm is a single measured height. On the river, ERS is the natural method, because the sloping water surface makes gauge reductions awkward; Grant computes the bed elevation at every sounding as the antenna's height on CGVD2013 minus the antenna-to-transducer height and the measured depth, using the geoid model to convert ellipsoid heights. Near the canyon walls downstream, where satellites are blocked, he falls back on the motion-free water surface measured with RTK at the ends of each section.
Worked problem
Seabed depth by ERS
An antenna's ellipsoid height is \(-12.40\) m. The transducer is 3.10 m below the antenna (vessel level). The sonar measures 18.25 m below the transducer at nadir. The separation model gives chart datum at \(-18.36\) m on the ellipsoid. Find the depth below chart datum.
Show solution
- \[h_{\text{tr}} = -12.40 - 3.10 = -15.50\ \text{m}\]
- \[h_{\text{bed}} = -15.50 - 18.25 = -33.75\ \text{m}\]
- \[d_{\text{CD}} = -18.36 - (-33.75) = 15.39\ \text{m}\]
Answer: The seabed is 15.39 m below chart datum, with no tide, heave or draft correction needed.
Common mistakes
MistakeUsing ERS without checking the separation model against a gauge.
InsteadVerify the separation at a levelled gauge or benchmark before relying on it.
MistakeApplying heave and tide corrections on top of an ERS solution.
InsteadERS heights already contain the vessel's motion and the tide; adding them double-counts.
MistakeIgnoring the coordinate realization and epoch.
InsteadState them; frames such as NAD83 realizations differ by centimetres to decimetres.
MistakeAssuming latency is zero because the clocks are synchronized.
InsteadMeasure it in calibration; buffering can still delay data.
Summary and key terms
- GNSS (RTK, PPK, PPP) positions modern surveys to centimetres horizontally and a few centimetres vertically.
- Sounding THU combines antenna position, lever arms, heading and beam pointing.
- Traditional vertical reduction needs draft, squat, heave and tide, each with errors.
- ERS locates the vessel in height directly and uses a separation model to reach chart datum.
- CHS HyVSEPs relate chart datum to the NAD83(CSRS) ellipsoid; check them at a gauge.
- One clock for all sensors; latency is measured and corrected.
- RTK
- Real-time kinematic GNSS positioning using carrier phase and a base or network.
- PPK
- Post-processed kinematic GNSS positioning.
- Ellipsoid-referenced survey (ERS)
- A survey whose depths are computed from GNSS ellipsoid heights and a separation model.
- Separation model
- A surface giving the height of chart datum (or another datum) above the ellipsoid.
- Lever arm
- The measured offset between sensors in the vessel's frame.
- Latency
- A time delay between when a measurement is made and when it is stamped.
- THU
- Total horizontal uncertainty of a sounding.
Practice problems
Work each problem on paper first, then reveal the answer to check.
A launch at 8 knots has 40 ms of position latency. How far are soundings displaced?
Show answer
About 0.16 m along track.
Why does ERS not need a heave correction?
Show answer
The GNSS heights already include the vessel's vertical motion.
Antenna height −10.00 m, transducer 3.00 m below, depth 20.00 m, chart datum at −17.00 m. Depth below chart datum?
Show answer
16.00 m.
Name two sources of horizontal uncertainty in an outer-beam sounding.
Show answer
Beam pointing (attitude, refraction) and heading with lever arms.
Why check a separation model at a levelled gauge?
Show answer
To verify the model independently where its error is unknown.
Lesson quiz · 5 questions
Score 60% or more to complete this lesson.
Create a free account to save your progress, take quizzes and earn a certificate.