
GEOM-360 · Lesson 2 of 12 · 20 min
Tides and water levels
An echo sounder measures depth below the transducer, but the water surface it rides on rises and falls with the tide. At the Prince Rupert berth the difference between low and high water on a large tide is about seven metres, more than the depth of the shoal the client is worried about. A sounding taken at high water and one taken at low water over the same spot differ by the whole tidal range, so before any depth can be charted or compared with a design, it must be reduced to a fixed vertical reference: chart datum. Theo, who has never worked with tides, spends his first week at Northshore learning how water levels are measured, predicted and turned into datums.
Why the tide rises and falls
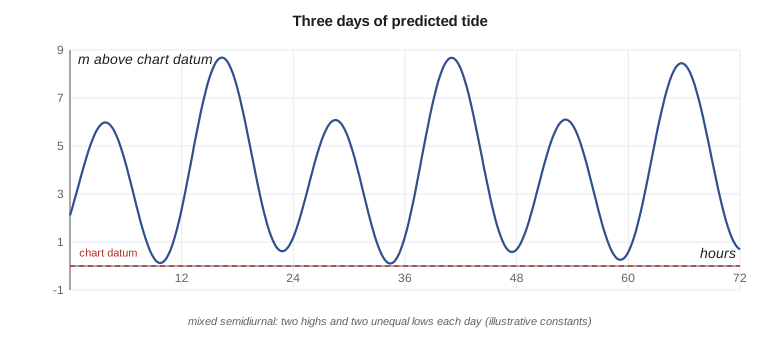
Tides are caused by the gravitational pull of the Moon and the Sun on the rotating Earth. The Moon's pull is stronger on the side of the Earth nearest to it and weaker on the far side; the difference stretches the oceans into two bulges, one toward the Moon and one away. As the Earth turns beneath them, most coasts pass through two highs and two lows in about 24 hours 50 minutes, the length of the lunar day. The Sun produces a similar but smaller effect. When Sun and Moon line up, at new and full moon, their effects add and tides have their largest range (spring tides); at the quarter moons they partly cancel (neap tides). Because the Moon's orbit is tilted to the equator, the two daily tides are often unequal, giving the mixed tides of the Pacific coast of North America, with a higher high water, a lower high water, a higher low water and a lower low water each day.
The real ocean does not respond like a simple bulge. Tides travel as long waves around ocean basins, shaped by coastlines, depths and the Earth's rotation, and are amplified or damped as they enter bays and inlets. The result is that the tide at each place has its own character, which can only be learned by measuring it. That is the job of tide gauges, and of the long records that national agencies keep at their reference stations.
Measuring water levels
A tide gauge measures the height of the water surface relative to a fixed reference on land. Older gauges used a float in a stilling well, a vertical pipe that damps waves; modern gauges use acoustic or microwave sensors looking down at the water, or pressure sensors on the seabed, with the record sampled every few minutes and sent by satellite or cellular link. A gauge is only useful if its zero is tied to benchmarks ashore by precise levelling, and those ties are checked regularly; otherwise a settling wharf or a bumped sensor would quietly corrupt every reduced depth.
The CHS operates a network of permanent water level stations on all three coasts, the Great Lakes and the St. Lawrence. Its Integrated Water Level System delivers observed levels, predictions and forecasts through its website and web services. For a survey away from a permanent station, the surveyor installs a temporary gauge, levels it to nearby benchmarks, and runs it for the length of the survey, ideally a month or more so that its record can be compared with the permanent station to transfer the datum. Northshore installs a radar gauge on the terminal's existing wharf and ties it to two CHS benchmarks.
Transferring a datum to a temporary gauge uses simultaneous comparison. Over the same month, the mean level and the range at the temporary gauge are compared with those at the reference station, whose long-term datums are known. If the temporary gauge's monthly mean sits 0.12 m above the reference's monthly mean and its range is 4 percent larger, the long-term datum at the temporary site is estimated from the reference's datum with those differences applied. A month gives a datum good to a few centimetres in a well-behaved harbour; longer comparisons do better, and a short comparison during a storm or a river freshet can do much worse. The comparison also exposes problems with the gauge itself, such as a sensor that drifts or a stilling well that silts up.
Tidal datums
A tidal datum is a reference level defined by a particular phase of the tide averaged over a long period: mean sea level, mean high water, mean lower low water and so on. Chart datum is chosen low, so that the water seldom falls below it and charted depths are, most of the time, the least depth a mariner will find. Heights on land and clearances under bridges are referred to a high-water datum, so that the charted clearance is the least the mariner can expect.
Canadian charts use a low-water chart datum chosen so that the water level seldom falls below it. On many Pacific coast charts it is lower low water, large tide (LLWLT), the average of the lowest low waters, one from each of 19 years of predictions; elsewhere other definitions are in use, and the CHS is moving toward lowest astronomical tide on new charts. Heights of features and clearances under bridges and cables are referred to higher high water, large tide (HHWLT). Every Canadian chart states its datums in its title block, and the surveyor must work to the datum of the chart the survey will update.
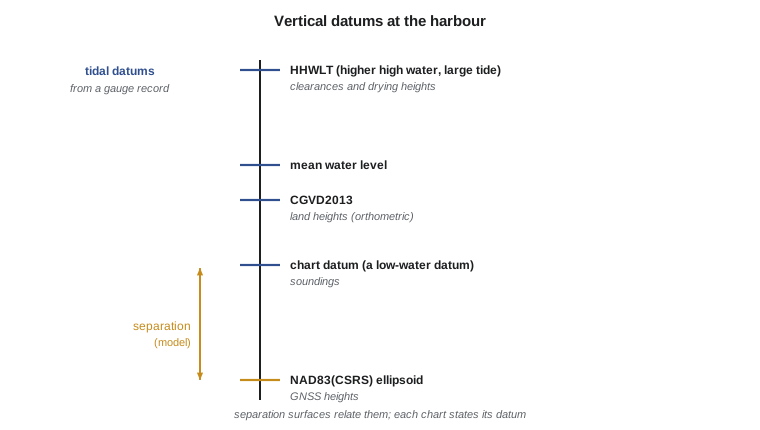
Tidal datums vary from place to place along a coast, because the tidal range varies. A datum computed at one gauge applies only near that gauge. Between gauges, surveyors use tide zoning or, increasingly, continuous separation models that give the height of chart datum above the ellipsoid everywhere in a region (Lesson 6). Those models make it possible to survey without a gauge in the loop, using GNSS heights directly, but they must be checked against gauges.
Harmonic analysis and prediction
The tide at a place can be described as the sum of many sinusoidal constituents, each tied to an astronomical cycle. The principal lunar semidiurnal constituent, M2, has a period of 12.42 hours; the principal solar semidiurnal S2 has exactly 12 hours; N2 accounts for the Moon's varying distance; K1 and O1 are the main diurnal constituents. Harmonic analysis of a long record gives the amplitude and phase of each constituent at that place, and the prediction is then
where \(Z_0\) is the mean level above chart datum, \(A_i\) and \(g_i\) are the amplitude and phase lag of constituent \(i\), \(\omega_i\) its angular speed, and the nodal factors \(f_i\) and \(u_i\) and the astronomical argument \(V_0\) adjust for the slowly varying astronomy. National agencies analyse dozens of constituents; five carry most of the energy at a typical Pacific harbour. Predictions are excellent for astronomical tides, but the actual water level also responds to weather: onshore winds and low air pressure raise it, offshore winds and high pressure lower it, and river flow adds its own variation. The difference between observed and predicted levels can reach tens of centimetres in a storm, which is why surveys reduce soundings with observed water levels, not predictions.
Reducing soundings
The traditional reduction subtracts the water level above chart datum at the moment of each sounding from the depth measured below the water surface (after correcting for the transducer's draft and the vessel's squat and heave):
where \(\eta(t)\) is the observed water level above chart datum. When the water is below chart datum, \(\eta\) is negative and the reduced depth is greater than the measured one. If the survey area is some distance from the gauge, the tide arrives there earlier or later and with a different range; tide zoning divides the area into zones, each with a time correction and a range ratio relative to the gauge. Errors in zoning are often the largest single source of vertical uncertainty in a traditional survey, which is one reason ellipsoid-referenced surveying has spread so quickly.
import math
# Illustrative harmonic constants for the harbour gauge: (name, speed deg/h, amplitude m, phase deg)
CON = [('M2', 28.9841042, 2.30, 110.0), ('S2', 30.0000000, 0.75, 140.0),
       ('N2', 28.4397295, 0.45, 85.0), ('K1', 15.0410686, 0.85, 255.0),
       ('O1', 13.9430356, 0.50, 240.0)]
Z0 = 3.90   # mean water level above chart datum, m
def tide(t_h):
    """Predicted water level above chart datum (m) at t hours from the start of the record."""
    return Z0 + sum(a * math.cos(math.radians(w * t_h - g)) for _, w, a, g in CON)

# One year of hourly predictions: find the lowest level, mean lower low water and the range
levels = [tide(t) for t in range(0, 24 * 365)]
low = min(levels); high = max(levels)
daily_low = [min(levels[d * 24:(d + 1) * 24 + 1]) for d in range(364)]
print(f"lowest predicted level in the year {low:+.2f} m, highest {high:+.2f} m")
print(f"mean of daily lowest waters {round(sum(daily_low)/len(daily_low), 2) + 0.0:+.2f} m above chart datum")

# Tide reduction: soundings measured from the water surface, logged with time
obs = [(9.25, 21.37), (9.50, 21.02), (9.75, 20.61), (10.00, 20.24)]  # (hour, depth below surface m)
print(" hour   measured   water level   reduced to chart datum")
for t, d in obs:
    wl = tide(t)
    print(f"{t:5.2f}   {d:7.2f}   {wl:9.2f}     {d - wl:8.2f}")

# Zoning: the survey area lies between gauges; apply a time lag and a range ratio
lag_h, ratio = 0.25, 1.06
t = 9.50
wl_zone = Z0 + ratio * (tide(t - lag_h) - Z0)
print(f"zone-corrected water level at {t} h: {wl_zone:.2f} m (gauge {tide(t):.2f} m)")lowest predicted level in the year +0.08 m, highest +8.68 m mean of daily lowest waters +1.17 m above chart datum hour measured water level reduced to chart datum 9.25 21.37 0.21 21.16 9.50 21.02 0.14 20.88 9.75 20.61 0.13 20.48 10.00 20.24 0.16 20.08 zone-corrected water level at 9.5 h: -0.01 m (gauge 0.14 m)
With these illustrative constants, the lowest predicted level in the year is 0.08 m above chart datum, consistent with a datum defined near the lowest tides, and the highest is 8.68 m, a range typical of the north coast. The four soundings were taken over a falling and turning tide near low water, so the water level was only 0.13 to 0.21 m above chart datum and the reductions are small; at high water the same spots would have read seven or eight metres deeper. The zone correction shows how much a quarter-hour lag and a 6 percent range difference matter near low water: 0.15 m, more than half the vertical allowance for a high-order survey.
Water levels inland
Inland waters have no tide worth the name, but their levels still change. The district's reservoir rises and falls by metres over a season as water is stored and released, and the St. Mary River rises with snowmelt and summer storms. For the reservoir sonar survey, Grant reads the district's reservoir gauge at the start, middle and end of each day and Leah reduces soundings to elevations on the district's vertical datum (CGVD2013) rather than to depths below the water surface. On the river, the water surface slopes downstream, so a single gauge reading does not apply along the whole reach; Grant measures the water surface with RTK at the start and end of each cross-section, or uses GNSS heights on the boat directly.
Worked problem
Reducing a sounding
A sounding of 19.84 m below the water surface is logged at 14:20. The gauge reads 2.37 m above the low-water datum at 14:00 and 2.61 m at 14:30. The survey zone lags the gauge by 10 minutes with a range ratio of 1.00. Find the reduced depth.
Show solution
- \text{The zone lags by 10 minutes, so use the gauge level at 14:10.}
- \[\eta(14{:}10) = 2.37 + \frac{10}{30}(2.61 - 2.37) = 2.45\ \text{m}\]
- \[d = 19.84 - 2.45 = 17.39\ \text{m}\]
Answer: The reduced depth is 17.39 m below the low-water datum.
Common mistakes
MistakeReducing soundings with predicted tides alone.
InsteadUse observed water levels; weather can move the sea tens of centimetres.
MistakeApplying a gauge's datum far from the gauge without zoning or a separation model.
InsteadTidal range and timing change along a coast.
MistakeForgetting to level the gauge to benchmarks.
InsteadWithout a levelled zero, a moved sensor shifts every depth.
MistakeAssuming the water never falls below chart datum.
InsteadIt can, on extreme tides and in offshore winds; reduced depths then exceed measured ones.
Summary and key terms
- Tides come from the Moon's and Sun's pull on the rotating Earth, shaped by basins and coasts.
- Canadian charts use a low-water chart datum (often LLWLT on the Pacific coast) and HHWLT for heights.
- Gauges must be levelled to benchmarks and run long enough to transfer a datum.
- Harmonic constituents (M2, S2, N2, K1, O1 and more) predict the astronomical tide.
- Soundings are reduced with observed water levels, zoned for timing and range away from the gauge.
- Inland, reduce to the vertical datum with gauge readings or GNSS heights; rivers slope.
- Tide gauge
- An instrument recording water level against a fixed reference.
- Tidal datum
- A reference level defined by averaging a phase of the tide over a long period.
- Chart datum
- The low-water datum to which charted depths are referred.
- Harmonic constituent
- A sinusoidal component of the tide tied to an astronomical cycle.
- Tide zoning
- Dividing a survey area into zones with time and range corrections from a gauge.
- Spring tide
- A tide of large range near new and full moon.
- Mixed tide
- A tide with two unequal highs and lows each day.
Practice problems
Work each problem on paper first, then reveal the answer to check.
What is the period of the M2 constituent?
Show answer
About 12.42 hours.
Why are tidal datums averaged over 19 years?
Show answer
To span the 18.6-year cycle of the Moon's orbit.
The water level is 0.30 m below chart datum and the measured depth is 16.10 m. What is the reduced depth?
Show answer
16.40 m.
Why are bridge clearances referred to a high-water datum?
Show answer
So the charted clearance is the least the mariner can expect.
Why can't one gauge reading reduce a whole river reach?
Show answer
The water surface slopes downstream.
Lesson quiz · 5 questions
Score 60% or more to complete this lesson.
Create a free account to save your progress, take quizzes and earn a certificate.