
GEOM-360 · Lesson 1 of 12 · 20 min
Hydrography and charting
Coulee Geomatics has spent its working life on land: control networks, canal staking, lidar of the irrigation district's headworks and, last autumn, a topobathymetric survey of the district's storage reservoir. This year the firm takes its first marine contract. A terminal operator, North Coast Gateway Terminals, plans a new container berth on the east side of Prince Rupert harbour, and it needs a survey of the berth pocket, the approach and the slopes beside them before design and dredging begin. Ruth Albrecht, the firm's principal, has teamed up with Northshore Hydrographic, a small Prince Rupert company led by Mira Sandvik, a hydrographer trained in charting surveys. Ines Dahl, who led the reservoir lidar, will run Coulee's side of the work; Leah Tran will handle data processing and quality control, Theo Martel the sound speed and tide data, and Grant Okonkwo the boat and the equipment. Back home, the district wants the reservoir's deep pool surveyed by sonar and a new pump intake on the St. Mary River mapped. This course follows all three jobs.
What hydrography is
Hydrography is the branch of applied science that measures and describes the physical features of oceans, seas, coastal areas, lakes and rivers, and predicts how they change, mainly for the safety of navigation and in support of other marine activities. Its core product is depth: where the bottom is, how certain we are of it, and what lies on it that could harm a ship or a structure. Around that core, a hydrographer also measures water levels and tides, currents, the shape of the shoreline, the positions of navigation aids and wrecks, and the nature of the seabed. The International Hydrographic Organization (IHO), founded in 1921 as the International Hydrographic Bureau, coordinates national hydrographic offices and publishes the standards they share.
Most hydrographic surveying is done for one of four purposes. Charting surveys feed nautical charts used by mariners. Engineering surveys support the design and construction of ports, bridges, pipelines, outfalls and offshore structures. Dredging surveys measure depths before, during and after dredging so that the work can be designed, controlled and paid for. Monitoring surveys track change: sediment building up in a reservoir, scour around a bridge pier, erosion of a riverbank. The same instruments serve all four, but the specifications differ, and a surveyor must know which purpose a survey serves before planning it.
Who charts the waters
In Canada, the Canadian Hydrographic Service (CHS), part of Fisheries and Oceans Canada, surveys Canadian waters and publishes the nautical charts, tide tables and sailing directions that mariners rely on. The Canadian Coast Guard maintains aids to navigation and broadcasts safety information, and notices to mariners carry corrections to charts. Port authorities, including the Prince Rupert Port Authority, commission surveys of their own harbours, and the CHS adopts suitable surveys into its charts after review. Northshore's survey of the berth will first serve the terminal's engineers, but Mira plans it to charting quality so that the CHS can use it to update the chart once the berth is built.
Charts have changed more in the last thirty years than in the previous two hundred. Paper charts are still printed, but most commercial ships now navigate with electronic navigational charts (ENCs) displayed on an electronic chart display and information system. ENCs follow the IHO's S-57 standard, and the IHO's newer S-100 framework is replacing it with a family of product specifications: S-101 for the next generation of ENCs, S-102 for high-resolution bathymetric surfaces, S-104 for water levels and S-111 for surface currents, among others. S-102 is especially important to surveyors, because it lets the gridded depth surface that comes out of a modern multibeam survey reach the ship's display almost unchanged, rather than being thinned to a few hundred selected soundings.
Depths, not averages
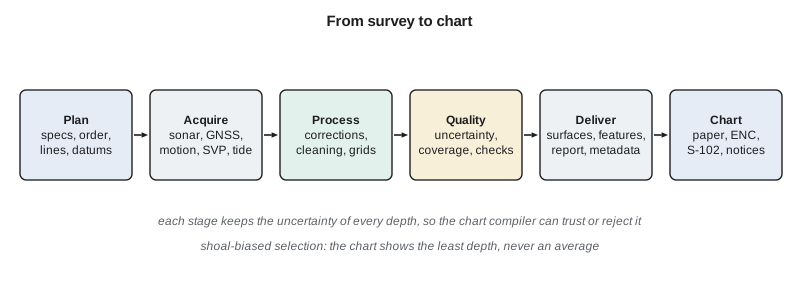
A nautical chart shows depths that a mariner can trust not to be too deep. If a survey finds a rock at 16.9 m in an area where the surrounding bottom is at 18.5 m, the chart must show the rock, because the ship cannot steer around an average. This principle, called shoal biasing, runs through every stage of hydrographic work. When thousands of soundings are reduced to the few that fit on a chart, the shoalest sounding in each area is kept. When a depth is rounded for display, it is rounded toward the shallower value. When a survey cannot prove that an area is clear of hazards, the chart says so. A hydrographer who smooths away a real shoal to make a tidy surface has made the most serious mistake in the profession.
The second principle is that every depth comes with an uncertainty. A depth of 17.32 m means little unless we know whether it is good to 0.1 m or to 1 m. Modern hydrographic surveys compute a total propagated uncertainty (TPU) for each sounding from the uncertainties of every measurement that contributed to it: the range measured by the sonar, the beam angle, the sound speed in the water, the vessel's attitude and position, the water level. Lessons 6, 7 and 10 build this uncertainty piece by piece. The third principle is coverage: a chart compiler must know whether the bottom was seen everywhere or only along lines with gaps between them. Older charts were compiled from lead-line and single-beam soundings along lines tens or hundreds of metres apart; modern surveys aim for full coverage of the bottom.
What the berth needs
The client's first question is simple: is the water deep enough, and if not, how much must be dredged? Answering it begins with the ship. The design vessel for the berth is a container ship with a static draught of 15.5 m. When a ship moves through shallow water it sinks lower and trims, an effect called squat, because the water flowing past the hull speeds up and its pressure falls. The ship also heaves, rolls and pitches in waves and swell. Port designers add allowances for each effect and a net safety margin, and the hydrographer adds an allowance for survey uncertainty and for sediment that may settle between surveys. The sum is the depth that must exist below chart datum, the low-water reference from which charted depths are measured (Lesson 2).
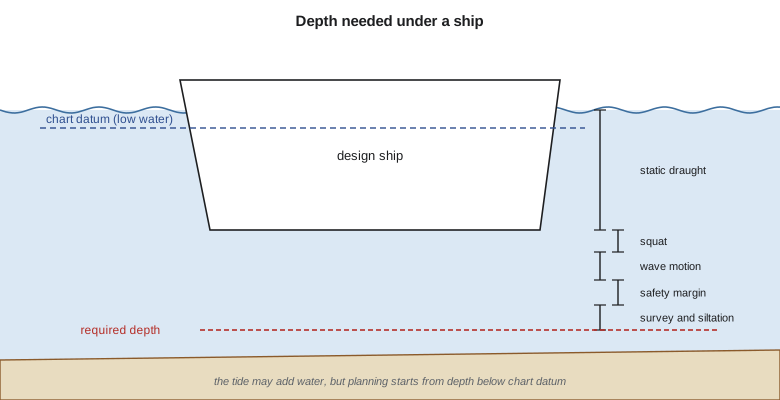
Squat depends on the ship's speed, its fullness (block coefficient) and how much of the channel's cross-section the hull blocks. Simple formulas, such as Barrass's, give squat roughly in proportion to the block coefficient and the square of the speed, doubling in confined channels. Real port design uses more careful methods and often ship-simulator studies, but the simple formula is enough to see how the pieces fit. The code below computes the required depth for the design ship and then looks at a handful of soundings from the approach, showing why the chart must show the shoalest sounding in each block rather than the mean.
import math
# Design vessel for the new berth approach (illustrative values)
draught = 15.5          # static draught, m
cb = 0.65               # block coefficient
speed_kn = 8.0          # speed through the approach, knots
blockage = 'open'       # 'open' water or 'confined' channel
wave_allow = 0.6        # allowance for wave-induced motion, m
safety = 0.5            # net under-keel safety margin, m
sounding_unc = 0.3      # allowance for survey and siltation uncertainty, m

# Barrass's simple squat estimate: Cb * V^2 / 100 in open water, about twice that when confined
squat = cb * speed_kn ** 2 / 100.0 * (2.0 if blockage == 'confined' else 1.0)
need = draught + squat + wave_allow + safety + sounding_unc
print(f"squat {squat:.2f} m")
print(f"required depth below chart datum {need:.2f} m ({need/0.3048:.1f} ft)")

# Shoal-biased selection: a chart shows the SHOALEST sounding in each block, never an average
soundings = [  # (easting m, northing m, depth m below chart datum)
    (12, 8, 18.42), (37, 15, 18.10), (55, 9, 17.96), (71, 22, 18.25), (88, 31, 17.41),
    (19, 44, 18.66), (42, 52, 16.88), (63, 47, 17.73), (79, 58, 18.04), (95, 41, 18.31),
    (8, 77, 18.90), (33, 81, 18.55), (51, 69, 17.20), (74, 88, 18.12), (91, 72, 18.48)]
block = 50.0
cells = {}
for e, n, d in soundings:
    key = (int(e // block), int(n // block))
    cells.setdefault(key, []).append(d)
print("block   n   shoalest   mean")
for key in sorted(cells):
    ds = cells[key]
    print(f"{key}  {len(ds):2d}   {min(ds):6.2f}   {sum(ds)/len(ds):6.2f}")
shoal = min(d for _, _, d in soundings)
print(f"least depth in the area {shoal:.2f} m; margin over the required depth {shoal - need:+.2f} m")
# Charted soundings are truncated (rounded toward shallower) to 0.1 m
print("charted values:", [math.floor(min(v) * 10) / 10 for k, v in sorted(cells.items())])squat 0.42 m required depth below chart datum 17.32 m (56.8 ft) block n shoalest mean (0, 0) 3 18.10 18.39 (0, 1) 3 16.88 18.11 (1, 0) 5 17.41 17.93 (1, 1) 4 17.20 17.96 least depth in the area 16.88 m; margin over the required depth -0.44 m charted values: [18.1, 16.8, 17.4, 17.2]
The required depth comes to 17.32 m below chart datum. The soundings in the upper left block average 18.11 m, comfortably deeper than required, but the shoalest is 16.88 m, 0.44 m too shallow. A chart that showed the mean would invite the ship onto a shoal. Charted values are truncated to the decimetre, toward shallower, so the 16.88 m sounding is charted as 16.8. This one shoal, found by Northshore's reconnaissance line, is why the terminal's engineers asked for a full-coverage survey with an object search: they need to know whether it is a mound of sediment that dredging will remove easily or a rock outcrop that will need drilling and blasting.
From lead line to multibeam
For most of history, depth was measured with a lead line: a weight on a marked line, dropped over the side, with tallow in a hollow in the weight to pick up a sample of the bottom. Echo sounders arrived in the 1920s and replaced the lead line within a few decades, measuring depth from the travel time of a sound pulse. Single-beam sounders, described in Lesson 4, measure one depth below the vessel at each ping, so a survey consists of lines of soundings with gaps between them. Side-scan sonar, from the 1960s, images the seabed on either side of a towed body and finds wrecks and obstructions that lines of soundings could miss. Multibeam echo sounders, developed for military and research use and in widespread commercial use since the 1990s, measure hundreds of depths across a swath at each ping, and made full-coverage surveys routine.
Positioning followed the same path, from sextant angles to shore stations, through radio positioning systems to GNSS. Today a survey launch carries a multibeam echo sounder, a GNSS receiver giving centimetre positions and heights, an inertial motion sensor measuring roll, pitch, heave and heading, a sound speed sensor at the transducer and a profiler for the water column, and acquisition software that time-stamps everything to the microsecond. The surveyor's job has shifted from collecting soundings to managing a system: calibrating it, monitoring it, and proving that its output meets the specification.
The survey plan
Mira and Ines draft the plan for the berth survey together. It names the purpose (engineering design and future charting), the area (berth pocket, approach, side slopes and a buffer), the standard to be met (an IHO S-44 order, Lesson 10), the coverage (full coverage with a search for objects of a stated size), the datums for position and depth (Lessons 2 and 6), the equipment and its calibration (Lesson 7), how sound speed will be measured and how often (Lesson 3), the deliverables (a gridded surface with uncertainty, a feature file, a report and metadata), and the schedule, including tide windows for the shallow margins. The plan also covers safety, communications with the harbour master and vessel traffic services, and environmental limits on work near the terminal's fish habitat.
Because the berth lies in a busy commercial harbour, Grant arranges with the port authority and Marine Communications and Traffic Services for the launch to work within published restrictions, and the crew file daily plans so that ship movements and survey lines do not conflict.
Worked problem
Required depth for a smaller ship
A bulk carrier with a static draught of 13.0 m and a block coefficient of 0.82 transits an open approach at 7 knots. The port allows 0.5 m for wave motion, a 0.6 m net safety margin and 0.3 m for survey uncertainty. Estimate the required depth below the low-water datum using Barrass's open-water formula.
Show solution
- \[S = C_b\,\frac{V^2}{100} = 0.82 \times \frac{7^2}{100} = 0.40\ \text{m}\]
- \[d = 13.0 + 0.40 + 0.5 + 0.6 + 0.3 = 14.80\ \text{m}\]
Answer: About 14.8 m below the low-water datum. A full-bodied bulk carrier squats more than a fine container ship at the same speed.
Common mistakes
MistakeAveraging soundings to produce a charted depth.
InsteadKeep the shoalest sounding; charts are shoal-biased.
MistakeRounding depths to the nearest decimetre for a chart.
InsteadTruncate toward shallower values.
MistakePlanning a survey without stating its purpose and standard.
InsteadName the purpose, the order and the coverage first; they drive every other choice.
MistakeTreating a depth as exact.
InsteadReport every depth with its uncertainty.
Summary and key terms
- Hydrography measures depth, water levels and seabed features, mainly for safe navigation and marine engineering.
- The CHS charts Canadian waters; port authorities commission surveys that the CHS may adopt.
- ENCs follow S-57 today; S-100 products such as S-101 and S-102 are replacing it.
- Charts are shoal-biased: the least depth is kept, and rounding goes toward shallower.
- Every depth needs an uncertainty and every survey a statement of coverage.
- Required depth = draught + squat + wave allowance + safety margin + survey allowance.
- Hydrography
- The science of measuring and describing water bodies, mainly for navigation.
- Shoal biasing
- Choosing or rounding depths toward the shallower value so charts err on the safe side.
- Electronic navigational chart (ENC)
- An official vector chart for electronic chart systems.
- S-102
- The IHO product specification for high-resolution bathymetric surfaces.
- Squat
- The sinkage and trim of a moving ship in shallow water.
- Total propagated uncertainty (TPU)
- The combined uncertainty of a sounding from all its error sources.
- Chart datum
- The low-water reference surface from which charted depths are measured.
Practice problems
Work each problem on paper first, then reveal the answer to check.
Why does a chart show the shoalest sounding in an area rather than the mean?
Show answer
Ships must avoid the shallowest point; an average hides hazards.
A sounding of 15.37 m is to be charted to 0.1 m. What value is shown?
Show answer
15.3 m.
Name two IHO S-100 product specifications and what they carry.
Show answer
S-101 next-generation ENCs; S-102 bathymetric surfaces (also S-104 water levels, S-111 currents).
What happens to squat if a ship's speed doubles?
Show answer
It roughly quadruples.
List four purposes of hydrographic surveys.
Show answer
Charting, engineering, dredging and monitoring.
Lesson quiz · 5 questions
Score 60% or more to complete this lesson.
Create a free account to save your progress, take quizzes and earn a certificate.