
GEOM-350 · Lesson 11 of 12 · 20 min
Bathymetric lidar
The district's storage reservoir, a former coulee dammed in the 1950s, holds the water that keeps the canal running through dry Augusts. Nobody knows its capacity well: the original survey was made before filling, sediment has been settling for seventy years, and the district's operating rules rely on a capacity table drawn up from the 1950s drawings. Surveying the reservoir by boat with a sonar would take weeks and would miss the shallow margins, where most of the change has happened. Ines proposes topobathymetric lidar: an airborne system with a green laser that maps the shallow lakebed and the shore in one seamless survey, combined with a short sonar survey of the deepest part.
Why green light
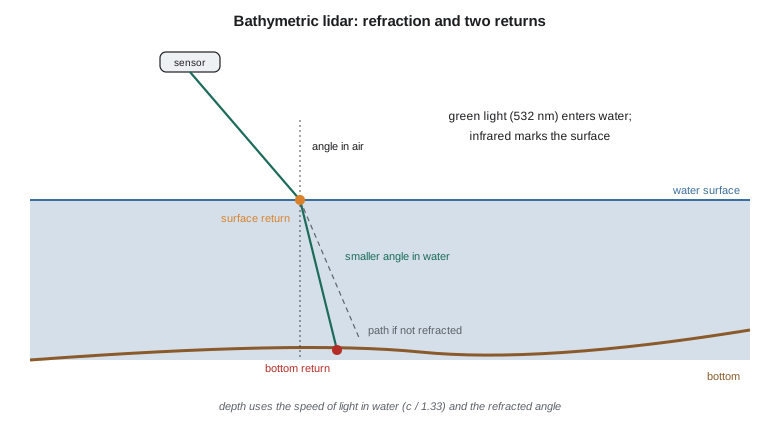
Water absorbs light strongly at most wavelengths. In the near-infrared used by topographic lidar, a few centimetres of water absorb almost everything, which is why lakes appear as holes in ordinary lidar data. Absorption is least in the blue-green part of the spectrum, and bathymetric lidar uses green light at 532 nm, produced by doubling the frequency of a 1,064 nm laser. Many systems fire both wavelengths: the green pulse penetrates the water and returns from the bottom, while the near-infrared pulse, reflected from the surface, marks where the water begins. Others use the green channel alone and find the surface from the first part of the green echo.
Green light is still attenuated as it travels through water, by absorption and by scattering from suspended particles and plankton. The attenuation is described by a diffuse attenuation coefficient, \(K_d\), and the light that returns from depth \(z\) has made the round trip, so the bottom echo falls roughly as \(e^{-2K_d z}\). Systems are rated by the depth they can reach, often expressed as a multiple of the Secchi depth, the depth at which a black-and-white disc lowered into the water disappears from view. In practice, maximum depths are roughly 1.5 to 3 times the Secchi depth, from under a metre in turbid rivers to tens of metres in very clear coastal water. Deep-water bathymetric systems with high pulse energy and wide beams reach the farthest; topobathymetric systems with smaller, eye-safe beams map shallow water at high density together with the land.
Refraction and the speed of light in water
When the green beam crosses the water surface it bends toward the vertical, following Snell's law, and it slows down. With refractive index \(n_w \approx 1.33\) for water at 532 nm,
where \(\theta_a\) is the angle from vertical in air and \(\theta_w\) in water. The time difference \(\Delta t\) between the surface and bottom returns therefore corresponds to a path length in water of \(v_w \Delta t / 2\), along the refracted direction. The depth and the horizontal offset of the bottom point from the surface point are
Both corrections are large. Ignoring the speed change overstates depths by a third, and ignoring the bending places bottom points too far from nadir and too deep. Processing software makes these corrections point by point, using the local water surface found from the near-infrared or green surface returns.
import math
C0 = 299792458.0
N_W = 1.333                # refractive index of fresh water at 532 nm (about)
Z_WS = 900.0 - 31.420        # reservoir water surface on the survey day
# One green pulse at 15 deg off nadir: surface and bottom returns 41.2 ns apart
theta_air = math.radians(15.0)
dt = 41.2e-9
theta_w = math.asin(math.sin(theta_air) / N_W)           # Snell's law
slant_w = (C0 / N_W) * dt / 2                             # one-way path length in water
depth = slant_w * math.cos(theta_w)
horiz = slant_w * math.sin(theta_w)
print(f"angle in water {math.degrees(theta_w):.2f} deg, slant path {slant_w:.3f} m")
print(f"depth {depth:.3f} m, horizontal offset from the surface point {horiz:.3f} m")
naive = (C0 * dt / 2) * math.cos(theta_air)               # treating water like air
print(f"without refraction and speed corrections the depth would be {naive:.3f} m ({(naive/depth-1)*100:.0f} % too deep)")
print(f"bottom elevation {Z_WS - depth:.3f} m")

# Wave slope error: the local surface is tilted 5 deg toward the scanner
for tilt in (0.0, 5.0):
    t = math.radians(tilt)
    refr = math.asin(math.sin(theta_air - t) / N_W) + t      # refracted ray measured from the vertical
    print(f"surface tilt {tilt:.0f} deg: depth {slant_w*math.cos(refr):.3f} m, horizontal offset {slant_w*math.sin(refr):.3f} m")

# Depth reach: rule of thumb from water clarity (Secchi depth) and the system's rating
for secchi in (1.5, 3.0, 5.0):
    print(f"Secchi depth {secchi:.1f} m -> expected maximum depth about {1.5*secchi:.1f} to {3.0*secchi:.1f} m")

# Storage capacity from a gridded bottom (5 m cells), at water levels 0 to 3 m above the survey day
cells = []
for i in range(60):
    for j in range(40):
        x, y = i * 5.0, j * 5.0
        d = 7.5 * (1 - ((x - 150) / 150) ** 2 - ((y - 100) / 110) ** 2)   # bowl-shaped basin; banks rise outside it
        cells.append(Z_WS - d)
for rise in (0.0, 1.0, 2.0, 3.0):
    wl = Z_WS + rise
    vol = sum(max(0.0, wl - z) * 25.0 for z in cells)
    area = sum(25.0 for z in cells if z < wl)
print(f"water level {wl:.2f}: area {area/1e4:5.2f} ha, storage {vol/1e3:7.1f} thousand m3")angle in water 11.20 deg, slant path 4.633 m depth 4.545 m, horizontal offset from the surface point 0.900 m without refraction and speed corrections the depth would be 5.965 m (31 % too deep) bottom elevation 864.035 m surface tilt 0 deg: depth 4.545 m, horizontal offset 0.900 m surface tilt 5 deg: depth 4.523 m, horizontal offset 1.002 m Secchi depth 1.5 m -> expected maximum depth about 2.2 to 4.5 m Secchi depth 3.0 m -> expected maximum depth about 4.5 to 9.0 m Secchi depth 5.0 m -> expected maximum depth about 7.5 to 15.0 m water level 868.58: area 5.00 ha, storage 193.4 thousand m3 water level 869.58: area 5.38 ha, storage 245.5 thousand m3 water level 870.58: area 5.62 ha, storage 300.7 thousand m3 water level 871.58: area 5.79 ha, storage 357.9 thousand m3
A pulse 15° off nadir that returns from the bottom 41.2 ns after the surface travels at 11.20° in the water along a 4.633 m path, so the bottom is 4.545 m deep and 0.900 m farther from nadir than the surface point. Treating the water as air would give 5.965 m, 31 percent too deep. A wave that tilts the surface 5° toward the sensor changes the refracted direction and moves the bottom point 10 cm sideways and 2 cm in depth, which is why surveys are flown in calm conditions and why surface slope modelling matters in rougher water. The capacity table at the end of the code illustrates the final product: storage at four water levels from a gridded bottom surface.
Finding the bottom in the waveform
A bathymetric echo has a characteristic shape: a sharp peak at the water surface, a decaying tail from light scattered back by the water column, and a smaller, broader peak from the bottom. In shallow water the surface and bottom peaks overlap and are hard to separate; topobathymetric systems use short pulses and full-waveform processing to resolve depths down to a few tens of centimetres. In deeper or murkier water the bottom peak sinks into the water column's tail and the noise, and the system's detection limit is reached. Processing fits models to the waveform, rejects returns from fish, weed and suspended matter, and flags areas where the bottom was not found, which must not be mistaken for deep water.
Bathymetric point clouds use extra classes defined in the topobathymetric domain profile of LAS: bathymetric bottom, water surface, derived water surface, submerged objects and water column returns among them. The surface returns themselves are noisy, especially in calm water where specular reflection sends little light back except near nadir, so the water surface used for refraction is usually a smoothed model rather than individual points.
Planning a topobathymetric survey
Water clarity decides success. Before committing the budget, Ines has Grant's crew measure Secchi depths at a dozen places in the reservoir in late summer and again in autumn. Late summer readings are poor, about 1.5 m, because of an algae bloom; autumn readings after the first frosts reach 3 to 4 m. The reservoir's deepest area, near the dam, is about 12 m; with 3.5 m Secchi depth the lidar should reach about 5 to 10 m, mapping the whole reservoir except the deep pool. The flight is planned for a calm, clear October day after turnover, with the district holding the water level steady for the day. The deep pool will be surveyed by single-beam sonar from a small boat, and the two surveys overlap along a band of 3 to 6 m depth to check each other.
Other planning factors are the sun's glint on the water, which floods detectors and is avoided by flying in the morning or with a scan pattern that looks away from the sun; wind, which roughens the surface; and bottom type, because dark mud and dense weed reflect less than sand or gravel. Flying heights are lower than for topographic surveys, often 400 to 600 m for topobathymetric systems, and the circular or elliptical scan patterns common in bathymetric sensors keep the incidence angle on the water nearly constant.
Standards for hydrographic surveys
Hydrographic surveys are classified by the International Hydrographic Organization's Standards for Hydrographic Surveys, S-44, whose sixth edition (2020) defines survey orders by total vertical and horizontal uncertainty that may depend on depth, and requirements for feature detection and bathymetric coverage. The Canadian Hydrographic Service publishes its own standards based on S-44 for charting. A reservoir capacity survey is not a nautical charting survey, but S-44's language for uncertainty and coverage gives a clear way to write the specification. Ines specifies a total vertical uncertainty of 0.15 m at 95 percent for depths to 5 m and full coverage of the margins.
Uncertainty in lidar bathymetry comes from all the topographic sources plus the water: refraction errors from the surface model, the uncertainty of the refractive index (which varies slightly with temperature and salinity), waveform detection, and the spreading of the beam in water, which enlarges the footprint and makes the bottom position an average over a wider area. Total propagated uncertainty models are used to compute it for each point, and the survey is checked against independent sonar or rod measurements in shallow water.
From bottom points to capacity
The product the district wants is a capacity table: the volume of water stored, and the surface area, at each water level from the outlet sill to the spillway crest. The lidar bottom, the sonar soundings and the topographic shore above the water line are merged into one bare-earth surface, after checking that all are in the same vertical datum. For each water level the volume is the integral of depth over the area below that level, computed on a grid or a triangulated surface. The comparison with the 1950s table shows how much sediment has accumulated and where, which tells the district whether dredging the intake area is worthwhile. In the code's simplified bowl, storage grows from 193,000 m³ at the survey-day level to 358,000 m³ three metres higher, with the area growing from 5.0 to 5.8 ha as the water spreads over the gentler margins.
Worked problem
Depth from a bathymetric return
A green pulse leaves the sensor 10° from vertical. The bottom echo arrives 60.0 ns after the surface echo. With \(n_w = 1.333\), find the depth.
Show solution
- \[\theta_w = \arcsin\Big(\frac{\sin 10^\circ}{1.333}\Big) = 7.48^\circ\]
- \[s = \frac{c\,\Delta t}{2 n_w} = \frac{299\,792\,458 \times 60.0\times 10^{-9}}{2 \times 1.333} = 6.747\ \text{m}\]
- \[d = s\cos\theta_w = 6.747 \times \cos 7.48^\circ = 6.690\ \text{m}\]
Answer: The depth is about 6.69 m, and the bottom point lies 0.88 m farther from nadir than the surface point.
Common mistakes
MistakePlanning a bathymetric lidar survey without measuring water clarity.
InsteadMeasure Secchi depth or turbidity in the planned season first.
MistakeIgnoring the slower speed of light in water.
InsteadDepths would be about a third too deep.
MistakeInterpreting areas with no bottom returns as deep water.
InsteadFlag them as no-data; the bottom may simply not have been detected.
MistakeMerging lidar, sonar and topography without checking datums.
InsteadConfirm all are in the same vertical datum and compare in overlap areas.
Summary and key terms
- Bathymetric lidar uses green light (532 nm), which penetrates water, often with near-infrared to mark the surface.
- Attenuation limits depth to roughly 1.5 to 3 Secchi depths, depending on the system and the water.
- Refraction and the slower speed of light in water must be corrected for every point.
- Waveform processing separates surface, water column and bottom; undetected bottoms are no-data, not deep water.
- Plans depend on clarity, calm water, sun glint, bottom type and stable water levels; sonar fills the deep areas.
- IHO S-44 provides the language of uncertainty and coverage; capacity tables integrate depth over area.
- Bathymetric lidar
- Airborne lidar using green light to measure water depth.
- Topobathymetric lidar
- Lidar that maps land and shallow water bottoms in one seamless survey.
- Secchi depth
- The depth at which a standard disc disappears from view, a simple measure of clarity.
- Diffuse attenuation coefficient
- A measure of how quickly light weakens with depth in water.
- Refraction
- The bending of light as it passes from air into water.
- Water column return
- Light scattered back from within the water rather than from the bottom.
- Capacity table
- A table of stored volume and surface area against water level.
Practice problems
Work each problem on paper first, then reveal the answer to check.
At 532 nm, by what factor does the speed of light drop in water?
Show answer
About 1.33.
A beam enters water at 20° from vertical. What is its angle in the water?
Show answer
About 14.9°.
The Secchi depth is 2 m. What maximum depth might a topobathymetric system reach?
Show answer
Roughly 3 to 6 m.
Why is a late-summer algae bloom a problem for bathymetric lidar?
Show answer
It reduces clarity and so the depth reached.
What should be done where no bottom return is found?
Show answer
Mark it as no-data and survey it by sonar if needed.
Lesson quiz · 5 questions
Score 60% or more to complete this lesson.
Create a free account to save your progress, take quizzes and earn a certificate.