
GCP-194 · Lesson 5 of 12 · 21 min
Review: Data analysis and presentation
▶ Video coming soon A video version of this lesson is on the way.
Section 2 is about 27 in 100 of the exam, roughly 16 questions on a 60-question form. It was Mateo's strongest section in the diagnostic: 9 of 11 right. Ravi was pleased but cautious. "You are strong where you have worked: SQL, views and the store dashboard," he said. "The two you missed were about LookML and about models you have not trained yourself. That is the pattern to watch." The review followed the three objectives of the section: finding trends and insights with BigQuery and notebooks, visualizing data in Looker, and defining, training, evaluating and using machine learning models.
Answering business questions with SQL
Objective 2.1 asks candidates to write SQL for reports and insights and to use data to answer business questions. On the exam this rarely means writing a query from scratch. More often a question shows a short query and asks what it returns, why it is slow or expensive, or which change would answer a slightly different question. The skills Mateo used every week in GCP-221 are the ones that matter.
| SQL skill | What it does | Typical exam clue |
|---|---|---|
| GROUP BY with SUM, COUNT, AVG | Totals and averages by a category | "sales by store", "average basket by region" |
| WHERE on the partitioning column | Limits the data read, so the query is faster and cheaper | "reduce the amount of data scanned" |
| JOIN to a reference table | Adds names, regions or targets to facts | "show the store name and region with each total" |
| Window functions such as ROW_NUMBER and LAG | Ranks, running totals, change from the previous row | "top three products in each store", "change from last week" |
| QUALIFY | Filters on the result of a window function | "keep only the latest record for each customer" |
| APPROX_COUNT_DISTINCT | A fast, close estimate of a distinct count | "approximate is acceptable", "very large table" |
| Views and materialized views | Saved logic; a materialized view also stores precomputed results | "many dashboards run the same aggregation" |
Cost belongs in this objective too, because a correct query that scans far too much data is a poor answer. Under on-demand pricing, BigQuery charges by the amount of data a query reads. Google's pricing page in November 2026 listed 6.25 US dollars per tebibyte in US locations, with the first tebibyte each month free. The rules for reducing cost are the ones from GCP-221: select only the columns you need, filter on the partitioning column, cluster large tables on columns that are often filtered, and use materialized views for aggregations many people repeat.
Worked problem
The cost of a dashboard tile
In September, a marketing dashboard tile at Birchline ran a query that read 1,400 GiB each time it was viewed, and it was viewed 212 times. At 6.25 US dollars per TiB, what did one view cost, and what did the month cost? After the fix in GCP-221, each view read about 0.3 GiB. What does a view cost now?
Show solution
- One TiB is 1,024 GiB, so 1,400 GiB is 1,400 ÷ 1,024, or about 1.37 TiB.
- One view cost about 1.37 × 6.25, or 8.54 US dollars.
- For 212 views: 212 × 8.54 is about 1,810 US dollars, before the free tebibyte.
- After the fix: 0.3 ÷ 1,024 is about 0.00029 TiB, which costs about 0.0018 US dollars, a fraction of a cent.
Answer: About 8.54 US dollars a view and about 1,810 a month before the fix; well under a cent a view after it.
The example also shows the exam's view of cost. The answer to an expensive query is almost never to buy more capacity. It is to read less data. When a question describes a query or dashboard that costs too much, look first for an option that adds a partition filter, removes unused columns, or precomputes a common aggregation.
Notebooks
The guide asks candidates to use notebooks, such as Colab Enterprise, to analyze and visualize data. In BigQuery Studio, a Colab Enterprise notebook runs inside the Google Cloud project, can query BigQuery directly, and can use Python libraries to clean, chart and model data. Notebooks fit exploration: trying several ideas quickly, combining SQL with Python, and sharing a worked analysis with colleagues. They are not the right home for a report that dozens of people need every morning. That belongs in a dashboard.
| Need | Better choice |
|---|---|
| Explore a question, try several approaches, chart the results | A notebook |
| Give 40 store managers the same view every morning | A dashboard in Looker or Data Studio |
| Share a one-time analysis with the steps visible | A notebook, shared with the team |
| Run the same SQL transformation every night | A scheduled query or a Dataform workflow, not a notebook |
Looker, Data Studio and dashboards
Objective 2.2 asks candidates to create, modify and share Looker dashboards, to compare Looker with Looker Studio, and to modify simple LookML parameters. Lesson 1 noted the rename: the tool the guide calls Looker Studio became Data Studio in April 2026, and its paid tier became Data Studio Pro. Looker itself was not renamed. The exam may use either name for Data Studio, so learn what each product is for.
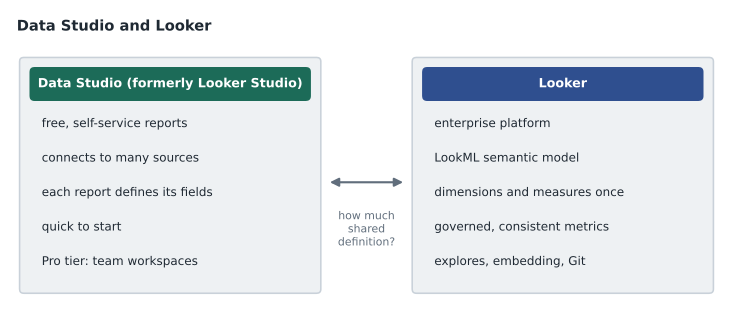
| Factor | Data Studio (formerly Looker Studio) | Looker |
|---|---|---|
| Cost and start-up | Free to start; Pro tier for teams | An enterprise product with its own licensing |
| Where metrics are defined | In each report or data source | Once, in a LookML model shared by everyone |
| Best for | Quick, self-service reports and simple sharing | Governed, consistent metrics across many teams; embedded analytics |
| Change control | Edited in the browser | LookML in a Git repository, with development and production modes |
| Typical clue | "quickly", "for a small team", "free" | "one definition of revenue for the whole company", "governed", "semantic model" |
Birchline used both. The store manager dashboard was built in Data Studio Pro, because it needed to launch quickly for 40 managers and use a handful of views. Finance's monthly reporting used Looker, because revenue, refunds and gift cards had to mean the same thing in every report. A question that stresses a single trusted definition of a metric across a company is a Looker question.
Simple LookML
The guide says candidates should be able to modify simple LookML parameters. LookML is the language Looker uses to describe data: a view maps to a table and declares its dimensions and measures; a model groups views into explores, which users query. Mateo does not need to write a full model, but he should read and change a small view.
view: sales {
  sql_table_name: curated.sales ;;
  dimension: store_id {
    type: number
    sql: ${TABLE}.store_id ;;
  }
  dimension_group: sale {
    type: time
    timeframes: [date, week, month]
    sql: ${TABLE}.sale_date ;;
  }
  measure: total_net_sales {
    type: sum
    sql: ${TABLE}.net_sales ;;
    value_format_name: usd
    label: "Net sales"
  }
}| Parameter | What it controls |
|---|---|
| sql_table_name | The table a view reads from |
| dimension, dimension_group | A field users can group or filter by; a group creates several time fields at once |
| measure with type: sum, count, average | An aggregated field and how it is calculated |
| label | The name users see |
| hidden: yes | Hides a field from users without deleting it |
| value_format_name | How numbers are displayed |
| explore (in a model) | Which views users can query together and how they join |
Sharing is the last part of the objective. Dashboards in Looker are shared through folders and permissions, and can be scheduled to send results by email. Data Studio reports are shared like other Google files, with viewer and editor access. In both, the data a viewer can see depends on the credentials the report uses. A report that runs on the owner's credentials shows the owner's data to everyone who can open it, which is why Birchline's store dashboard used authorized views with row access policies.
Machine learning: choosing the approach
Objective 2.3 covers machine learning at a practitioner's level. The guide asks candidates to tell when to use BigQuery ML and when to use AutoML, to use pretrained Google models through BigQuery, to plan a standard project, to train and evaluate models with SQL, to run predictions, and to organize models in Model Registry.
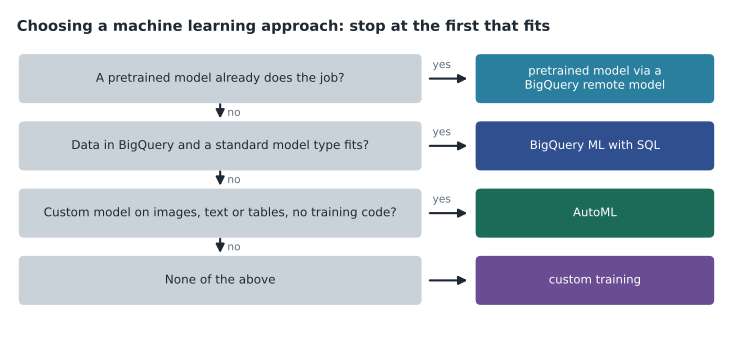
| Approach | Fits when | Example |
|---|---|---|
| Pretrained model through a BigQuery remote model | A general task such as summarizing, classifying or extracting text that a Google model already does well | Summarize free-text return reasons into categories |
| BigQuery ML | Data is already in BigQuery and a standard model type fits; analysts know SQL | Predict return risk with logistic regression; forecast store sales |
| AutoML | A custom model is needed on images, text or tables, and the team wants Google to handle model design | Classify product photos by category |
| Custom training | Specialized models and an experienced ML team | Beyond the scope of this exam |
BigQuery ML supports many model types. The exam expects candidates to match the business question to the type, not to tune them.
| Business question | BigQuery ML model type |
|---|---|
| How much will this customer spend? | Linear regression, or boosted trees for more accuracy |
| Will this order be returned? | Logistic regression, or boosted trees |
| Which groups of similar stores or customers exist? | K-means clustering |
| What will sales be next month? | ARIMA_PLUS, or the newer forecasting functions |
| Which products should we recommend? | Matrix factorization |
The project steps are the same in every approach: define the business question and how success will be measured, prepare features and split the data, train, evaluate on data the model has not seen, run predictions, and monitor the model once it is used. In BigQuery ML each step is SQL: CREATE MODEL trains, ML.EVALUATE reports quality, and ML.PREDICT scores new rows. Trained models can be registered in Model Registry so that versions are tracked and deployed consistently.
Worked problem
Reading an evaluation
In GCP-221, Mateo evaluated a return-risk model on 2,000 test orders, of which 300 were returned. At a threshold of 0.5 it flagged 270 orders: 180 that were returned and 90 that were not. It missed 120 returns. What were its precision, recall and accuracy?
Show solution
- Precision is the share of flagged orders that were really returned: 180 ÷ 270, or about 0.67.
- Recall is the share of real returns the model caught: 180 ÷ 300, or 0.60.
- Correct predictions are the 180 caught returns plus the orders correctly left unflagged: 2,000 − 300 − 90 = 1,610.
- Accuracy is (180 + 1,610) ÷ 2,000 = 1,790 ÷ 2,000, or 0.895.
Answer: Precision about 0.67, recall 0.60, accuracy about 0.90. Accuracy looks high mainly because most orders are not returned.
That last point is a favorite of the exam. When the thing being predicted is rare, accuracy can look excellent even for a weak model, because predicting "no" for everything is usually right. A question about rare events, such as fraud or returns, usually wants precision, recall or a related measure, not accuracy.
Reading analysis questions for cost and speed
Several analysis questions turn on a cost or performance clue rather than on SQL syntax. Three patterns recur. If a dashboard runs the same heavy query many times a day over data that changes once a night, the answer is usually to precompute: a scheduled query that writes a small summary table, or a materialized view, so each view of the dashboard reads a few megabytes instead of scanning the whole fact table. If a query filters on a date, the answer is usually a table partitioned on that date, so BigQuery skips the partitions the filter excludes, with clustering on the columns most often used in filters within a partition. And if a question mentions analysts exploring data with SELECT *, the answer is to select only the columns needed, because BigQuery bills on-demand queries by the bytes of the columns it reads, not by the rows returned. A LIMIT clause does not reduce the bytes scanned. Mateo's own cost example earlier in this lesson, the store dashboard scanning about 1,400 GiB a view, is the first pattern in miniature, and his fix, a nightly summary table, is the answer the exam would expect.
Common mistakes
MistakeFixing an expensive dashboard by buying more capacity.
InsteadRead less data: partition filters, fewer columns, materialized views.
MistakeUsing a notebook as a daily report for many people.
InsteadUse a dashboard for repeated viewing; use notebooks for exploration.
MistakeChoosing Data Studio when a company needs one governed definition of revenue.
InsteadThat is the case for Looker and its LookML model.
MistakeTraining a custom model for a task a pretrained model already does.
InsteadTry a pretrained model through BigQuery first.
MistakeJudging a rare-event model by accuracy.
InsteadUse precision and recall when the outcome is rare.
Summary and key terms
- Section 2 is about 27 in 100 of the exam.
- SQL questions test aggregation, joins, window functions, partition filters and cost; on-demand BigQuery charges by data read.
- Notebooks suit exploration and dashboards suit repeated viewing.
- Data Studio, formerly Looker Studio, is free and self-service; Looker gives governed, shared definitions through LookML.
- Read simple LookML views, dimensions and measures.
- For machine learning, try a pretrained model first, then BigQuery ML for standard model types on BigQuery data, then AutoML.
- Train, evaluate and predict with SQL, register models in Model Registry, and judge rare-event models by precision and recall.
- Partition filter
- A WHERE condition on a table's partitioning column that lets BigQuery skip partitions.
- Materialized view
- A view whose results BigQuery precomputes and keeps up to date.
- Colab Enterprise
- A managed notebook environment inside a Google Cloud project.
- Data Studio
- Google's free self-service reporting tool, called Looker Studio until April 2026.
- LookML
- The language Looker uses to define views, dimensions, measures and explores.
- BigQuery ML
- A feature that trains and runs machine learning models with SQL in BigQuery.
- Remote model
- A BigQuery model that calls a pretrained or hosted model through a connection.
- Recall
- The share of real positive cases a model correctly identifies.
Practice problems
Work each problem on paper first, then reveal the answer to check.
A query on a date-partitioned table filters on a different date column. Why might it scan the whole table?
Show answer
BigQuery can skip partitions only when the filter is on the partitioning column.
Which LookML parameter changes the name users see for a field?
Show answer
label.
A model predicts fraud, which occurs in 1 in 500 orders, with 99.8 in 100 accuracy. Why is that not reassuring?
Show answer
Predicting no fraud for every order would be just as accurate; precision and recall show whether fraud is caught.
Lesson quiz · 5 questions
Score 60% or more to complete this lesson.
Create a free account to save your progress, take quizzes and earn a certificate.