
ELE-470 · Lesson 12 of 12 · 27 min
Converter design project: a rack power supply
This course has covered power electronics piece by piece: devices, thermal design, rectifiers, magnetics, DC-DC converters, control, inverters, EMI, motor drives, renewable and storage converters, and grid-scale systems. Real design work combines all of these at once, under constraints of efficiency, size, cost, reliability, safety and schedule that pull in different directions. This final lesson walks through the design of a complete product, a 3 kW power supply unit for a data centre server rack, from specification to verification. The process applies equally to a motor drive, a solar inverter or an electric vehicle charger. The lesson ends with a project brief that asks you to carry out the design yourself.
The specification
Modern hyperscale racks distribute power at 48 to 54 V DC on a busbar running up the back of the rack, fed by a shelf of power supply units (PSUs) that convert AC from the facility. Each PSU in this example must:
- Accept single-phase AC from 180 to 305 V (to work on 230 V systems and on 277 V phase-to-neutral in 480 V systems), 50 or 60 Hz.
- Deliver 3 kW at 54 V DC (about 56 A), with tight regulation and current sharing among PSUs in parallel.
- Draw sinusoidal current with a power factor above 0.98 and low harmonic distortion.
- Meet 80 PLUS Titanium efficiency for 230 V data centre supplies: at least 90 percent at 10 percent load, 94 percent at 20 percent, 96 percent at 50 percent and 91 percent at full load, with a design target of about 97 percent at the peak.
- Ride through a loss of AC input for at least 10 to 20 ms (hold-up time) while keeping the output in regulation.
- Fit in a compact, hot-swappable housing cooled by a small fan, and survive in air entering at up to about 45 °C.
- Meet safety standards (IEC 62368-1, with national versions such as CSA/UL 62368-1), EMI limits (Lesson 8) and immunity requirements, and report telemetry over PMBus.
A good specification also records the expected mission profile: a typical rack PSU spends most of its life at 30 to 60 percent load, because PSUs are deployed in redundant groups (N+1 or N+N) that share the load. Efficiency at those loads matters more than at full load.
Choosing the architecture
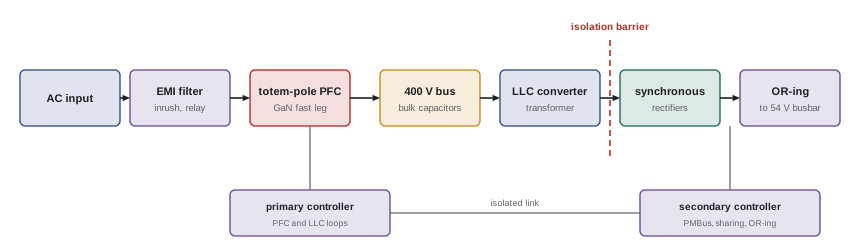
The standard architecture has two stages: a power factor correction (PFC) stage that rectifies the AC and boosts it to a regulated DC bus of about 400 V while drawing sinusoidal current (Lesson 3), and an isolated DC-DC stage that converts 400 V to 54 V with galvanic isolation for safety (Lesson 5). Hold-up energy is stored in the bulk capacitors on the 400 V bus, where storing energy is most efficient because energy rises with the square of voltage.
For the PFC stage, the traditional diode bridge followed by a boost converter loses about 1 to 1.5 percent in the bridge diodes alone. The bridgeless totem-pole PFC eliminates the bridge: one half-bridge of fast transistors switches at high frequency, and a second half-bridge of slow, low-resistance MOSFETs switches at line frequency to steer the current. The totem-pole became practical only with gallium nitride and silicon carbide transistors, whose lack of reverse-recovery charge allows the fast leg to operate in continuous conduction mode, and it is now the usual choice for high-efficiency supplies.
For the DC-DC stage, the LLC resonant converter is preferred because its switches turn on at zero voltage and its output rectifiers turn off at low current, keeping switching losses low at high frequency. It regulates by varying frequency around its resonance, and is most efficient when operated near resonance, which is possible because the PFC stage keeps its input voltage steady. Synchronous rectification with low-voltage MOSFETs replaces output diodes, which would lose more than a volt at 56 A.
The loss budget
Meeting 97 percent efficiency means that the whole supply may dissipate only about 90 to 100 W at full load, shared among all its parts. Designers allocate this budget among the stages early, then design each stage to meet its share. Losses fall into three types with different dependence on load: fixed losses (controllers, auxiliary supplies, core losses at constant voltage and frequency, the fan), losses proportional to load (switching losses, which scale with current), and losses proportional to the square of load (conduction losses in switches, windings and filters). Fixed losses dominate at light load and limit efficiency there; conduction losses dominate at full load.
# Loss budget and efficiency curve of a 3 kW, 230 V AC to 54 V DC rack power supply
P_rated = 3000.0
# loss model per stage: fixed (W), proportional to load (fraction of output), proportional to load squared (W at full load)
stages = {
    "EMI filter, relay and fuse": (0.5, 0.000, 10.0),
    "totem-pole PFC (GaN)": (4.0, 0.002, 22.0),
    "LLC converter (GaN)": (4.0, 0.002, 17.0),
    "synchronous rectifiers": (1.0, 0.000, 18.0),
    "control, auxiliary, fan": (6.0, 0.001, 4.0),
}
titanium = {0.1: 0.90, 0.2: 0.94, 0.5: 0.96, 1.0: 0.91}     # 80 PLUS Titanium, 230 V redundant supplies

def losses(x):
    return {k: a + b * x * P_rated + c * x * x for k, (a, b, c) in stages.items()}

for x in (0.1, 0.2, 0.3, 0.5, 0.75, 1.0):
    L = sum(losses(x).values())
    eff = x * P_rated / (x * P_rated + L)
    target = titanium.get(x)
    verdict = "pass" if target and eff >= target else "FAIL"
    tag = f" (Titanium {target:.0%}: {verdict})" if target else ""
    print(f"load {x:4.0%}: losses {L:5.1f} W, efficiency {eff:.2%}{tag}")
print("full-load loss budget:")
for k, v in losses(1.0).items():
print(f" {k:<26} {v:5.1f} W")load 10%: losses 17.7 W, efficiency 94.43% (Titanium 90%: pass) load 20%: losses 21.3 W, efficiency 96.57% (Titanium 94%: pass) load 30%: losses 26.4 W, efficiency 97.15% load 50%: losses 40.8 W, efficiency 97.36% (Titanium 96%: pass) load 75%: losses 66.7 W, efficiency 97.12% load 100%: losses 101.5 W, efficiency 96.73% (Titanium 91%: pass) full-load loss budget: EMI filter, relay and fuse 10.5 W totem-pole PFC (GaN) 32.0 W LLC converter (GaN) 27.0 W synchronous rectifiers 19.0 W control, auxiliary, fan 13.0 W
The model shows efficiency peaking at about 97.4 percent near half load, where the PSU spends much of its life, and meeting every Titanium point with margin. At full load the PFC and LLC stages together account for nearly 60 percent of the losses. Most of the losses at full load are conduction losses, so further improvement would come from lower-resistance transistors, paralleled devices or larger magnetics. At 10 percent load the fixed losses dominate, which is why designs use burst mode or phase shedding at light load. Each line of this budget becomes a target for the detailed design of that stage.
Choosing the switching frequency
Switching frequency is the central trade-off in converter design (Lesson 4). Higher frequency shrinks the transformer, inductors and filter capacitors, improving power density, but raises switching, gate drive and core-related losses and makes winding design harder. Wide-bandgap devices move the optimum to higher frequency, but not without limit.
# Choosing the LLC switching frequency: losses versus magnetics size for a 3 kW stage
P = 3000.0
for f_khz in (100, 200, 300, 500, 800):
    f = f_khz * 1e3
    p_switch = 2.0 + 0.012 * f_khz                 # W: turn-off, gate drive and residual switching losses
    p_core = 9.0 * (100 / f_khz) ** 0.4            # W: smaller core but higher frequency; net slow fall
    p_wind = 8.0 * (f_khz / 100) ** 0.35           # W: thinner winding window and proximity effects
    vol = 60.0 * (100 / f_khz) ** 0.75             # cm3 of magnetics (transformer plus resonant inductor)
    total = p_switch + p_core + p_wind
    print(f"{f_khz:4d} kHz: switching {p_switch:4.1f} W, core {p_core:4.1f} W, winding {p_wind:4.1f} W, "
f"total {total:5.1f} W ({1 - total / P:.2%} stage efficiency), magnetics {vol:5.1f} cm3")100 kHz: switching 3.2 W, core 9.0 W, winding 8.0 W, total 20.2 W (99.33% stage efficiency), magnetics 60.0 cm3 200 kHz: switching 4.4 W, core 6.8 W, winding 10.2 W, total 21.4 W (99.29% stage efficiency), magnetics 35.7 cm3 300 kHz: switching 5.6 W, core 5.8 W, winding 11.8 W, total 23.2 W (99.23% stage efficiency), magnetics 26.3 cm3 500 kHz: switching 8.0 W, core 4.7 W, winding 14.1 W, total 26.8 W (99.11% stage efficiency), magnetics 17.9 cm3 800 kHz: switching 11.6 W, core 3.9 W, winding 16.6 W, total 32.1 W (98.93% stage efficiency), magnetics 12.6 cm3
In this model, the stage loss rises slowly from about 20 W at 100 kHz to 27 W at 500 kHz, while the magnetics volume falls by more than two-thirds. Above 500 kHz the losses rise faster for little further reduction in size. A designer targeting high power density would choose a frequency of a few hundred kilohertz, using planar magnetics to control winding losses, and would then verify the choice with detailed loss calculations and prototypes. The scaling exponents in such a model are themselves design assumptions that must be checked against component data.
Hold-up and bulk capacitance
When the AC input fails, the PSU must keep its output in regulation for the specified hold-up time, drawing energy from the bulk capacitors while their voltage falls from the normal 400 V to the lowest voltage at which the LLC stage can still regulate. The energy available sets the capacitance required:
Worked problem
Bulk capacitor sizing
The LLC stage draws 3,090 W from the bus at full load (3 kW output at 97 percent efficiency). The hold-up time is 10 ms, the bus is normally at 400 V, and the LLC stage can regulate down to 320 V. What bulk capacitance is needed, and how much would a 20 ms requirement add?
Show solution
- Energy needed: \(3090 \times 0.010 = 30.9\) J.
- Capacitance: \(C = 2 \times 30.9 / (400^2 - 320^2) = 61.8 / 57{,}600 = 1.07 \times 10^{-3}\) F, about 1,070 µF.
- For 20 ms: about 2,150 µF.
Answer: About 1,100 µF of 450 V electrolytic capacitance for 10 ms, a large fraction of the supply's volume, and double for 20 ms. Designers reduce it by widening the LLC's input voltage range (regulating down to a lower voltage gives access to more of the stored energy) or by adding auxiliary hold-up circuits. Ripple current and temperature, as Lesson 2 showed, determine the capacitors' life.
Thermal, mechanical and reliability design
The 100 W of losses must leave a narrow housing through a small fan. Thermal design places the hottest parts (PFC transistors, LLC transistors, synchronous rectifiers and magnetics) in the airflow, uses thermal vias and copper planes to spread heat from surface-mount devices, and checks every component's temperature at 45 °C inlet and full load, with margin for fan ageing and dust. The electrolytic bulk capacitors, the fan and the opto-isolators are the components most likely to limit life, so they are placed in cooler parts of the airflow, and their life is calculated with the methods of Lesson 2. Mechanical design must also maintain the creepage and clearance distances that safety standards require across the isolation barrier, which constrain transformer and board layout.
Control, protection and communication
Digital controllers on both sides of the isolation barrier run the PFC current loop and voltage loop, the LLC frequency control, and the protection functions: input undervoltage, output overvoltage and overcurrent, overtemperature and fan failure. The output must share current with other PSUs in the shelf, typically by droop (letting each output voltage fall slightly with load) or by an active current-sharing bus, and an OR-ing MOSFET at the output disconnects a failed PSU so that it cannot pull down the busbar. Telemetry over PMBus reports input and output voltage, current, power, temperatures, fan speed and fault history to the rack management system, which uses it for capacity planning, early warning of failures and efficiency monitoring.
Verification
Design calculations and simulations are followed by prototypes and a structured test program:
- Functional and efficiency tests across input voltage, load and temperature, with efficiency measured by precision power analyzers.
- Control loop measurements of phase and gain margin, and load-step and line-transient tests (Lesson 6).
- Thermal tests with thermocouples and infrared imaging at maximum inlet temperature.
- EMI pre-compliance scans, then formal conducted and radiated emissions and immunity tests (Lesson 8).
- Safety tests: hi-pot (dielectric withstand) across the isolation barrier, leakage current, abnormal operation and fault tests, temperature limits.
- Reliability tests: highly accelerated life testing (HALT) to find weak points, and burn-in or screening of production units.
Problems found at each step lead to design changes and further testing. The cycle from first prototype to certified product typically takes many months, which is why careful analysis early, of the kind covered in this course, is so valuable.
The course project
Design a power converter to a specification, documenting each decision with calculations. You may choose one of the following briefs, or propose your own of similar scope:
- Brief A: the 3 kW rack PSU described in this lesson (230 V AC input, 54 V output, Titanium efficiency, 10 ms hold-up).
- Brief B: a 10 kW bidirectional DC-DC converter between a 400 V DC bus and a 48 V battery for a telecom or microgrid installation, using a dual active bridge (Lesson 10).
- Brief C: a 7.5 kW variable-frequency drive for a fan motor supplied from 600 V or 480 V three-phase, with a diode front end, DC link and IGBT inverter (Lessons 3, 7 and 9).
The design report should include:
- The specification, including a mission profile, and the chosen architecture with the reasons for it.
- Device selection with conduction and switching loss calculations and a junction temperature check, including a transient overload (Lessons 1 and 2).
- Design of at least one inductor or transformer by the area-product method, with core and winding loss estimates (Lesson 4).
- Capacitor selection for ripple current, hold-up or DC link duty, and a lifetime estimate (Lessons 2 and 4).
- A control design with a loop gain plot showing crossover frequency and phase margin, and a simulated load or line transient (Lesson 6).
- An EMI filter estimate and a layout sketch of the critical commutation loops (Lesson 8).
- A loss budget and efficiency curve across the load range, compared with the specification.
- A list of the tests that would verify the design, and the main risks.
Common mistakes
MistakeOptimizing efficiency only at full load.
InsteadWeight efficiency by the mission profile; redundant PSUs run mostly at partial load.
MistakeAllocating losses only after the stages are designed.
InsteadSet a loss budget early and design each stage to its share.
MistakeChoosing the highest switching frequency the devices allow.
InsteadBalance losses, magnetics size, EMI and cost.
MistakeSizing hold-up capacitance without the minimum regulating voltage.
InsteadUse C ≥ 2·P·t / (Vnom² − Vmin²).
MistakeLeaving safety spacing and EMI to the end of the design.
InsteadInclude creepage, clearance and filter space in the first layout.
Summary and key terms
- A converter design starts with a specification including efficiency targets, hold-up, standards and a mission profile.
- A 3 kW rack PSU uses a totem-pole PFC to a 400 V bus and an LLC converter with synchronous rectifiers to 54 V.
- A loss budget separates fixed, load-proportional and load-squared losses and sets targets for each stage.
- Switching frequency trades losses against magnetics size; the optimum is a few hundred kHz with wide-bandgap devices.
- Hold-up capacitance follows from energy: C ≥ 2·P·t / (Vnom² − Vmin²).
- Thermal, reliability, safety spacing, control, protection and telemetry complete the design.
- Verification covers efficiency, control, thermal, EMI, safety and reliability tests.
- Power supply unit (PSU)
- A self-contained converter that supplies equipment from the facility supply.
- Totem-pole PFC
- A bridgeless power factor correction circuit with fast and slow half-bridges.
- LLC converter
- A resonant DC-DC converter with an inductor-inductor-capacitor tank.
- Synchronous rectification
- Using controlled MOSFETs instead of diodes to rectify with low loss.
- Hold-up time
- How long a supply keeps its output regulated after input power fails.
- Loss budget
- An allocation of allowable losses among the parts of a design.
- Mission profile
- The loads and conditions a product experiences over its life.
- OR-ing MOSFET
- A switch that connects a PSU to a shared bus and isolates it if it fails.
- Creepage and clearance
- Minimum distances along surfaces and through air across insulation barriers.
- HALT
- Highly accelerated life testing to reveal design weaknesses.
Practice problems
Work each problem on paper first, then reveal the answer to check.
What output current does a 3 kW, 54 V PSU deliver?
Show answer
About 55.6 A.
What are the 80 PLUS Titanium targets for 230 V data centre supplies?
Show answer
90%, 94%, 96% and 91% at 10%, 20%, 50% and 100% load.
Why does a totem-pole PFC need GaN or SiC transistors for continuous conduction mode?
Show answer
Silicon MOSFET body diodes have reverse-recovery losses that are too high.
Why is hold-up energy stored at 400 V rather than at 54 V?
Show answer
Stored energy rises with voltage squared, so less capacitance is needed.
Losses are 5 W fixed and 60 W of conduction at full load. Efficiency at 25% of a 2 kW rating?
Show answer
Losses 5 + 60 × 0.0625 = 8.75 W; 500 / 508.75 = 98.3%.
Why are fixed losses most important at light load?
Show answer
They do not fall with load, so they form a large share of losses at light load.
Bulk capacitance for 2,000 W, 16 ms, 390 V nominal, 300 V minimum?
Show answer
2 × 2000 × 0.016 / (390² − 300²) = 64 / 62,100 ≈ 1,030 µF.
Name two ways parallel PSUs share current.
Show answer
Droop, or an active current-sharing bus.
What does an OR-ing MOSFET do?
Show answer
Disconnects a failed PSU from the shared bus.
Name three verification tests for a PSU.
Show answer
Efficiency, loop gain, thermal, EMI, hi-pot, leakage, HALT.
Lesson quiz · 5 questions
Score 60% or more to complete this lesson.
Create a free account to save your progress, take quizzes and earn a certificate.