
ECON-102 · Lesson 4 of 12 · 29 min
Unemployment and the labour market
Unemployment is one of the most painful features of economic downturns. For individuals, losing a job means lost income, stress, damaged skills and, for some, lasting harm to health and future earnings. For the economy, unemployment means wasted resources: people willing to work and output that is never produced. This lesson explains how unemployment is measured, why there is always some unemployment even in good times, how unemployment moves with the business cycle, and how income support programs work. The labour market tools of ECON-101, such as wage determination, minimum wages and monopsony, sit underneath this aggregate picture.
Measuring unemployment
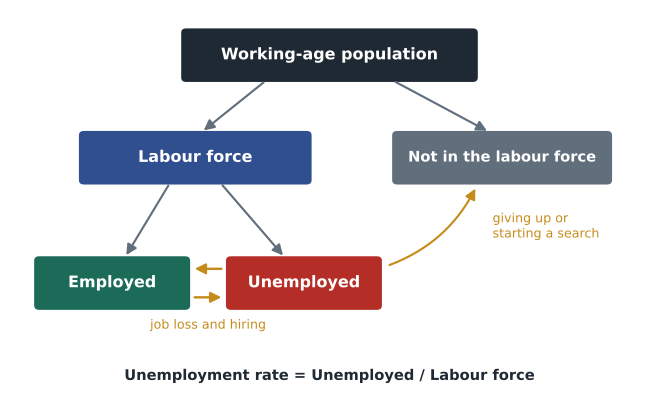
Unemployment is measured with large monthly household surveys rather than by counting people receiving benefits. Interviewers ask a representative sample of households about each member's activities during a reference week, and each working-age person is classified into one of three groups. Employed people did any paid work, or had a job but were temporarily absent because of illness, vacation or a labour dispute. Unemployed people had no job, were available for work and had actively looked for work in the past four weeks, or were on temporary layoff expecting to return, or had a job starting soon. Everyone else is not in the labour force: students who are not looking for work, retirees, people caring for family full time, and people who would like a job but have stopped looking.
In Canada, Statistics Canada's Labour Force Survey (LFS) samples about 65,000 households each month and covers people aged 15 and older, excluding residents of the territories (surveyed separately), people living on First Nations reserves, full-time members of the Canadian Armed Forces and people in institutions. Results are released on the first or second Friday of the following month.
Three key ratios are calculated from these groups. The labour force is the employed plus the unemployed. The unemployment rate is the unemployed as a percentage of the labour force. The participation rate is the labour force as a percentage of the working-age population. The employment rate, or employment-to-population ratio, is the employed as a percentage of the working-age population.
Worked problem
Calculating labour market rates (illustrative)
Suppose a province has a working-age population of 4,000,000, with 2,450,000 employed and 170,000 unemployed. Calculate the labour force, unemployment rate, participation rate and employment rate.
Show solution
- Labour force = 2,450,000 + 170,000 = 2,620,000.
- Unemployment rate = 170,000 ÷ 2,620,000 × 100 = 6.5 %.
- Participation rate = 2,620,000 ÷ 4,000,000 × 100 = 65.5 %.
- Employment rate = 2,450,000 ÷ 4,000,000 × 100 = 61.3 %.
Answer: The unemployment rate is 6.5 %, the national rate reported for September 2026. The other numbers are illustrative.
# Survey rates and the effect of discouraged workers
def rates(pop, emp, unemp):
    lf = emp + unemp
    return unemp / lf * 100, lf / pop * 100, emp / pop * 100

pop, emp, unemp = 275.5, 163.15, 7.11   # millions
u, p, e = rates(pop, emp, unemp)
print(f"Unemployment {u:.2f} %  participation {p:.2f} %  employment rate {e:.2f} %")
# 0.5 million unemployed people give up looking: they stop counting as unemployed
u2, p2, e2 = rates(pop, emp, unemp - 0.5)
print(f"After 0.5 m stop searching: unemployment {u2:.2f} % participation {p2:.2f} % employment rate {e2:.2f} %")Unemployment 4.18 % participation 61.80 % employment rate 59.22 % After 0.5 m stop searching: unemployment 3.89 % participation 61.62 % employment rate 59.22 %
The calculation shows a well-known weakness of the unemployment rate. When jobless people become discouraged and stop searching, they are no longer counted as unemployed, so the unemployment rate falls even though nobody has found a job. The employment rate, by contrast, is unchanged. For this reason analysts look at several measures together, including the employment rate, the participation rate and broader measures of underuse of labour that add discouraged workers and people working part time who want full-time work.
Statistics Canada publishes supplementary unemployment rates, R1 to R8, ranging from narrow measures (such as people unemployed a year or more) to broad ones that include discouraged searchers, people waiting for recall or replies, and involuntary part-timers. It also publishes the labour underutilization rate.
Participation and demographics
The participation rate is shaped by long-run forces. The entry of women into paid work raised participation sharply from the 1960s to the 1990s. Canada's female participation rate among people aged 25 to 54 is now among the highest in the world, helped in part by Quebec's low-cost child care program, introduced in 1997, and by the national early learning and child care agreements signed with all provinces and territories in 2021–2022. Population ageing works in the other direction: as the large baby-boom generation retires, the overall participation rate falls, even if participation within each age group is unchanged. Economists therefore often focus on the prime-age (25 to 54) employment rate, which removes most of the effect of ageing and school enrolment.
Population growth also matters. Canada's population grew very rapidly in 2022–2024, mainly through temporary residents such as international students and temporary foreign workers, adding hundreds of thousands of people to the labour force each year. When population growth is that fast, the economy must create many jobs each month just to keep the unemployment rate stable. The federal government announced reductions in immigration targets and caps on temporary residents from 2025, which slowed labour force growth. In the United States, immigration policy also changed sharply in 2025, with lower net immigration reducing labour force growth. Changes like these mean that the number of new jobs needed to keep unemployment steady, sometimes called the breakeven pace, can vary widely from year to year.
Types of unemployment
Economists distinguish three kinds of unemployment. Frictional unemployment arises because it takes time for workers and jobs to find each other: graduates looking for their first job, people moving to a new city, and workers who quit to look for something better. Some frictional unemployment is healthy, because it reflects people searching for jobs that match their skills. Structural unemployment arises when there is a mismatch between the skills or locations of workers and the available jobs, for example when automation eliminates certain occupations or an industry declines in one region while jobs grow elsewhere. Structural unemployment can also arise when wages are held above the market-clearing level by minimum wages, unions or efficiency wages, as ECON-101 explained. Cyclical unemployment is the extra unemployment caused by recessions, when aggregate demand falls and firms lay off workers across many industries.
The natural rate of unemployment is the rate that prevails when there is no cyclical unemployment: only frictional and structural unemployment remain. It is also called the non-accelerating inflation rate of unemployment (NAIRU), because pushing unemployment below it tends to make inflation rise. The natural rate cannot be observed directly and must be estimated; estimates change over time with demographics, the efficiency of job matching and labour market institutions. In recent years estimates have typically been somewhere around 5.5 to 6.5 % for Canada, whose survey methods produce rates roughly a point higher than US methods would, and around 4 to 4.5 % for the United States.
| Type | Cause | Policy response |
|---|---|---|
| Frictional | Time needed to search and match | Better job information, online matching, mobility support |
| Structural | Skill or location mismatch; wages above equilibrium | Training, apprenticeships, relocation help, credential recognition |
| Cyclical | Fall in aggregate demand in a recession | Monetary and fiscal stabilization policy |
Unemployment over the business cycle
Cyclical unemployment rises in recessions and falls in expansions. A rough relationship known as Okun's law, named after the economist Arthur Okun, links the two: each percentage point that output falls short of potential is associated with an unemployment rate about half a percentage point above the natural rate. Equivalently, for unemployment to fall by one percentage point in a year, real GDP must grow roughly two percentage points faster than its potential growth rate. The coefficients vary across countries and periods, so Okun's law is a rule of thumb, not a precise law.
Worked problem
Okun's law
The natural rate of unemployment is 6.0 % and the economy is producing 2 % below potential. Use Okun's law with a coefficient of 0.5 to estimate unemployment. How fast must real GDP grow next year to close the gap if potential grows 1.8 %?
Show solution
- Cyclical unemployment ≈ 0.5 × 2 = 1.0 percentage point.
- Unemployment ≈ 6.0 + 1.0 = 7.0 %.
- To close a 2 % gap in a year, actual output must grow 2 points faster than potential.
- Required growth ≈ 1.8 + 2.0 = 3.8 %.
Answer: Unemployment of about 7 %; closing the gap in one year would need growth near 3.8 %, which is fast by recent standards, so gaps usually close gradually.
# Okun's law: unemployment path as an output gap closes (illustrative)
u_star, okun = 6.0, 0.5
gap = -2.0           # % of potential
potential_growth = 1.8
for year, growth in enumerate([2.5, 2.8, 2.6, 2.0], start=1):
    gap = gap + (growth - potential_growth)
    u = u_star - okun * gap
print(f"Year {year}: real growth {growth:.1f} % output gap {gap:+.1f} % unemployment {u:.2f} %")Year 1: real growth 2.5 % output gap -1.3 % unemployment 6.65 % Year 2: real growth 2.8 % output gap -0.3 % unemployment 6.15 % Year 3: real growth 2.6 % output gap +0.5 % unemployment 5.75 % Year 4: real growth 2.0 % output gap +0.7 % unemployment 5.65 %
Unemployment also tends to lag behind output. Firms are reluctant to lay off experienced workers at the first sign of weakness, and they are reluctant to hire until they are confident a recovery will last. As a result, the unemployment rate often keeps rising for months after GDP has started to recover. Long spells of unemployment are especially damaging: skills erode, networks fade and employers may view long gaps negatively. This effect, called hysteresis, means that deep recessions can raise unemployment long after the recession ends, a reason policymakers try to keep downturns short.
Employment insurance and unemployment insurance
Canada's Employment Insurance (EI) program is a federal program funded by premiums paid by employees and employers. In 2026 employees pay 1.63 % of insurable earnings up to a maximum of 68,900 dollars, and employers pay 1.4 times the employee premium. Regular benefits replace 55 % of average insurable weekly earnings, up to a maximum of about 729 dollars a week in 2026. To qualify, a worker must usually have lost a job through no fault of their own and have worked between 420 and 700 insurable hours in the past year, depending on the unemployment rate in their region; benefits last between 14 and 45 weeks, again depending on the regional unemployment rate and hours worked. EI also pays maternity, parental, sickness and caregiving benefits. The regional variation is designed to give more support where jobs are scarcer, but critics argue it can discourage mobility.
Unemployment insurance serves two purposes. It helps individuals smooth consumption when they lose a job, and it acts as an automatic stabilizer for the economy, because benefit payments rise automatically in recessions, supporting spending without any new legislation. The trade-off is that more generous or longer benefits may lengthen job searches somewhat. Research finds that this effect exists but is modest, and that longer searches can also produce better job matches. Policy design tries to balance protection against incentives.
Worked problem
Employment insurance replacement rate
A worker earned 1,100 dollars a week in insurable earnings before being laid off. Estimate her weekly EI benefit at a 55 % replacement rate, and her net replacement after a 20 % tax rate on benefits.
Show solution
- Benefit = 0.55 × 1,100 = 605 dollars a week, below the 2026 maximum of about 729 dollars.
- After tax at 20 %: 605 × 0.80 = 484 dollars.
- Net replacement of gross pay = 484 ÷ 1,100 = 44 %.
Answer: She receives about 605 dollars a week before tax, replacing a little over half of her earnings.
Common mistakes
MistakeAnyone without a job is unemployed.
InsteadOnly people who are available and actively looking (or on temporary layoff) are unemployed; others are not in the labour force.
MistakeA falling unemployment rate always means more people are working.
InsteadIt can fall because discouraged workers stop searching; check the employment rate.
MistakeThe goal should be zero unemployment.
InsteadSome frictional and structural unemployment is unavoidable; pushing below the natural rate tends to raise inflation.
MistakeUnemployment is counted from benefit claims.
InsteadIt is measured with household surveys; many unemployed people do not receive benefits.
MistakeCanadian and US unemployment rates are directly comparable.
InsteadSurvey definitions differ; Canada's rate would be roughly a point lower on US definitions.
Summary and key terms
- Monthly household surveys classify working-age people as employed, unemployed or not in the labour force.
- The unemployment rate is the unemployed share of the labour force; participation and employment rates complete the picture.
- Discouraged workers lower the unemployment rate without any rise in employment, so broader measures matter.
- Unemployment is frictional, structural or cyclical; the natural rate excludes cyclical unemployment.
- Okun's law links unemployment to the output gap: roughly half a point of unemployment per point of gap.
- Long spells of unemployment can cause lasting damage through hysteresis.
- Employment or unemployment insurance supports jobless workers and stabilizes the economy, with modest effects on search incentives.
- Labour force
- People who are employed or unemployed.
- Unemployment rate
- The percentage of the labour force that is unemployed.
- Participation rate
- The labour force as a percentage of the working-age population.
- Discouraged worker
- A person who wants a job but has stopped looking because they believe none is available.
- Frictional unemployment
- Unemployment from the time needed to match workers and jobs.
- Structural unemployment
- Unemployment from mismatches of skills or location, or wages above equilibrium.
- Cyclical unemployment
- Unemployment caused by a fall in aggregate demand.
- Natural rate of unemployment
- The unemployment rate with no cyclical unemployment.
- Okun's law
- A rule of thumb linking the unemployment rate to the output gap.
- Hysteresis
- Lasting effects of a temporary downturn on unemployment or output.
Practice problems
Work each problem on paper first, then reveal the answer to check.
Employed 900, unemployed 100, population 1,600. Find the unemployment and participation rates.
Show answer
10 %; 62.5 %.
If 20 unemployed people stop searching in the previous question, what is the new unemployment rate?
Show answer
80 ÷ 980 = 8.2 %.
A software developer leaves a job to look for a better one. Which type of unemployment?
Show answer
Frictional.
A coal miner's job disappears as mines close. Which type?
Show answer
Structural.
Why is the natural rate also called the NAIRU?
Show answer
Unemployment below it tends to make inflation accelerate.
The output gap is −3 %. Using Okun's coefficient of 0.5, how high is cyclical unemployment?
Show answer
About 1.5 percentage points.
Why does unemployment lag GDP?
Show answer
Firms delay layoffs and hiring until they are confident about the trend.
Why are unemployment benefits called an automatic stabilizer?
Show answer
Payments rise automatically in recessions, supporting spending without new laws.
Why focus on the prime-age employment rate?
Show answer
It removes most effects of ageing and schooling.
Portfolio task: from the latest labour force release, report the unemployment, participation and employment rates and explain what changed.
Show answer
Answers vary; should cite the official release.
Lesson quiz · 5 questions
Score 60% or more to complete this lesson.
Create a free account to save your progress, take quizzes and earn a certificate.