
ECON-102 · Lesson 2 of 12 · 36 min
Measuring the economy: GDP
Gross domestic product is the single most important number in macroeconomics. It measures the total output of an economy, and its growth rate is the headline measure of whether the economy is expanding or shrinking. GDP is used to compare living standards across countries, to judge the size of government budgets and debts, to set the stance of monetary policy and to evaluate the success of economic policies. Yet GDP is also widely misunderstood. This lesson explains exactly what GDP measures, the three ways of calculating it, the difference between nominal and real GDP, and what GDP leaves out.
What GDP measures
Gross domestic product is the market value of all final goods and services produced within a country in a given period. Each part of the definition matters. Market value means that different goods are added up using their prices, so that a car counts for more than a loaf of bread. Final goods and services are those bought by their end users; intermediate goods, such as the steel used to make the car or the flour used to bake the bread, are excluded to avoid counting them twice. Produced means that GDP counts current production: the sale of a used car or an existing house is not part of GDP, although the commission earned by the dealer or real estate agent is. Within a country means that GDP counts production on domestic soil, whoever owns the factory. And in a given period means that GDP is a flow, measured per quarter or per year, not a stock.
One way to avoid double counting is the value-added method. Value added is the value of a firm's output minus the value of the intermediate goods it buys. If a farmer grows wheat worth 1 dollar, a miller turns it into flour worth 1.50 dollars, and a baker turns the flour into bread sold for 4 dollars, the value added at each stage is 1 dollar, 0.50 dollars and 2.50 dollars. The sum of value added, 4 dollars, equals the value of the final good. GDP can therefore be measured either as the value of final goods or as the sum of value added across all producers.
Worked problem
Value added along a supply chain
A forestry company sells logs worth 200 dollars to a sawmill. The sawmill sells lumber worth 500 dollars to a furniture maker, which sells a table to a household for 1,200 dollars. Calculate value added at each stage and the contribution to GDP.
Show solution
- Forestry company: 200 − 0 = 200 dollars.
- Sawmill: 500 − 200 = 300 dollars.
- Furniture maker: 1,200 − 500 = 700 dollars.
- Total value added = 200 + 300 + 700 = 1,200 dollars, equal to the price of the final good.
Answer: GDP rises by 1,200 dollars, not by the 1,900 dollars obtained by adding all sales, which would count the logs and lumber more than once.
The circular flow and three approaches
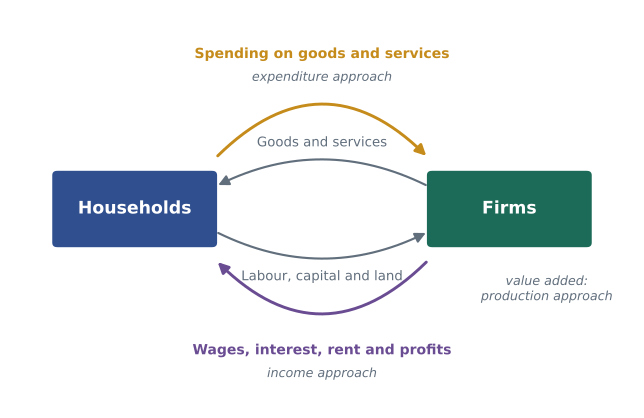
The circular flow model shows why output, income and spending must be equal for the economy as a whole. Households own the factors of production and sell labour, capital and land to firms, receiving wages, interest, rent and profits. They spend their incomes on goods and services produced by firms. Every dollar spent on final output becomes income to someone: workers, owners or lenders, or the government through taxes on production. As a result, GDP can be measured in three ways that give the same answer in principle: by adding up production (the value-added or output approach), by adding up incomes (the income approach), or by adding up spending on final goods and services (the expenditure approach). In practice, statistical agencies publish all three, and the small differences between them, called the statistical discrepancy, reflect measurement error.
The expenditure approach
The expenditure approach divides spending on final goods and services into four components. Consumption (C) is spending by households on goods and services, from groceries and clothing to rent, haircuts and streaming subscriptions; it is by far the largest component. Investment (I) is spending on new capital goods: business purchases of machinery, equipment, software and buildings, residential construction of new homes, and changes in business inventories. Note that investment in this sense does not mean buying stocks or bonds, which is a financial transaction that simply transfers ownership of existing assets. Government purchases (G) are spending by all levels of government on goods and services, including the salaries of teachers, nurses and soldiers and spending on roads and other public infrastructure; transfer payments such as pensions and employment insurance benefits are excluded, because they are not payment for current production. Net exports (NX) are exports minus imports. Exports are added because they are produced here; imports are subtracted because consumption, investment and government purchases include spending on imported goods that were produced abroad.
In Canada, Statistics Canada's expenditure-based GDP splits government spending into government final consumption expenditure and government gross fixed capital formation, and it reports household, non-profit and business investment separately. Canada's nominal GDP in 2025 was a little over 3 trillion dollars. Household consumption accounted for roughly 55 % of GDP, business and residential investment for roughly a fifth, government consumption and investment for roughly a quarter, and net exports were close to zero, with exports and imports each equal to about a third of GDP. These shares are rounded; the exact figures change slightly each quarter.
Worked problem
Calculating GDP by expenditure
An economy has consumption of 1,700, business investment of 380, residential investment of 160, inventory investment of 10, government purchases of 760, transfer payments of 300, exports of 1,000 and imports of 1,020 (all in billions). Calculate GDP.
Show solution
- Investment = 380 + 160 + 10 = 550.
- Transfer payments are excluded from G.
- Net exports = 1,000 − 1,020 = −20.
- GDP = 1,700 + 550 + 760 − 20 = 2,990 billion.
Answer: GDP is 2,990 billion dollars. Counting transfer payments would wrongly add 300 billion.
# Expenditure-approach GDP and component shares (illustrative, billions)
parts = {'Consumption': 1700, 'Investment': 550, 'Government purchases': 760,
         'Exports': 1000, 'Imports': -1020}
gdp = sum(parts.values())
print(f"GDP = {gdp:,} billion")
for name, v in parts.items():
    print(f"  {name:22s}{v:7,}  ({v / gdp * 100:5.1f} % of GDP)")
print(f"Trade openness (X + M) / GDP = {(1000 + 1020) / gdp * 100:.0f} %")GDP = 2,990 billion Consumption 1,700 ( 56.9 % of GDP) Investment 550 ( 18.4 % of GDP) Government purchases 760 ( 25.4 % of GDP) Exports 1,000 ( 33.4 % of GDP) Imports -1,020 (-34.1 % of GDP) Trade openness (X + M) / GDP = 68 %
Trade openness, the sum of exports and imports divided by GDP, is a rough measure of how exposed an economy is to the rest of the world. By this measure Canada is several times more open than the United States, which is one reason Canadian macroeconomic policy pays such close attention to the exchange rate and to US demand. Lesson 11 returns to this theme.
The income approach
The income approach adds up the incomes earned in production. The largest component is compensation of employees: wages, salaries and employers' contributions to pension plans and social insurance. The next is the gross operating surplus of corporations, which includes profits and depreciation. Mixed income covers the earnings of unincorporated businesses and self-employed people, which combine labour and capital income. Finally, taxes on production and imports, less subsidies, are added, because market prices include sales and excise taxes that are not anyone's factor income. The income approach shows how the value of output is divided between labour and capital. In both Canada and the United States, labour's share of income has drifted down somewhat since the 1980s, a trend economists link to technology, globalization and the declining bargaining power of workers, though the size and causes of the decline are debated.
| Approach | What is added | Main components |
|---|---|---|
| Production (value added) | Value of output minus intermediate inputs, by industry | Goods-producing and service-producing industries |
| Income | Incomes generated in production | Compensation of employees, operating surplus, mixed income, net taxes on production |
| Expenditure | Spending on final goods and services | Consumption, investment, government purchases, net exports |
GDP, GNI and income per person
GDP measures production within a country's borders. Gross national income (GNI), sometimes still called gross national product, measures the income received by a country's residents, wherever it is earned. GNI equals GDP plus income earned by residents abroad minus income paid to foreigners from domestic production. For most large economies, the two are close. For countries with large foreign ownership of their industries, such as Ireland, GDP can far exceed GNI, because much of the profit generated domestically flows abroad.
To compare living standards, economists divide GDP by population to obtain GDP per capita. A country's GDP can grow simply because its population is growing; what matters for average living standards is output per person. This distinction became important in Canada in 2023–2025: rapid population growth, driven mostly by temporary residents, meant that total real GDP kept rising while real GDP per capita fell for several quarters. Comparing GDP per capita across countries also requires converting currencies. Market exchange rates fluctuate and do not reflect differences in the prices of non-traded services such as haircuts and rent, so international comparisons usually use purchasing power parity (PPP) exchange rates, which adjust for differences in price levels. Lesson 11 explains PPP in more detail.
Worked problem
Total GDP versus GDP per capita
Real GDP grows 1.5 % in a year while the population grows 2.5 %. What happens to real GDP per capita?
Show solution
- Real GDP per capita growth ≈ GDP growth − population growth.
- 1.5 % − 2.5 % = −1.0 %.
- More precisely: 1.015 ÷ 1.025 − 1 = −0.98 %.
Answer: Real GDP per capita falls by about 1 %, even though total output grew. Headlines about GDP growth can hide a fall in average living standards.
Nominal and real GDP
Nominal GDP values output at the prices of the current year. It can rise either because more goods and services are produced or because prices are higher. To measure changes in the quantity of output, economists calculate real GDP, which values output at constant prices. The simplest method uses the prices of a base year. Statistical agencies now use chain-weighted measures, which update the price weights each year and link the results together, to avoid distortions when relative prices change a lot, as they have for computers. The GDP deflator is the ratio of nominal to real GDP, multiplied by 100. It measures the average level of prices of all goods and services included in GDP, and its growth rate is one measure of inflation.
Worked problem
Nominal GDP, real GDP and the deflator
An economy produces only two goods. In year 1 (the base year) it produces 100 pizzas at 10 dollars and 50 haircuts at 20 dollars. In year 2 it produces 110 pizzas at 11 dollars and 52 haircuts at 22 dollars. Calculate nominal GDP, real GDP and the deflator in each year, and the growth of real GDP.
Show solution
- Year 1 nominal = real = 100 × 10 + 50 × 20 = 2,000.
- Year 2 nominal = 110 × 11 + 52 × 22 = 1,210 + 1,144 = 2,354.
- Year 2 real (year 1 prices) = 110 × 10 + 52 × 20 = 1,100 + 1,040 = 2,140.
- Deflator: year 1 = 100; year 2 = 2,354 ÷ 2,140 × 100 = 110.0.
- Real growth = 2,140 ÷ 2,000 − 1 = 7.0 %; nominal growth = 17.7 %.
Answer: Nominal GDP rose 17.7 %, but most of that was higher prices: real output grew 7.0 % and the price level rose 10 %.
# Nominal GDP, real GDP (base-year prices) and the GDP deflator
prices = {1: {'pizza': 10, 'haircut': 20}, 2: {'pizza': 11, 'haircut': 22}, 3: {'pizza': 12, 'haircut': 23}}
qty = {1: {'pizza': 100, 'haircut': 50}, 2: {'pizza': 110, 'haircut': 52}, 3: {'pizza': 108, 'haircut': 56}}
base = 1
prev_real = None
for yr in (1, 2, 3):
    nominal = sum(prices[yr][g] * qty[yr][g] for g in qty[yr])
    real = sum(prices[base][g] * qty[yr][g] for g in qty[yr])
    deflator = nominal / real * 100
    growth = '' if prev_real is None else f"  real growth {(real / prev_real - 1) * 100:5.2f} %"
    print(f"Year {yr}: nominal {nominal:5,}  real {real:5,}  deflator {deflator:6.1f}{growth}")
prev_real = realYear 1: nominal 2,000 real 2,000 deflator 100.0 Year 2: nominal 2,354 real 2,140 deflator 110.0 real growth 7.00 % Year 3: nominal 2,584 real 2,200 deflator 117.5 real growth 2.80 %
What GDP leaves out
GDP is a measure of market production, not of well-being. Several important things are left out or poorly measured. Household production, such as cooking, cleaning and caring for children or older relatives at home, is not counted, even though the same services count when they are bought in the market. Volunteer work is excluded. The underground economy, including cash work that is not reported to tax authorities and illegal activities, is only partly captured through estimates. Leisure has value but no market price, so a country where people work fewer hours for the same output is better off than GDP suggests. Environmental damage is not subtracted: cutting down a forest raises GDP through logging, but the loss of the forest's other values is not counted, and spending to clean up a spill adds to GDP. Quality improvements and new products, such as free digital services, are hard to measure, which may understate real growth. And GDP says nothing about how income is distributed: average income can rise while most households see little gain.
These limitations have prompted efforts to measure well-being more broadly.
In 2021 the Government of Canada adopted a Quality of Life Framework with indicators covering prosperity, health, environment, society, and good governance, and federal budgets now include a quality-of-life analysis. Statistics Canada also publishes distributions of household economic accounts, which show how income, consumption and wealth are shared across households, and experimental estimates of the value of unpaid household work.
Despite its flaws, GDP remains valuable. It is strongly correlated with things people care about, including life expectancy, education, health and reported life satisfaction, and no alternative summary measure is as timely, comprehensive or comparable across countries. The sensible approach is to use GDP for what it does well, measuring market output and its growth, and to supplement it with other indicators when judging well-being.
Worked problem
Does it count in GDP?
State whether each transaction adds to this year's GDP: (a) a family buys a newly built house; (b) a family buys a 30-year-old house, paying an agent a 15,000 dollar commission; (c) the government pays employment insurance benefits; (d) a firm buys shares of another firm; (e) a firm adds unsold cars to its inventory; (f) a parent stays home to care for a child.
Show solution
- (a) Yes: residential investment.
- (b) Only the 15,000 dollar commission, a current service; the house was counted when built.
- (c) No: a transfer payment, not a purchase of output.
- (d) No: a financial transaction.
- (e) Yes: inventory investment counts current production.
- (f) No: household production is excluded.
Answer: Only (a), the commission in (b) and (e) add to GDP.
Common mistakes
MistakeInvestment in GDP means buying stocks and bonds.
InsteadInvestment means spending on new capital goods, housing and inventories; financial purchases only transfer ownership.
MistakeGovernment spending in GDP includes pensions and benefits.
InsteadTransfer payments are excluded; only purchases of goods and services count.
MistakeImports are subtracted because they are bad for the economy.
InsteadThey are subtracted because C, I and G include imported goods that were not produced here.
MistakeRising nominal GDP means the economy produced more.
InsteadNominal GDP can rise purely because of higher prices; use real GDP to measure output.
MistakeHigher GDP always means higher well-being.
InsteadGDP excludes leisure, household work, environmental damage and distribution.
Summary and key terms
- GDP is the market value of final goods and services produced within a country in a period.
- Value added avoids double counting intermediate goods.
- Output, income and expenditure are equal in principle; agencies publish all three.
- Expenditure GDP = C + I + G + (X − M); transfers and financial transactions are excluded.
- GNI measures residents' income; GDP per capita measures average output per person.
- Real GDP uses constant prices; the GDP deflator measures the average price of output.
- GDP omits household production, leisure, environmental damage and distribution, so it should be supplemented by other indicators.
- Gross domestic product (GDP)
- The market value of all final goods and services produced within a country in a period.
- Final good
- A good bought by its end user rather than used to make another good.
- Intermediate good
- A good used up in producing another good.
- Value added
- The value of a firm's output minus the value of intermediate inputs.
- Investment (in GDP)
- Spending on new capital goods, residential construction and inventory changes.
- Transfer payment
- A government payment that is not in exchange for current goods or services.
- Net exports
- Exports minus imports.
- Gross national income (GNI)
- The total income received by a country's residents.
- Real GDP
- GDP measured in constant prices.
- GDP deflator
- Nominal GDP divided by real GDP, times 100.
Practice problems
Work each problem on paper first, then reveal the answer to check.
Why are intermediate goods excluded from GDP?
Show answer
To avoid counting their value twice, since it is included in the price of final goods.
C = 600, I = 200, G = 250, X = 300, M = 330. Find GDP.
Show answer
600 + 200 + 250 − 30 = 1,020.
Does a pension payment count in G?
Show answer
No, it is a transfer payment.
Nominal GDP is 2,600 and the deflator is 130. Find real GDP.
Show answer
2,600 ÷ 1.30 = 2,000.
Real GDP grows 2 % and population 1 %. Approximate growth of real GDP per capita?
Show answer
About 1 %.
Why might GDP exceed GNI?
Show answer
Foreign owners receive much of the income generated domestically.
Give two things GDP leaves out.
Show answer
Household production, leisure, environmental damage, volunteer work, distribution.
Why are PPP exchange rates used for international comparisons?
Show answer
They adjust for differences in price levels, especially for non-traded services.
A firm sells 300 dollars of goods using 120 dollars of inputs. What is its value added?
Show answer
180 dollars.
Portfolio task: find your country's latest quarterly GDP release and report real growth, the annualized rate and which expenditure component contributed most.
Show answer
Answers vary; should cite the official release.
Lesson quiz · 5 questions
Score 60% or more to complete this lesson.
Create a free account to save your progress, take quizzes and earn a certificate.