
CMPUT-421 · Lesson 5 of 12 · 34 min
User research methods and research ethics
Design decisions are only as good as the understanding of users behind them. User research is the systematic study of users' goals, needs, behaviours and contexts, so that design is based on evidence rather than assumption. CMPUT-401 introduced the core qualitative methods from a product manager's perspective: choosing whom to learn from, interviewing well, contextual inquiry, and making sense of qualitative data through affinity mapping. This lesson places those methods in a broader landscape, adds diary studies, surveys, analytics and field methods, explains how to choose among them and how to analyse what they produce, and treats research ethics in detail, because HCI research with human participants is governed by formal ethics frameworks in both Canada and the United States.
A landscape of methods
Christian Rohrer's widely used landscape of user research methods arranges them on two axes. The first runs from attitudinal (what people say) to behavioural (what people do). The second runs from qualitative (direct observation or conversation that explains why and how) to quantitative (indirect measurement that answers how many and how much). A third dimension is the context of use: natural use of the product, scripted use in a study, use of a concept or no product at all. Interviews and focus groups are attitudinal and qualitative; surveys are attitudinal and quantitative; usability tests are behavioural and mostly qualitative; analytics and A/B tests are behavioural and quantitative; field studies and diary studies are behavioural and qualitative, in natural contexts.
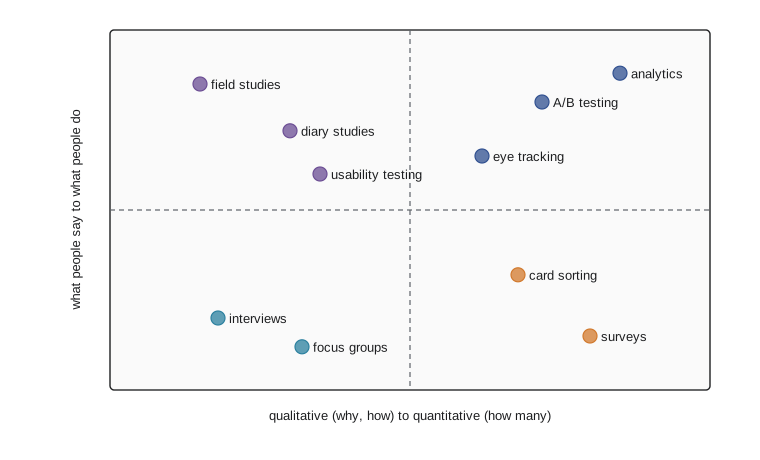
The axes matter because the two halves fail differently. People are poor at predicting their own future behaviour and at explaining past behaviour accurately, so attitudinal data about what users would do ('Would you use a feature that...?') is weak evidence. Behavioural data shows what happened but not why. Qualitative studies explain mechanisms but cannot say how common they are; quantitative studies say how common but not why. Good research programs triangulate: an analytics finding (40 per cent of riders abandon the fare purchase at the zone selection screen) prompts a qualitative study (watch riders try to choose a zone and ask them to think aloud), which suggests a fix, which a quantitative test then checks.
Methods also fit different stages of a project. Early, in discovery, the questions are open: who are the users, what are they trying to do, what gets in their way? Field studies, interviews and diary studies fit. In the middle, during design, the questions narrow: which of these options works better, can people find this? Card sorting, tree testing (lesson 6) and usability testing fit. Later, after launch, the questions are about performance at scale: how many people succeed, what changed after the release? Analytics, surveys and A/B tests fit.
Field studies and contextual inquiry
Field studies observe people in their own environments: a commuter at a bus stop in January, a dispatcher at a transit control centre, a customer service agent answering fare questions. They reveal workarounds, interruptions, physical constraints and social factors that people forget to mention and that no lab study would show. Hugh Beyer and Karen Holtzblatt's contextual inquiry, covered in CMPUT-401, structures this as a master-apprentice relationship in which the researcher watches real work and asks about it as it happens. Ethnography, from anthropology, goes further, with extended immersion. For RideLine, a team member riding routes at different times with riders who agreed to be shadowed found that many riders bought fares while walking to the stop, one-handed, often in bright sun or rain, which changed the design priorities more than any interview.
Diary studies and experience sampling
Diary studies ask participants to record their experiences over days or weeks, capturing behaviour that unfolds over time or happens rarely: how riders plan trips over a month, when service disruptions occur and how riders respond. Entries can be prompted (a daily reminder) or event-triggered (record each time you check arrivals). Experience sampling, from psychology, prompts participants at random times to report what they are doing and feeling. Both methods reduce reliance on memory but impose a burden that causes dropout; short entries, mobile capture with photos and voice, small incentives and regular contact help. Diary data are usually followed by an interview that walks through the entries.
Surveys and questionnaire design
Surveys measure attitudes, self-reported behaviour and characteristics across many people. They are easy to send and hard to do well. Questionnaire design is a craft with established rules. Ask one thing per question; 'Is the app fast and easy to use?' is double-barrelled. Avoid leading wording ('How much do you like the new design?') and loaded terms. Offer balanced response options, and include 'not applicable' where needed. Be specific about time frames ('in the past 7 days'). Put sensitive and demographic questions near the end. Keep the survey short, because completion falls with length. Pilot it with a few people and watch them answer, which catches misunderstood questions cheaply.
Likert items (after Rensis Likert, 1932) ask respondents to rate agreement with a statement on a scale, usually 5 or 7 points. They are ordinal: the distance between 'agree' and 'strongly agree' is not necessarily the same as between 'neutral' and 'agree'. Summaries should therefore report distributions, medians and the proportion in the top two boxes rather than means alone. Multi-item scales, such as the System Usability Scale (lesson 9), sum several items and behave more like interval data, which is why their means are commonly used.
Sampling decides what a survey can claim. A random sample from the population of interest supports estimates with a known margin of error; a convenience sample, such as whoever clicks a link in the app, may be biased toward heavy users and the strongly opinionated. Non-response bias arises when those who answer differ from those who do not. Margin of error depends on sample size and, for small populations, on the fraction sampled. The program below plans a RideLine rider survey and summarizes a Likert item honestly.
# Planning and reading a rider survey: margin of error, sample size with a finite
# population correction, and an honest summary of 5-point Likert items (invented data).
import math, random, statistics as st
random.seed(421)
z = 1.96                                           # 95% confidence
def moe(p, n, N=None):
    se = math.sqrt(p * (1 - p) / n)
    if N: se *= math.sqrt((N - n) / (N - 1))       # finite population correction
    return z * se
def needed(e, p=0.5, N=None):
    n0 = z * z * p * (1 - p) / (e * e)
    return math.ceil(n0 / (1 + (n0 - 1) / N)) if N else math.ceil(n0)
riders = 52000                                     # invented registered app users
for e in (0.10, 0.05, 0.03):
    print(f"margin of error ±{e:.0%}: need {needed(e):4} responses (infinite population), {needed(e, N=riders):4} from {riders}")
print(f"with 380 responses and 62% agreeing, margin of error is ±{moe(0.62, 380, riders):.1%}")
# Likert item: "Buying a fare in the app is easy" (1 = strongly disagree ... 5 = strongly agree)
weights = {"commuter": [5, 10, 15, 40, 30], "occasional": [20, 25, 25, 20, 10]}
for group, w in weights.items():
    resp = random.choices([1, 2, 3, 4, 5], weights=w, k=190)
    q1, med, q3 = st.quantiles(resp, n=4)
    top2 = sum(r >= 4 for r in resp) / len(resp)
    counts = [resp.count(k) for k in range(1, 6)]
print(f"{group:10} counts {counts} median {med:.0f} IQR {q1:.0f}-{q3:.0f} top-two-box {top2:.0%}")margin of error ±10%: need 97 responses (infinite population), 96 from 52000 margin of error ±5%: need 385 responses (infinite population), 382 from 52000 margin of error ±3%: need 1068 responses (infinite population), 1046 from 52000 with 380 responses and 62% agreeing, margin of error is ±4.9% commuter counts [6, 17, 31, 77, 59] median 4 IQR 3-5 top-two-box 72% occasional counts [40, 50, 61, 27, 12] median 3 IQR 2-3 top-two-box 21%
The sample-size figures show the familiar pattern: about 100 responses for a margin of plus or minus 10 percentage points, about 385 for 5 points and over 1,000 for 3 points, with the finite population correction making little difference when the population is large. The Likert summary shows why distributions matter: commuters and occasional riders have different medians and very different top-two-box proportions, and reporting a single mean for all riders would hide that the app works for regulars and fails newcomers. Margins of error describe only sampling error; they say nothing about bias from who chose to respond, which is often larger.
Analytics and log data
Instrumented products produce behavioural data at scale: page views, taps, funnels, search queries, error events, session lengths. Analytics answer how many and where: what share of riders reach the receipt screen, which search terms return nothing, where on the funnel people drop out. They are cheap per data point but need careful instrumentation, a privacy-respecting design (collect only what is needed, aggregate and retain briefly) and interpretation: a long session might signal engagement or confusion. CMPUT-401 covers product metrics and A/B testing; in HCI, analytics most often point to where qualitative research should look.
Analysing qualitative data
Qualitative data, such as interview transcripts, field notes, diary entries and open survey answers, are analysed by coding: labelling segments with short descriptive codes, grouping codes into themes and checking themes against the data. Virginia Braun and Victoria Clarke's reflexive thematic analysis (2006, refined since) is a widely used approach with six phases: familiarization, generating codes, constructing themes, reviewing themes, defining and naming them, and writing up. Affinity diagramming, covered in CMPUT-401, is a team-based variant using sticky notes. Grounded theory, from sociology, builds theory inductively through constant comparison. When several researchers code the same data, agreement can be measured with Cohen's kappa, as ROB-430 shows, though some qualitative traditions see agreement statistics as less important than reflexive, well-argued interpretation.
The output of analysis should be actionable: a small number of well-supported findings, each with evidence (quotes, observations, counts of how many participants showed it), and implications for design. For RideLine, three findings from the discovery research shaped the redesign: occasional riders did not understand fare zones and feared fines; daily riders wanted the next departure and their usual pass with almost no interaction; and screen reader users found the old app's map-first layout nearly unusable because the arrival times were only available by exploring the map.
Research ethics
Research with human participants carries obligations, and in academic and many public-sector settings it is governed by formal frameworks with independent review. The core principles are shared across countries, rooted in the Nuremberg Code (1947), the Declaration of Helsinki (1964) and, in the United States, the Belmont Report (1979): respect for persons (informed, voluntary consent and protection of those with diminished autonomy), beneficence or concern for welfare (minimizing risks and maximizing benefits) and justice (fair distribution of the burdens and benefits of research).
In Canada, research funded by the three federal research agencies (CIHR, NSERC and SSHRC), and research at institutions that receive their funds, must follow the Tri-Council Policy Statement: Ethical Conduct for Research Involving Humans, now in its second edition (TCPS 2), most recently updated in 2022. Its three core principles are respect for persons, concern for welfare and justice. Research is reviewed by a Research Ethics Board (REB) at the institution, with proportionate review: minimal-risk research, which includes most usability studies, can receive delegated review by one or a few board members rather than the full board. TCPS 2 sets out requirements for free, informed and ongoing consent, including the right to withdraw; for privacy and confidentiality; for research involving deception, which must be justified and usually followed by debriefing; and, in its Chapter 9, for research involving First Nations, Inuit and Métis peoples, which requires community engagement. Researchers typically complete the online TCPS 2 tutorial (CORE-2022). Quebec's Law 25 and federal and provincial privacy laws also govern personal information collected in studies.
| Topic | Canada | United States |
|---|---|---|
| Main framework | TCPS 2 (2022) | Common Rule, 45 CFR 46 (revised 2018) |
| Review body | Research Ethics Board (REB) | Institutional Review Board (IRB) |
| Light-touch review | Delegated review for minimal risk | Exempt or expedited review |
| Core principles | Respect for persons, concern for welfare, justice | Respect for persons, beneficence, justice (Belmont) |
| Indigenous research | TCPS 2 Chapter 9: community engagement with First Nations, Inuit and Métis | Tribal IRBs and tribal research codes for research with tribal nations |
| Training | TCPS 2 CORE-2022 tutorial | Institutional training, often CITI Program courses |
Informed consent in a usability study typically covers the purpose, what participants will do, how long it will take, any risks (usually minimal, such as mild frustration), how data, including recordings, will be stored, used and destroyed, whether quotes may be used and how participants will be identified, compensation, and the right to stop at any time without penalty. Participants must understand that the study evaluates the design, not them. Particular care is needed with vulnerable groups, such as children (who give assent while a parent consents), people with cognitive impairments, employees asked to evaluate their employer's tools (who may feel pressure to take part) and people in crisis.
Product teams in companies often do user research outside formal ethics review, but the principles still apply, and the line between product research and research on people can blur. In 2014, a paper in the Proceedings of the National Academy of Sciences reported that Facebook had altered the news feeds of 689,003 users for a week to show fewer positive or fewer negative posts and measured the emotional tone of their subsequent posts. The company relied on its data use policy as consent; the outcry that followed, and an editorial expression of concern by the journal, made the case that manipulating people's experience to study them requires more than agreement to terms of service. Many companies now have internal research review processes, and HCI venues require authors to state how their studies were reviewed.
Worked examples
Worked problem
Choosing methods
RideLine analytics show that 38 per cent of first-time users abandon the fare purchase at the zone selection screen. Plan a sequence of research to understand and fix this.
Show solution
- The analytics are behavioural and quantitative: they show where, not why.
- Run a small qualitative usability study (5 to 8 first-time riders) on the zone screen with think-aloud to see what confuses them.
- Optionally intercept riders at stops for short interviews about how they think about zones and fares.
- Design a fix (for example, infer zones from the planned trip) and check it with another small usability test, then measure the abandonment rate after release or in an A/B test.
Answer: Triangulate: analytics to locate, qualitative observation to explain, design, then quantitative measurement to confirm.
Worked problem
Fixing survey questions
Rewrite: (a) "How satisfied are you with the app's speed and reliability?" (b) "Don't you agree that real-time arrivals are useful?"
Show solution
- (a) is double-barrelled. Split into two questions, one about speed and one about reliability, each with a balanced scale.
- (b) is leading. Rewrite neutrally: "How useful, if at all, are real-time arrivals to you?" with options from "not at all useful" to "extremely useful" and "I have not used them".
Answer: One construct per question, neutral wording and balanced response options with a way out.
Worked problem
Sample size
How many responses are needed for a ±5 percentage point margin of error at 95 per cent confidence, assuming the worst case p = 0.5 and a large population?
Show solution
- \(n = z^2 p(1-p) / e^2 = 1.96^2 \times 0.25 / 0.05^2\).
- \(= 3.8416 \times 0.25 / 0.0025 = 384.2\), so 385 responses.
Answer: About 385 responses, assuming a random sample; a biased sample is not fixed by being large.
Common mistakes
MistakeAsk users what features they want and build those.
InsteadSelf-predictions are unreliable; observe behaviour and problems, then design and test solutions.
MistakeReport the mean of a single Likert item to two decimals.
InsteadLikert items are ordinal; report distributions, medians and top-box proportions.
MistakeA large convenience sample gives an accurate estimate.
InsteadLarge biased samples are precisely wrong; margin of error does not cover selection or non-response bias.
MistakeUsability testing in a company never raises ethical issues.
InsteadConsent, privacy of recordings, pressure on employee participants and manipulation of experience all raise ethical questions, whether or not formal review applies.
MistakeQualitative findings need dozens of participants to be valid.
InsteadQualitative research explains mechanisms; small, well-chosen samples suffice, and quantitative methods estimate prevalence.
Summary and key terms
- Research methods differ along attitudinal–behavioural and qualitative–quantitative axes, and by context of use.
- Triangulating methods compensates for their individual weaknesses; analytics locate problems and qualitative research explains them.
- Field studies, contextual inquiry and diary studies capture behaviour in natural contexts and over time.
- Good surveys ask one neutral question at a time, sample carefully and report Likert items as distributions.
- Margin of error falls with the square root of sample size; about 385 random responses give ±5 points at 95 per cent confidence.
- Thematic analysis turns qualitative data into actionable, evidence-backed findings.
- Research with people requires informed consent and, in academic settings, review by an REB under TCPS 2 in Canada or an IRB under the Common Rule in the United States.
- Attitudinal research
- Research about what people say: their opinions, beliefs and reported behaviour.
- Behavioural research
- Research about what people actually do.
- Triangulation
- Combining methods so that each compensates for the others' weaknesses.
- Diary study
- A study in which participants record their experiences over an extended period.
- Likert item
- A statement rated on an ordered agreement scale, typically with 5 or 7 points.
- Margin of error
- Half the width of a confidence interval for an estimate from a random sample.
- Non-response bias
- Bias that arises when people who respond differ systematically from those who do not.
- Thematic analysis
- A method for identifying, analysing and reporting patterns of meaning in qualitative data.
- Informed consent
- Voluntary agreement to take part in research based on an understanding of what it involves.
- Research ethics board
- A committee that reviews research involving humans; called an REB in Canada and an IRB in the United States.
Practice problems
Work each problem on paper first, then reveal the answer to check.
Place a usability test and a survey on Rohrer's two axes.
Show answer
A usability test is behavioural and mostly qualitative; a survey is attitudinal and quantitative.
Why is "Would you use this feature?" weak evidence?
Show answer
People are poor at predicting their own future behaviour.
What does a diary study capture that a single interview cannot?
Show answer
Behaviour and experiences over time, including rare events, recorded close to when they happen.
What is a double-barrelled question?
Show answer
A question that asks about two things at once.
Why should single Likert items not be summarized only by their mean?
Show answer
They are ordinal, and means hide the shape of the distribution.
Roughly how many random responses give a ±10 point margin of error at 95 per cent confidence?
Show answer
About 97, often rounded to 100.
Name the six phases of reflexive thematic analysis.
Show answer
Familiarization, coding, constructing themes, reviewing themes, defining and naming themes, writing up.
What are the three Belmont principles?
Show answer
Respect for persons, beneficence and justice.
What made the 2014 emotional contagion study controversial?
Show answer
Users' news feeds were manipulated to study their emotions without specific informed consent, relying on terms of service.
Give two special considerations when employees evaluate their employer's software.
Show answer
They may feel pressure to participate or to speak positively; confidentiality and voluntariness must be protected.
Lesson quiz · 5 questions
Score 60% or more to complete this lesson.
Create a free account to save your progress, take quizzes and earn a certificate.