
CMPUT-421 · Lesson 2 of 12 · 35 min
Human perception and cognition for designers
Every interface is processed by a human perceptual and cognitive system with well-studied strengths and limits. Designers who know those limits can predict where people will look, what they will notice, what they will forget and how long decisions will take. This lesson surveys the parts of perception and cognition that matter most for interface design: vision and colour, the organization of what we see (Gestalt principles), visual search and attention, memory, decision time and reading. It stays at the level a designer needs; PSYC-355 (sensation and perception) and PSYC-258 (cognitive psychology) cover the science in depth, and ROB-430 applies attention and workload to robot operators.
A useful frame is the model human processor of Card, Moran and Newell (1983), which describes a person as three interacting processors (perceptual, cognitive and motor) with memories, each with approximate cycle times: around 100 milliseconds for the perceptual processor (with a range of roughly 50 to 200), around 70 milliseconds for a cognitive cycle and around 70 milliseconds for a motor movement. The model is a deliberate simplification, but it explains why two flashes closer than about a tenth of a second blur together, why animation needs at least ten or so frames per second to look continuous, and why responses within about 100 milliseconds feel instantaneous, a figure that also appears in classic guidance on response times alongside about 1 second (the user's flow of thought is uninterrupted) and about 10 seconds (the limit of attention on a waiting task).
Vision
The eye resolves fine detail only in the fovea, a small central region covering about 2 degrees of visual angle, roughly the width of a thumbnail at arm's length. Outside it, acuity falls off steeply, though peripheral vision remains sensitive to motion and changes in brightness. People therefore read and inspect by moving their eyes in rapid jumps called saccades, with fixations of about 200 to 300 milliseconds in between; vision is effectively suppressed during the saccades themselves. Two consequences for design follow. A message placed far from where the user is looking, such as an error at the top of a long form when the user is at the bottom, may never be seen. And motion in the periphery is very good at capturing attention, which is why blinking banners and animated advertisements are distracting.
Visual angle is the right way to think about size. A target that subtends 1 degree is easy to see; text needs to be large enough that its x-height subtends at least about 0.2 degrees for comfortable reading, and larger for people with low vision. Because phones are held closer than monitors, the same physical size subtends a larger angle on a phone, which is one reason platform guidelines specify sizes in device-independent units rather than pixels.
Colour vision depends on three types of cone cells, sensitive to long (L), medium (M) and short (S) wavelengths. About 8 per cent of men and 0.5 per cent of women of northern European ancestry have some form of colour vision deficiency, most commonly a reduced or absent response from M cones (deuteranomaly or deuteranopia) or L cones (protanomaly or protanopia); rates are lower in many other populations. The practical result is difficulty distinguishing reds, greens, oranges and browns of similar lightness. Blue–yellow deficiencies (tritan) are rare. Colour vision also weakens with age as the lens yellows, and contrast sensitivity declines.
The design rule that follows is simple and appears in WCAG 2.2 as success criterion 1.4.1 (use of colour): never use colour as the only means of conveying information. Pair it with text, icons, shape, position or pattern. RideLine's old app showed trip status with a green badge for on time and a red badge for late, with no text. The program below uses published simulation matrices to estimate how those two badges look to people with the two common dichromacies.
# Simulating dichromatic vision with the Machado, Oliveira and Fernandes (2009) matrices
# (severity 1.0). This is an approximation for design checks, not a clinical model.
def to_lin(c):                                   # sRGB 0-255 to linear light 0-1
    c = c / 255
    return c / 12.92 if c <= 0.04045 else ((c + 0.055) / 1.055) ** 2.4
def to_srgb(v):
    v = min(max(v, 0.0), 1.0)
    v = 12.92 * v if v <= 0.0031308 else 1.055 * v ** (1 / 2.4) - 0.055
    return round(v * 255)
M = {
    "protanopia":   [[0.152286, 1.052583, -0.204868], [0.114503, 0.786281, 0.099216], [-0.003882, -0.048116, 1.051998]],
    "deuteranopia": [[0.367322, 0.860646, -0.227968], [0.280085, 0.672501, 0.047413], [-0.011820, 0.042940, 0.968881]],
}
def simulate(hexcode, kind):
    rgb = [int(hexcode[i:i + 2], 16) for i in (1, 3, 5)]
    lin = [to_lin(c) for c in rgb]
    out = [sum(M[kind][r][k] * lin[k] for k in range(3)) for r in range(3)]
    return "#" + "".join(f"{to_srgb(v):02x}" for v in out)
def dist(h1, h2):                                # plain RGB distance, enough to flag near-identical pairs
    a = [int(h1[i:i + 2], 16) for i in (1, 3, 5)]; b = [int(h2[i:i + 2], 16) for i in (1, 3, 5)]
    return sum((x - y) ** 2 for x, y in zip(a, b)) ** 0.5
on_time, late = "#2e9e44", "#d23b2f"             # RideLine's old status badges: green and red
for kind in M:
    s1, s2 = simulate(on_time, kind), simulate(late, kind)
print(f"{kind:13} on time {on_time} -> {s1}, late {late} -> {s2}, distance {dist(on_time, late):.0f} -> {dist(s1, s2):.0f}")protanopia on time #2e9e44 -> #a0903b, late #d23b2f -> #685e2c, distance 193 -> 77 deuteranopia on time #2e9e44 -> #93864b, late #d23b2f -> #8d7f29, distance 193 -> 35
For simulated protanopia the distance between the two badges falls to about 40 per cent of its original value, and for deuteranopia to under a fifth: the badges become two similar olive or brownish tones, differing mainly in lightness under protanopia and barely at all under deuteranopia. The fix is not to pick different hues alone but to add redundancy: the redesigned RideLine badge reads 'On time' or 'Late 6 min', uses a check mark or a clock icon, and differs in lightness as well as hue. Lightness contrast matters for everyone and is the basis of the contrast ratio calculation in lesson 10.
Organizing what we see: Gestalt principles
Early twentieth-century Gestalt psychologists, including Max Wertheimer, Wolfgang Köhler and Kurt Koffka, described how the visual system groups elements into wholes. Several of their principles are everyday tools of interface layout. Proximity: elements close together are seen as a group, so a label should be closer to its own field than to the next one. Similarity: elements that share colour, shape or size are seen as related, so all clickable links should look alike and unlike plain text. Common region: elements inside a shared boundary, such as a card or panel, form a group. Continuity: the eye follows smooth lines and curves, which helps with alignment. Closure: we complete incomplete shapes, which is why simple, partly drawn icons still read clearly. Figure–ground: we separate an object from its background, which modal dialog boxes exploit by dimming the page behind them. Common fate: elements that move together are grouped, as when selected items move as one.
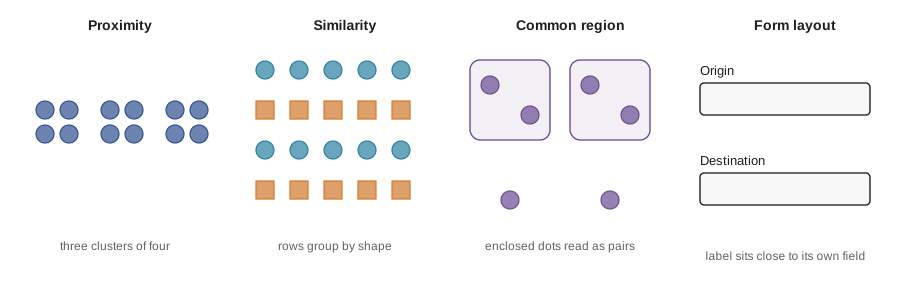
Gestalt principles often explain layout problems that users cannot articulate. If the label 'Destination' sits equidistant between two text fields, users hesitate over which field it labels. If a 'Delete' button sits inside the same card as the save controls, it is grouped with them and pressed by mistake. Grouping by proximity and region is free, needs no extra words, and works for sighted users at a glance; the same structure must also be exposed in the markup (headings, lists, field labels) so that screen reader users get the grouping too.
Visual search and pre-attentive features
Some visual features are processed in parallel across the whole visual field, before focused attention: a single red item among grey ones, a tilted line among upright ones, a large item among small ones, a moving item among still ones. Searching for such a pop-out target takes about the same time no matter how many distractors there are. Searching for a conjunction of features, such as a red circle among red squares and blue circles, requires serial inspection, and time grows roughly linearly with the number of items. Anne Treisman's feature integration theory (1980) explains this difference. Designers use pre-attentive features to make the one thing that matters, such as a service disruption or a validation error, stand out; using them for many things at once destroys the effect.
Eye-tracking studies of web pages have found common scanning patterns, such as the F-shaped pattern in which users read the first lines of text, then a shorter line further down, then scan the left edge. Such patterns describe how people skim text-heavy pages when they have little reason to read, not a law to design for. Good information design (front-loaded headings, meaningful link text, short paragraphs) reduces the need to scan at all.
Attention
Attention is limited and selective. Selective attention lets people focus on one source while filtering others, as in following one conversation at a noisy party. Divided attention, doing two tasks at once, works only when the tasks use different resources and are well practised; Christopher Wickens's multiple resource theory describes how visual and auditory channels, spatial and verbal codes, and perception and response compete or coexist, and is the basis of guidance on in-vehicle interfaces (lesson 11). Sustained attention, or vigilance, declines over time on monotonous monitoring tasks.
Two striking phenomena show how much people miss. In change blindness, people fail to notice large changes in a scene when the change coincides with a brief disruption, such as a page reload or a saccade; a total that silently updates while the user looks elsewhere may go unnoticed. In inattentional blindness, people focused on one task fail to see an unexpected object in plain view, as in the famous experiment by Daniel Simons and Christopher Chabris (1999) in which many observers counting basketball passes missed a person in a gorilla suit. Designs that rely on users noticing a subtle change, an unobtrusive toast message or a banner far from their focus are fragile. Important state changes should be placed where attention already is, signalled through more than one channel, and, for screen reader users, announced through live regions.
Memory
Working memory holds the small amount of information a person is actively using. George Miller's 1956 paper famously suggested 'seven, plus or minus two' items, but later work, notably by Nelson Cowan (2001), puts the capacity at about four chunks when rehearsal and grouping are controlled. A chunk is a meaningful unit: the sequence 1 9 6 8 is four digits to one person and a single chunk, a year, to another. Working memory contents also decay within seconds without rehearsal and are easily displaced by interruptions.
Long-term memory is vast but retrieval is the bottleneck, and recognition is much easier than recall. This is the basis of one of Nielsen's heuristics (lesson 4), recognition rather than recall: menus, autocomplete, recently used lists and visible options let users recognize what they want instead of remembering commands. Command lines demand recall and reward experts; graphical interfaces trade some speed for recognition. Designs should never require users to carry information from one screen to another in their heads, such as a confirmation code shown on one page and needed on the next; WCAG 2.2 success criterion 3.3.7 (redundant entry) similarly requires that information already entered be auto-filled or selectable rather than re-typed.
Mental effort is often discussed as cognitive load. John Sweller's cognitive load theory distinguishes intrinsic load (the inherent complexity of the task), extraneous load (load imposed by poor presentation) and germane load (effort that builds understanding). Interface design mostly aims to cut extraneous load: removing irrelevant choices, keeping related information together, using consistent layouts and defaults, and showing the user's current position and options.
Decision time: the Hick–Hyman law
How long does it take to choose among options? William Hick (1952) and Ray Hyman (1953) found that choice reaction time increases with the information content of the choice. For n equally likely alternatives, the Hick–Hyman law is
where a and b are fitted constants and the + 1 accounts for the possibility of not responding. For unequal probabilities, the logarithm is replaced by the information (entropy) of the choice, so frequently chosen options are found faster. The program below fits the law to invented, seeded reaction time data and shows the effect of skewed usage.
# Hick-Hyman law: choice reaction time grows with the information in the choice,
# T = a + b * log2(n + 1) for n equally likely options.
# Invented, seeded data stand in for a lab study; we recover a and b by least squares.
import math, random
random.seed(421)
true_a, true_b = 0.20, 0.155                  # seconds and seconds per bit (illustrative)
rows = []
for n in (1, 2, 4, 8, 16, 32):
    for trial in range(40):
        bits = math.log2(n + 1)
        rows.append((bits, true_a + true_b * bits + random.gauss(0, 0.06)))
xs, ys = [r[0] for r in rows], [r[1] for r in rows]
mx, my = sum(xs) / len(xs), sum(ys) / len(ys)
b = sum((x - mx) * (y - my) for x, y in rows) / sum((x - mx) ** 2 for x in xs)
a = my - b * mx
ss_res = sum((y - (a + b * x)) ** 2 for x, y in rows); ss_tot = sum((y - my) ** 2 for y in ys)
print(f"fitted: T = {a:.3f} + {b:.3f} * log2(n + 1)   (R^2 = {1 - ss_res / ss_tot:.2f})")
for n in (4, 8, 16, 64):
    print(f"  predicted time to choose among {n:2} equally likely items: {a + b * math.log2(n + 1):.2f} s")
# unequal probabilities: information is the entropy H = sum p * log2(1/p + 1) in Hyman's form
p = [0.6, 0.2, 0.1, 0.05, 0.05]               # one menu item is chosen most of the time
H = sum(pi * math.log2(1 / pi + 1) for pi in p)
print(f"five items, skewed use: effective bits {H:.2f} vs {math.log2(6):.2f} for five equal items")fitted: T = 0.204 + 0.153 * log2(n + 1) (R^2 = 0.93) predicted time to choose among 4 equally likely items: 0.56 s predicted time to choose among 8 equally likely items: 0.69 s predicted time to choose among 16 equally likely items: 0.83 s predicted time to choose among 64 equally likely items: 1.13 s five items, skewed use: effective bits 2.15 vs 2.58 for five equal items
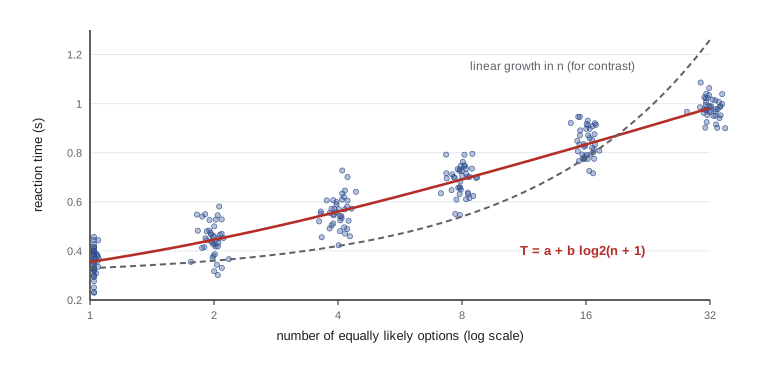
The fitted constants are close to the values used to generate the data, and the predictions show the law's most important property: doubling the number of options adds a constant increment, not a doubling, of decision time. Two cautions keep the law in its place. It applies to choices where the user knows what they want and must find and select it among familiar options; it does not apply to unfamiliar menus that must be read item by item, where search is closer to linear, nor to genuinely hard decisions such as choosing a fare product without understanding the zones. And it says nothing about errors: more options can also mean more wrong choices. Designers sometimes cite Hick's law to argue for fewer options, but the more defensible lesson is to organize options so that users can narrow them quickly (grouping, ordering by frequency, progressive disclosure) and to put the most common choice first.
Reading
Reading on screens benefits from the same typographic practices as print: adequate size, high contrast, comfortable line length (often cited as about 45 to 75 characters for body text), generous line spacing and left-aligned text in left-to-right languages, since justified text produces uneven word spacing. People read words largely by recognizing their shapes and letter combinations within a fixation; all-capital text is slower to read in long passages because it removes the variation of ascenders and descenders. Readability formulas such as Flesch–Kincaid are crude but can flag dense prose, and plain language standards, such as ISO 24495-1 (2023), give organizations a tested process for writing clear content. Lesson 7 returns to typography as part of visual design.
Worked examples
Worked problem
Hick–Hyman prediction
With a = 0.2 s and b = 0.15 s per bit, how much longer does it take to choose among 15 equally likely fare products than among 3?
Show solution
- For 3 options: \(0.2 + 0.15 \log_2 4 = 0.2 + 0.30 = 0.50\) s.
- For 15 options: \(0.2 + 0.15 \log_2 16 = 0.2 + 0.60 = 0.80\) s.
- The difference is 0.30 s, even though there are five times as many options.
Answer: About 0.3 s longer, provided users already know which product they want; if they must read and compare products, time grows much faster.
Worked problem
Chunking a confirmation code
A RideLine refund confirmation code is shown as K7R2QX9M and must be read aloud to an agent. Suggest a change based on working memory.
Show solution
- Eight unrelated characters exceed a capacity of about four chunks.
- Split the code into two groups of four, K7R2 QX9M, so each group is one chunk.
- Remove easily confused characters (O and 0, I and 1) from the alphabet.
- Better still, let the user copy the code or have the agent look it up, so no one has to remember it.
Answer: Group the code into chunks, avoid confusable characters, and remove the need to remember it at all where possible.
Worked problem
Using colour redundantly
A trip planner draws three routes on a map in red, green and blue lines. Make the display usable for someone with deuteranopia.
Show solution
- Red and green lines may look alike to someone with deuteranopia, so colour cannot be the only distinguishing feature.
- Add a second channel: different line patterns (solid, dashed, dotted) or labels placed on each line.
- Pick hues that also differ in lightness, and check them with a simulator.
- Provide a text list of the routes next to the map for screen reader users and anyone who prefers it.
Answer: Encode route identity redundantly with pattern, labels and lightness, and provide a text alternative.
Common mistakes
MistakePeople can remember about seven items, so seven unrelated steps is fine.
InsteadWorking memory holds about four chunks under realistic conditions, and less when people are interrupted; never rely on users remembering information between screens.
MistakeA red outline is enough to show an invalid field.
InsteadColour alone fails users with colour vision deficiencies and is easy to miss; add an icon and a text message next to the field.
MistakeHick's law proves that fewer menu items are always better.
InsteadIt applies to familiar, known choices; organizing many options well can beat hiding them, and errors and findability also matter.
MistakeUsers will notice an important update anywhere on the screen.
InsteadChange blindness and inattentional blindness mean updates away from the user's focus are often missed; place them near attention and use more than one channel.
MistakeAnimated elements are a good way to make everything feel lively.
InsteadPeripheral motion captures attention involuntarily; reserve it for what truly needs attention and respect reduced-motion settings.
Summary and key terms
- The model human processor gives rough cycle times for perception, cognition and action, explaining response-time thresholds of about 0.1, 1 and 10 seconds.
- Only the fovea sees detail; people scan with saccades and fixations, and peripheral motion captures attention.
- About 8 per cent of men of northern European ancestry have a colour vision deficiency, so colour must never be the only carrier of information.
- Gestalt principles such as proximity, similarity and common region determine how users group interface elements.
- Pre-attentive features pop out in parallel; conjunction search is serial and slower.
- Attention is limited: change blindness and inattentional blindness mean users miss changes away from their focus.
- Working memory holds about four chunks; designs should rely on recognition rather than recall.
- The Hick–Hyman law predicts that choice time grows with the logarithm of the number of equally likely options.
- Fovea
- The small central region of the retina that resolves fine detail, about 2 degrees of visual angle.
- Saccade
- A rapid jump of the eyes between fixations.
- Colour vision deficiency
- Reduced ability to distinguish certain hues, most often reds and greens, because of altered cone responses.
- Gestalt principles
- Rules describing how the visual system groups elements into wholes, such as proximity and similarity.
- Pre-attentive processing
- Parallel detection of simple features across the visual field before focused attention.
- Change blindness
- Failure to notice a change in a scene that coincides with a disruption.
- Working memory
- The limited store holding information currently in use, about four chunks.
- Chunk
- A meaningful unit of information that working memory treats as one item.
- Hick–Hyman law
- The finding that choice reaction time grows with the information content, about log2(n + 1) for n equal options.
- Cognitive load
- The mental effort a task demands, divided into intrinsic, extraneous and germane load.
Practice problems
Work each problem on paper first, then reveal the answer to check.
What is the approximate size of foveal vision in degrees of visual angle?
Show answer
About 2 degrees.
Name two consequences of the fovea being small for interface design.
Show answer
Messages far from the user's focus may not be seen, and people must scan pages with eye movements; peripheral motion is distracting.
What does WCAG success criterion 1.4.1 require?
Show answer
That colour is not the only visual means of conveying information.
Which Gestalt principle explains why a label should be closer to its own field than to others?
Show answer
Proximity.
Why does finding a red circle among red squares and blue circles take longer as items are added?
Show answer
It is a conjunction search, which requires serial attention to each item.
What capacity does Cowan propose for working memory?
Show answer
About four chunks.
Give an example of recognition rather than recall in an interface.
Show answer
Autocomplete of stop names, menus, or a recent trips list instead of typing from memory.
Using the Hick–Hyman law with b = 0.2 s per bit, how much does going from 7 to 15 equal options add?
Show answer
0.2 × (log2 16 − log2 8) = 0.2 s.
Why might a total that updates silently go unnoticed?
Show answer
Change blindness: changes that coincide with an eye movement or a reload, or that occur away from the focus of attention, are often missed.
Name the three kinds of cognitive load in Sweller's theory.
Show answer
Intrinsic, extraneous and germane.
Lesson quiz · 5 questions
Score 60% or more to complete this lesson.
Create a free account to save your progress, take quizzes and earn a certificate.