
CISSP-115 · Lesson 11 of 12 · 28 min
Analysing results and reporting to management
Assessment work has value only when it changes decisions. A scan with 4,000 findings, an audit with 23 recommendations or a dashboard of 60 metrics can each leave management no wiser, or can show clearly where the organization is exposed and what to do next. The difference lies in analysis and reporting. Sub-domain 6.4 of the outline, analyse test output and generate reports, covers remediation, exception handling and ethical disclosure, and it is the bridge between the technical results of earlier lessons and the governance decisions that boards and executives make.
This lesson covers how to turn findings into risk-ranked results, how to track remediation and handle exceptions and risk acceptance, how to choose and present metrics for different audiences, and how to handle findings that affect parties outside the organization. The calculations use seeded, synthetic data so the method is clear and the results are repeatable.
From findings to risk
Raw findings are not risks. A finding describes a condition, such as a missing patch on a server or an access review that was not completed. A risk statement adds what could happen and why it matters: an attacker could exploit the missing patch on the internet-facing payment server to steal card data, leading to regulatory penalties and loss of customers. Analysis turns conditions into risks by adding context: the value and exposure of the asset, the threats likely to act on it, the controls that already reduce the likelihood or impact, and the organization's risk appetite.
A useful finding record follows a consistent structure, often called the five Cs of audit findings: condition (what was found), criteria (what should be, such as a policy or standard), cause (why the gap exists), consequence or effect (the risk if it is not fixed) and corrective action (what should be done). The cause is often the most valuable part, because fixing the cause prevents the same finding from reappearing next year.
| Element | Question | Example |
|---|---|---|
| Condition | What did we find? | 9 of 40 sampled privileged accounts had no review in the last quarter |
| Criteria | What should be in place? | Access standard: privileged access reviewed quarterly |
| Cause | Why does the gap exist? | Review tool does not include accounts in the new cloud platform |
| Consequence | What could happen? | Unneeded administrator access persists and could be misused undetected |
| Corrective action | What should be done? | Add the cloud platform to the review tool and review all cloud admin accounts now |
Ranking and grouping
Management cannot act on hundreds of separate items, so analysis ranks and groups them. Ranking uses a consistent risk rating, combining likelihood and impact, and for technical vulnerabilities draws on the CVSS, EPSS and KEV signals from lesson 4. Grouping looks for themes: many findings on different systems with the same cause point to a process failure, as the penetration testing lesson showed. Root cause analysis techniques, such as asking why repeatedly or mapping causes on a fishbone diagram, help move from symptoms to causes.
import random
random.seed(611)
# Synthetic findings from several assessments, grouped by root-cause theme
themes = ['patch management', 'access reviews', 'logging coverage', 'secure configuration', 'vendor assurance']
weights = [0.38, 0.18, 0.14, 0.22, 0.08]
ratings = ['critical', 'high', 'medium', 'low']
findings = []
for i in range(120):
    theme = random.choices(themes, weights)[0]
    rating = random.choices(ratings, [0.06, 0.24, 0.45, 0.25])[0]
    findings.append((theme, rating))
score = {'critical': 10, 'high': 6, 'medium': 3, 'low': 1}
by_theme = {}
for theme, rating in findings:
    t = by_theme.setdefault(theme, {'count': 0, 'score': 0, 'crit_high': 0})
    t['count'] += 1
    t['score'] += score[rating]
    t['crit_high'] += rating in ('critical', 'high')
print(f'{"theme":22s} {"findings":>8s} {"crit+high":>9s} {"risk score":>10s}')
for theme, t in sorted(by_theme.items(), key=lambda kv: -kv[1]['score']):
print(f"{theme:22s} {t['count']:>8d} {t['crit_high']:>9d} {t['score']:>10d}")theme findings crit+high risk score patch management 48 13 161 secure configuration 24 7 87 access reviews 26 6 76 logging coverage 15 1 42 vendor assurance 7 3 32
Presented this way, 120 findings become five themes in priority order, each of which can have an owner, a budget and a plan. The weighting is a simple illustration; organizations should use their own risk methodology, but the principle of grouping by cause and ranking by risk applies to any scheme.
Remediation tracking
Every accepted finding becomes a remediation item with an owner, a target date based on its risk rating, and a status. Tracking these items is a control in its own right, and its data tells management whether the organization is getting better or merely documenting its problems. Common measures are the number of open items by rating and age, the percentage closed within target, the mean time to remediate (MTTR) by rating, the number of items past due and the number of items that reopened because the fix did not hold.
import random, statistics
random.seed(42)
# Synthetic remediation records: rating, days to close (None = still open), target days
targets = {'critical': 15, 'high': 30, 'medium': 90}
records = []
for rating, n, mean in (('critical', 18, 12), ('high', 60, 34), ('medium', 140, 70)):
    for _ in range(n):
        days = max(1, int(random.expovariate(1 / mean)))
        still_open = random.random() < 0.08
        records.append((rating, None if still_open else days))
for rating, target in targets.items():
    closed = [d for r, d in records if r == rating and d is not None]
    open_n = sum(1 for r, d in records if r == rating and d is None)
    within = sum(1 for d in closed if d <= target)
    print(f'{rating:8s} closed {len(closed):3d}  open {open_n:2d}  MTTR {statistics.mean(closed):5.1f} d  '
f'median {statistics.median(closed):4.1f} d within {target} d target: {within / len(closed):.0%}')critical closed 15 open 3 MTTR 11.9 d median 9.0 d within 15 d target: 60% high closed 56 open 4 MTTR 39.8 d median 22.0 d within 30 d target: 59% medium closed 130 open 10 MTTR 75.5 d median 44.0 d within 90 d target: 68%
The mean and median differ. Remediation times are usually skewed: most items close quickly, while a few take a very long time. The mean is pulled up by those few, while the median shows the typical case. Reporting both, and highlighting the oldest open items, gives a truer picture than either alone. The percentage closed within target is often the most useful single figure for executives, because it relates directly to the service levels the organization has committed to.
Exceptions and risk acceptance
Not every finding can or should be fixed on schedule. A legacy system may be impossible to patch until it is replaced, or a fix may cost more than the risk it reduces. In these cases the organization grants an exception or formally accepts the risk. Exception handling is itself a control, and auditors examine it closely. A sound process records the finding, the business reason, the compensating controls that reduce the risk in the meantime, the residual risk, the person accepting it (who must have the authority for that level of risk under the risk appetite) and an expiry date after which the exception must be renewed or closed.
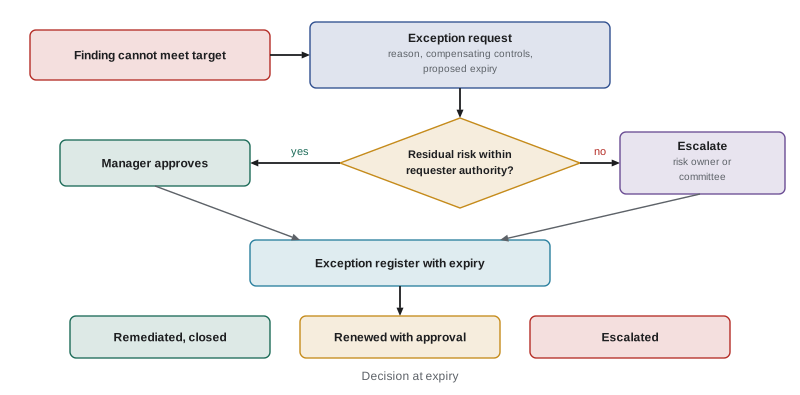
Exceptions that never expire become permanent, invisible risk. A register of active exceptions, reported with their ages and residual risk ratings, keeps them visible. A rising number of exceptions, or exceptions concentrated in one business unit, is a key risk indicator worth reporting to the risk committee.
Worked problem
An exception request
A manufacturing plant runs a control system on an unsupported operating system that cannot be patched until a line upgrade in 18 months. Scans report it as critical. The plant manager asks for an exception. What should the security manager require?
Show solution
- Confirm the facts: the system cannot be patched or upgraded sooner without halting production.
- Require compensating controls: network isolation with only necessary connections, application allow-listing, removal of internet access, monitoring and an offline backup of the configuration.
- Assess residual risk after those controls and route the request to someone with authority for that risk level, likely the plant's executive and the risk committee.
- Set an expiry aligned to the line upgrade, with quarterly checks that the compensating controls remain effective.
- Record the exception in the register and include it in risk reporting.
Answer: Approve a time-limited exception only with strong compensating controls, approval at the right level and periodic verification until the upgrade.
Reporting to different audiences
Reports must fit their readers. Engineers need detailed findings with evidence and remediation steps. Managers need status against targets, themes and the resources required. Executives and boards need a short view of risk in business terms: where the organization stands against its risk appetite, how that is changing, what the major decisions are and whether the program is on track. The same data feeds all three, at different levels of aggregation.
| Audience | Main questions | Useful content | Typical frequency |
|---|---|---|---|
| Board or audit committee | Are we within risk appetite? Are major risks managed? | Top risks and trends, KRIs against thresholds, audit status, major exceptions | Quarterly |
| Executives | Where should we invest and what decisions are needed? | Themes, program progress, resource needs, risk acceptances requiring sign-off | Monthly or quarterly |
| Managers and system owners | What must my team fix, by when? | Open findings by owner, due and overdue items, exception expiries | Weekly or monthly |
| Engineers | How do I fix this? | Detailed findings, evidence, remediation guidance, retest results | Continuous |
Effective dashboards follow a few rules. Show trends, not only current values, because direction often matters more than level. Show targets or thresholds, so readers can see whether a number is good or bad. Use consistent colours, such as red, amber and green, with documented meanings, and avoid colouring everything amber. Include coverage, so a metric that looks good is not hiding a blind spot. Keep the number of headline metrics small; a board view of six to ten indicators is usually enough.
Worked problem
Rewriting a board report
The security team's quarterly board report is 30 pages of charts of blocked attacks, scan counts and tool statistics. Board members say they cannot tell whether things are getting better. How should the report be redesigned?
Show solution
- Start with a one-page summary: overall risk position against appetite, the top five risks and how each changed since last quarter.
- Replace activity counts, such as blocked attacks, with outcome and risk measures, such as critical exposures remediated on time and privileged accounts with phishing-resistant MFA.
- Show each headline metric with its target and trend over four quarters.
- List decisions the board needs to make, such as approving a risk acceptance or funding a remediation theme.
- Move detail to an appendix for members who want it.
Answer: A short risk-based summary with targets, trends and decisions, with activity statistics moved to an appendix or dropped.
Ethical disclosure of findings
Sometimes an assessment finds a problem that affects people outside the organization: a vulnerability in a vendor's product, a weakness in an open-source component, or evidence that customer data was exposed. The outline names ethical disclosure as part of reporting. For third-party vulnerabilities, coordinated vulnerability disclosure means reporting privately to the vendor, giving a reasonable time to fix before any publication, and involving a coordinator such as a national CSIRT if the vendor does not respond. ISO/IEC 29147 describes how vendors should receive and handle disclosures, and ISO/IEC 30111 describes how they should process them internally.
In Canada, the Canadian Centre for Cyber Security accepts vulnerability reports and helps coordinate disclosure, and the Government of Canada has published a vulnerability disclosure policy for its own systems. If an assessment reveals a breach of security safeguards involving personal information under PIPEDA that creates a real risk of significant harm, the organization must report it to the Privacy Commissioner of Canada and notify affected individuals as soon as feasible; Quebec's Law 25 has similar obligations for confidentiality incidents presenting a risk of serious injury. Regulated sectors have their own reporting duties, such as OSFI's technology and cyber incident reporting expectations.
Common mistakes
MistakeReporting findings without causes.
InsteadUse the five Cs so that fixes address root causes.
MistakePresenting hundreds of findings individually to executives.
InsteadGroup findings into themes and rank them by risk.
MistakeReporting only mean time to remediate.
InsteadReport median, mean, on-time percentage and the oldest open items.
MistakeGranting exceptions without expiry dates or compensating controls.
InsteadRequire compensating controls, the right approver and an expiry date.
MistakeFilling board reports with activity counts.
InsteadReport risk against appetite, trends, targets and decisions needed.
MistakePublishing a third-party vulnerability as soon as it is found.
InsteadUse coordinated disclosure and give the vendor reasonable time to fix.
Summary and key terms
- Findings become risks when analysis adds asset value, threats, existing controls and risk appetite.
- The five Cs (condition, criteria, cause, consequence, corrective action) make findings actionable.
- Grouping findings by root cause and ranking by risk turns long lists into manageable themes.
- Remediation tracking uses on-time closure, mean and median time to remediate, past-due and reopened items.
- Exceptions need compensating controls, approval at the right level, a register and expiry dates.
- Reports aggregate the same data differently for boards, executives, managers and engineers.
- Findings affecting outside parties call for coordinated disclosure and any legal notification duties.
- Finding
- A documented condition identified by a test, assessment or audit.
- Five Cs
- Condition, criteria, cause, consequence and corrective action in a finding.
- Root cause analysis
- Investigation to identify the underlying cause of a problem rather than its symptoms.
- Mean time to remediate
- The average time taken to close findings, usually reported by severity.
- Exception
- A formally approved, time-limited departure from a requirement.
- Risk acceptance
- A decision by an authorized person to tolerate a residual risk.
- Compensating control
- A control that reduces risk when the primary control cannot be implemented.
- Exception register
- A record of active exceptions with owners, residual risk and expiry dates.
- Risk appetite
- The amount and type of risk an organization is willing to accept in pursuit of its objectives.
- Coordinated vulnerability disclosure
- Reporting a vulnerability privately so it can be fixed before publication.
Practice problems
Work each problem on paper first, then reveal the answer to check.
What does analysis add to a raw finding to make it a risk?
Show answer
Context: asset value and exposure, likely threats, existing controls and risk appetite.
Name the five Cs of a finding.
Show answer
Condition, criteria, cause, consequence and corrective action.
Why is the cause the most valuable part of a finding?
Show answer
Fixing it prevents the same problem from recurring.
Why report the median as well as the mean time to remediate?
Show answer
Remediation times are skewed, so the mean is pulled up by a few long cases.
What must every exception record include?
Show answer
Business reason, compensating controls, residual risk, an authorized approver and an expiry date.
What makes a growing exception register a concern?
Show answer
It signals accumulating accepted risk and may indicate process or resource problems.
What should a board report focus on?
Show answer
Risk against appetite, top risks and trends, KRIs against thresholds and decisions required.
Give two rules for effective dashboards.
Show answer
Show trends and targets; include coverage; use consistent colours; limit headline metrics.
What is coordinated vulnerability disclosure?
Show answer
Reporting a vulnerability privately to the vendor with time to fix before publication.
Which ISO standards address vulnerability disclosure and handling?
Show answer
ISO/IEC 29147 and ISO/IEC 30111.
Lesson quiz · 5 questions
Score 60% or more to complete this lesson.
Create a free account to save your progress, take quizzes and earn a certificate.