
CISSP-115 · Lesson 10 of 12 · 29 min
Collecting security process data
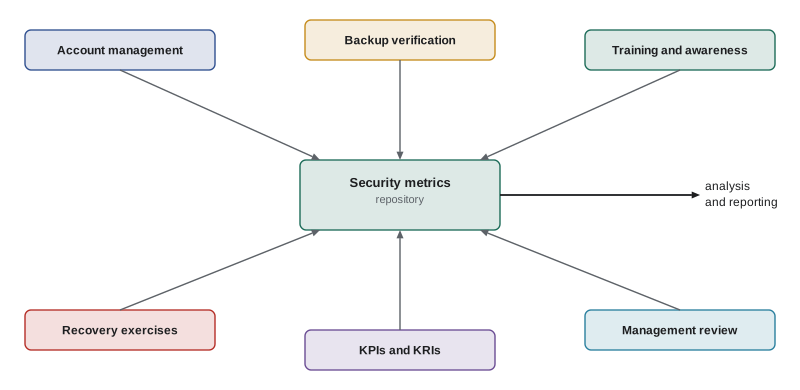
Tests and audits are snapshots. Between them, an organization needs a steady flow of data that shows whether its security processes are working day to day: whether leavers lose access on time, whether backups can actually be restored, whether staff complete training, whether recovery plans work when exercised and whether management is paying attention. Sub-domain 6.3 of the outline, collect security process data, lists exactly these sources: account management, management review and approval, key performance and risk indicators, backup verification data, training and awareness, and disaster recovery and business continuity.
This lesson treats each of these as a stream of evidence. For each, it asks what data to collect, how to make the data trustworthy, what good and bad results look like, and how the data feeds decisions. Lesson 11 then turns the data into analysis and reports for management.
Administrative and technical data
Security process data comes from two broad kinds of source. Technical data is generated by systems: account records, backup job logs, patch status, configuration scans. Administrative data comes from processes performed by people: signed access review attestations, training completion records, tabletop exercise reports, management review minutes. Both can be reliable or unreliable. System data is usually more complete and harder to alter, but it can be misconfigured or incomplete; administrative data captures judgement, but it can be filled in mechanically. Good programs collect both and cross-check one against the other.
Account management data
Account management is one of the most audited areas in security because so many incidents begin with an account that should not exist or has more access than it needs. Useful data includes the number of accounts by type (employee, contractor, service, privileged), accounts without a matching active person in the HR system, time from termination to account disablement, accounts unused for more than a set period, privileged accounts and their owners, and the results of access reviews: how many items were reviewed, how many were revoked and whether revocations were completed.
from datetime import date
# Leaver deprovisioning times for one quarter (synthetic data)
leavers = [
    ('E1021', date(2026, 7, 3),  date(2026, 7, 3)),
    ('E1077', date(2026, 7, 11), date(2026, 7, 14)),
    ('C2003', date(2026, 7, 18), date(2026, 8, 9)),
    ('E1102', date(2026, 8, 1),  date(2026, 8, 1)),
    ('E1140', date(2026, 8, 15), date(2026, 8, 17)),
    ('C2019', date(2026, 8, 29), None),
    ('E1166', date(2026, 9, 5),  date(2026, 9, 5)),
    ('E1201', date(2026, 9, 26), date(2026, 9, 29)),
]
TARGET = 1  # business-day target simplified to calendar days for illustration
on_time, late, open_ = 0, [], []
for who, left, disabled in leavers:
    if disabled is None:
        open_.append(who)
        continue
    days = (disabled - left).days
    if days <= TARGET:
        on_time += 1
    else:
        late.append((who, days))
closed = len(leavers) - len(open_)
print(f'leavers: {len(leavers)}  disabled on time: {on_time}/{closed} ({on_time / closed:.0%})')
for who, d in late:
    print(f'  late: {who} after {d} days')
print(' still active:', ', '.join(open_))leavers: 8 disabled on time: 3/7 (43%) late: E1077 after 3 days late: C2003 after 22 days late: E1140 after 2 days late: E1201 after 3 days still active: C2019
The pattern in the output is typical. Only three of seven closed cases met the one-day target, but the employee delays are two or three days, several of them across a weekend, which a business-day calculation would partly forgive. The two worst cases are contractors (the C prefix): one took 22 days and the other still has an active account. A process metric like this does two jobs: it measures the control, and it points at the root cause, here a contractor offboarding path that is not connected to the identity system, as lesson 6 described.
Management review and approval
Many controls depend on someone with authority reviewing and approving: a manager approving access, a change advisory board approving changes, an executive accepting a risk, management reviewing the ISMS as ISO/IEC 27001 clause 9.3 requires. Data on these approvals shows whether governance is real. Useful measures include the percentage of changes with recorded approval before implementation, risk acceptances that are past their expiry date, policy documents past their review date, and whether management review meetings occurred with the required inputs and produced decisions and actions.
Approval data has a known weakness: rubber-stamping. A manager who approves 300 access requests in four minutes is generating data, not control. Signals of rubber-stamping include very short approval times, approval rates near 100 % across large volumes and approvals by people who lack the knowledge to judge. These signals are themselves useful process data.
Key performance and key risk indicators
A key performance indicator (KPI) measures how well a process or control is performing against a target: the percentage of critical vulnerabilities fixed within the service-level time, the percentage of staff who completed training. A key risk indicator (KRI) is a forward-looking signal that risk is increasing: the number of internet-facing systems with known exploited vulnerabilities, the number of privileged accounts without multifactor authentication, the backlog of overdue access reviews. KPIs tell you whether the security program is doing its work; KRIs warn you that exposure is growing even if the program looks busy.
| Area | Example KPI (performance) | Example KRI (risk) |
|---|---|---|
| Vulnerability management | % of critical findings remediated within SLA | Count of internet-facing assets with known exploited vulnerabilities |
| Identity | % of leavers disabled within one business day | Privileged accounts without phishing-resistant MFA |
| Backup and recovery | % of scheduled restore tests completed and passed | Critical systems with no successful restore test in 12 months |
| Awareness | % of staff completing annual training | Trend in reported phishing versus simulated click rate |
| Third parties | % of critical vendors assessed this year | Critical vendors with expired or qualified assurance reports |
| Logging | % of critical systems sending logs centrally | Critical systems with logging gaps over 24 hours |
Good indicators share a few properties, often summarized as SMART: specific, measurable, actionable, relevant and timely. Each should have an owner, a data source, a calculation method, a target or threshold and a reporting frequency, recorded in a metric definition so that the number means the same thing every quarter. An indicator that nobody would act on, whatever its value, should be dropped.
Backup verification data
A backup that cannot be restored is not a backup. Backup job logs show that jobs ran and how much data they copied, but only a restore test proves that data can be recovered, completely, within the time the business needs. Backup verification data therefore includes job success rates, coverage (are all in-scope systems backed up?), the age of the most recent successful backup for each critical system, the results of restore tests and the measured restore time compared with the recovery time objective (RTO). For ransomware resilience, it also includes whether at least one copy is offline or immutable and whether restores have been tested from that copy.
# Restore test results against recovery objectives (illustrative data)
tests = [
    # system, RTO hours, measured restore hours, data verified
    ('Payroll database',    4,  3.2, True),
    ('Customer portal',     8,  6.5, True),
    ('File shares',        24, 31.0, True),
    ('ERP system',         12,  9.8, False),
    ('Email archive',      48, 20.0, True),
]
for name, rto, took, ok in tests:
    if not ok:
        verdict = 'FAIL: data incomplete'
    elif took > rto:
        verdict = f'FAIL: {took - rto:.1f} h over RTO'
    else:
        verdict = 'pass'
    print(f'{name:18s} RTO {rto:>2} h  restored in {took:>4.1f} h  {verdict}')
passed = sum(1 for _, rto, took, ok in tests if ok and took <= rto)
print(f'{passed} of {len(tests)} restore tests met their objectives')Payroll database RTO 4 h restored in 3.2 h pass Customer portal RTO 8 h restored in 6.5 h pass File shares RTO 24 h restored in 31.0 h FAIL: 7.0 h over RTO ERP system RTO 12 h restored in 9.8 h FAIL: data incomplete Email archive RTO 48 h restored in 20.0 h pass 3 of 5 restore tests met their objectives
Two of the five tests fail for different reasons. The file shares restored completely but too slowly, which is an architecture or capacity problem. The ERP system restored within its RTO, but verification found data missing, which may mean that a database was backed up in an inconsistent state. Both are exactly the kind of result a backup job log would never reveal.
Training and awareness data
Training completion rates are the most common awareness metric and the least informative on their own: a high completion rate shows that people clicked through a course, not that their behaviour changed. More useful measures combine completion with knowledge checks, role-based training for high-risk groups such as administrators, developers and finance staff, and behavioural data. Phishing simulation programs produce click rates and, more importantly, reporting rates: the share of staff who report a suspicious message. A rising reporting rate is a sign of a healthy culture, and the time from the first report to the security team acting is a measure of how quickly the organization can respond to a real campaign.
Phishing simulations raise ethical and employee relations questions. Simulations should support learning rather than punish, avoid themes that cause real distress (such as fake bonus or layoff messages), be approved under a documented policy and respect privacy and labour obligations. Results are best reported in aggregate, with individual follow-up handled as coaching.
In Canada, collecting and using employee data for security metrics engages privacy law: PIPEDA for federally regulated employers, provincial private-sector laws in Quebec, Alberta and British Columbia, and public-sector privacy laws for government employers. Quebec's Law 25 requires privacy impact assessments in many cases and transparency about technologies that profile individuals. Unionized workplaces may also need to consider collective agreements before introducing monitoring or simulation programs.
Disaster recovery and business continuity data
Recovery plans are tested through exercises of increasing realism: a checklist review confirms the plan is current; a tabletop exercise walks key people through a scenario in discussion; a simulation or functional test exercises specific capabilities, such as failing over a system; a parallel test brings up recovery systems alongside production; and a full interruption test actually moves operations to the recovery site. Each exercise should produce data: whether recovery time and recovery point objectives (RTO and RPO) were met, which steps failed, which contacts were out of date and which dependencies were missing, along with an action plan.
| Exercise type | Realism | Disruption risk | Typical data produced |
|---|---|---|---|
| Checklist review | Low | None | Outdated contacts, missing procedures |
| Tabletop exercise | Low to moderate | None | Decision gaps, unclear roles, communication issues |
| Simulation or functional test | Moderate | Low | Whether specific capabilities work and how long they take |
| Parallel test | High | Low to moderate | Recovery times and data integrity with production unaffected |
| Full interruption test | Highest | High | True end-to-end recovery capability |
Worked problem
From exercise to evidence
A tabletop exercise on a ransomware scenario reveals that nobody knows who can authorize shutting down the e-commerce site, that the crisis contact list is a year old, and that the plan assumes backups that are only kept online. What data and actions should come out of it?
Show solution
- Record each issue as a finding with an owner and due date in the exercise report.
- Decision authority gap: update the plan to name who can authorize shutdown, with alternates.
- Contact list: refresh it and add a quarterly verification step, measured as a process metric.
- Online-only backups: raise a high-risk finding and a project for immutable or offline copies, and schedule a restore test from that copy.
- Track completion of the actions and report them to the risk committee.
Answer: Each gap becomes an owned, dated action with a measurable follow-up, and the backup gap is escalated as a significant risk.
Making process data trustworthy
Data collection has its own controls. Sources should be documented and, where possible, system-generated. Definitions should be stable, so that a change in calculation is not mistaken for a change in performance. Collection should be automated where it can be, to reduce effort and manual error. Data owners should not be able to adjust their own figures without review. Periodic validation, such as an internal auditor re-performing a sample of metric calculations, gives management confidence that the dashboard reflects reality.
Worked problem
A metric that looks too good
The patching team reports that 99 % of servers are fully patched. A separate vulnerability scan finds missing critical patches on 15 % of servers. What should the security manager investigate?
Show solution
- Compare definitions: the patch tool may count only servers it manages and only patches it has approved, while the scanner sees all servers and all published patches.
- Check coverage: servers outside the patch tool's management do not appear in its denominator.
- Agree a single definition and data source, such as scanner-verified patch status across the full asset inventory.
- Report both the corrected figure and the coverage gap.
Answer: The difference likely comes from definitions and coverage; agree a verified source and definition and report the coverage gap.
Common mistakes
MistakeTreating backup job success as proof of recoverability.
InsteadRun restore tests and compare results with RTO, RPO and data integrity.
MistakeReporting training completion alone as awareness success.
InsteadCombine completion with knowledge checks, role-based training and reporting rates.
MistakeMeasuring only KPIs.
InsteadAdd KRIs that warn of growing exposure.
MistakeAccepting approval data without checking for rubber-stamping.
InsteadLook at approval times, approval rates and approver competence.
MistakeLetting metric definitions drift.
InsteadRecord definitions, sources and calculation methods, and keep them stable.
MistakeUsing phishing simulations to punish individuals.
InsteadUse them for learning, report in aggregate and follow privacy and labour obligations.
Summary and key terms
- Security process data shows between tests and audits whether processes work day to day.
- Sources include account management, management review, KPIs and KRIs, backups, training and recovery exercises.
- Technical and administrative data should be collected together and cross-checked.
- KPIs measure performance against targets; KRIs signal increasing risk.
- Only restore tests prove recoverability; compare them with RTO, RPO and data integrity.
- Awareness metrics should include behaviour, such as phishing reporting rates, not just completion.
- Recovery exercises range from checklists to full interruption tests, each producing measured results and actions.
- Security process data
- Data showing how security processes perform day to day.
- Key performance indicator
- A measure of how well a process or control performs against a target.
- Key risk indicator
- A forward-looking measure that signals increasing risk exposure.
- Recovery time objective
- The maximum acceptable time to restore a system or process after disruption.
- Recovery point objective
- The maximum acceptable amount of data loss, measured in time.
- Restore test
- An exercise that recovers data from backup and verifies it is complete and usable.
- Tabletop exercise
- A discussion-based walkthrough of a scenario with key decision makers.
- Rubber-stamping
- Approving requests without meaningful review.
- Reporting rate
- The share of recipients who report a suspicious or simulated phishing message.
- Metric definition
- A record of a metric's owner, source, calculation, target and frequency.
Practice problems
Work each problem on paper first, then reveal the answer to check.
Name four sources of security process data listed in the outline.
Show answer
Any four of account management, management review and approval, KPIs and KRIs, backup verification, training and awareness, disaster recovery and business continuity.
What is the difference between a KPI and a KRI?
Show answer
A KPI measures performance against a target; a KRI signals growing risk.
Why are backup job logs insufficient evidence of recoverability?
Show answer
They show copying happened, not that data can be restored completely within the RTO.
What signals suggest rubber-stamped approvals?
Show answer
Very short approval times, near-100 % approval rates over large volumes and approvers lacking knowledge.
Why is phishing reporting rate a useful metric?
Show answer
It reflects positive behaviour and how quickly the organization can respond to a real campaign.
List the recovery exercise types from least to most realistic.
Show answer
Checklist review, tabletop, simulation or functional test, parallel test, full interruption test.
What should a metric definition contain?
Show answer
Owner, data source, calculation method, target or threshold and reporting frequency.
Why cross-check administrative and technical data?
Show answer
Each can be wrong in different ways; comparing them reveals errors and gaps.
What does ISO/IEC 27001 clause 9.3 require?
Show answer
Management review of the ISMS.
What ethical safeguards apply to phishing simulations?
Show answer
A documented policy, learning rather than punishment, avoiding distressing themes, aggregate reporting and respect for privacy and labour obligations.
Lesson quiz · 5 questions
Score 60% or more to complete this lesson.
Create a free account to save your progress, take quizzes and earn a certificate.