
BIOL-499 · Lesson 8 of 12 · 19 min
Data management and reproducible analysis
▶ Video coming soon A video version of this lesson is on the way.
By the end of her field and lab work, Priya had a lot of data: 720 recorder nights scored for calling, 96 visits' worth of turbidity readings, 480 dip-net sweeps, 80 eDNA samples with three to six qPCR results each, water temperature logs, wetland outlines and her field notebook. Spread across data sheets, spreadsheets, instrument exports and audio files, these data were worth little until they were organized, checked and documented. Data management is the set of practices that keep research data findable, understandable, correct and safe, from the moment they are collected until long after the thesis is submitted.
Good data management is also what makes analysis reproducible: anyone, including you six months later, should be able to start from the raw data and obtain exactly the same results. This lesson describes how Priya organized her project so that every number in her thesis could be traced back to the original records.
The data management plan
A data management plan (DMP) describes what data a project will produce, how they will be organized, documented, stored and backed up, who can access them, and how they will be shared and preserved. In Canada, the Tri-Agency Research Data Management Policy requires data management plans for some funding programs and encourages them for all research, and the Digital Research Alliance of Canada provides a free online tool, DMP Assistant, for writing them. Priya's DMP was two pages, written in March 2025 as an appendix to her proposal, and it followed the station's existing plan.
Organizing files
Priya used one project folder with a fixed structure, the same one Dr. Okafor's lab used for every project. Raw data went into a raw folder and were never edited after entry; any correction was made by a script that produced a new, cleaned file. Scripts lived in their own folder, numbered in the order they should be run. Outputs, such as figures and tables, were generated by the scripts and could be deleted and regenerated at any time.
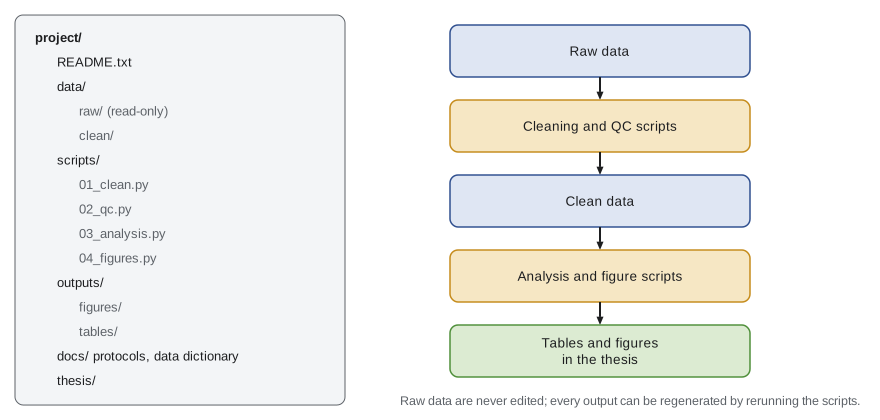
File names followed a convention: dates written year-month-day so that files sort in time order, no spaces, and a consistent order of elements. A turbidity file from 14 May 2025 was named 2025-05-14_turbidity_visit2.csv. Audio files from the recorders were renamed from the manufacturer's default numbers to names containing the wetland code and the date and time, for example G07_2025-05-02_2130.wav, using a short script so that no files were renamed by hand. Consistent names may seem trivial, but they are what allow scripts to process hundreds of files and what allow a reader to find a file years later.
Tidy data
Most analysis software works best with tidy data: each variable is a column, each observation is a row, and each type of observational unit is a table. Field data sheets are often not tidy; for example, Priya's dip-net sheet had one row per wetland visit and ten columns, one per sweep. For analysis, she reshaped it into long format, with one row per sweep and columns for wetland, visit, sweep number and count.
# Reshaping a wide field sheet into tidy (long) format, then summarizing by wetland.
import pandas as pd
wide = pd.DataFrame({
    "wetland": ["F03", "G03"], "visit": [1, 1],
    "s1": [2, 1], "s2": [0, 3], "s3": [1, 0], "s4": [3, 1], "s5": [1, 2],
})
tidy = wide.melt(id_vars=["wetland", "visit"], var_name="sweep", value_name="tadpoles")
tidy["sweep"] = tidy["sweep"].str[1:].astype(int)
print(tidy.sort_values(["wetland", "sweep"]).head(6).to_string(index=False))
print(tidy.groupby("wetland")["tadpoles"].agg(["count", "sum", "mean"]))wetland visit sweep tadpoles
F03 1 1 2
F03 1 2 0
F03 1 3 1
F03 1 4 3
F03 1 5 1
G03 1 1 1
count sum mean
wetland
F03 5 7 1.4
G03 5 7 1.4Tidy data make it easy to compute summaries for any level of the design: per sweep, per visit, per wetland or per pair. They also make the experimental unit explicit. When Priya analysed the fencing effect, she first averaged the sweeps for each wetland and visit, then averaged the two visits, so that each wetland contributed one value to the comparison, respecting the design described in lesson 5.
The data dictionary and metadata
Data without documentation are often unusable even by the person who collected them. A data dictionary describes every variable in every file: its name, a plain-language description, units, allowed values, the code for missing values and how it was measured. Metadata describe the data set as a whole: who collected it, where and when, with what methods, funding and permissions, and how it may be used.
| Variable | Description | Units or values | Missing code |
|---|---|---|---|
| wetland | Wetland code: F for fenced, G for grazed, then pair number | F01 to F12, G01 to G12 | none |
| date | Sampling date | YYYY-MM-DD | none |
| turb_ntu | Mean of three turbidity readings at the margin | Nephelometric turbidity units (NTU), 0 or more | NA |
| call_index | Chorus calling index from a two-minute segment 30 minutes after sunset | 0, 1, 2 or 3 | NA (recorder failure) |
| tadpoles | Chorus frog tadpoles counted in one standardized sweep | Count, 0 or more | NA |
| ipc_delay | Internal positive control Cq minus mean Cq in no-template controls | Cycles | NA |
Every project folder also had a README file, a short plain-text document explaining what the project is, how the folders are organized, how to run the scripts and whom to contact. Priya's README was the first thing her second reader opened when he checked her analysis.
Scripts, not clicks
Analyses done by pointing and clicking in a spreadsheet or statistics program leave no record of the exact steps, so they cannot easily be checked or repeated. Analyses written as scripts, in a language such as R or Python, are a complete record: anyone can read exactly what was done and rerun it. Priya wrote her analysis in Python, with each script doing one job: cleaning, quality control, analysis and figures. Her scripts started from the raw files every time, so when she found and corrected a data entry error in November, she corrected it in the cleaning script and reran everything, and every table and figure updated automatically.
Quality control checks are easy to write as code, and running them every time the data change means errors cannot creep back in.
# Automated quality control checks on a turbidity and calling file.
import pandas as pd
df = pd.DataFrame({
    "wetland": ["F01", "G01", "F02", "G02", "F03", "G03"],
    "turb_ntu": [19.4, 17.1, 20.2, -3.0, 9.1, 31.8],
    "call_index": [2, 3, 1, 2, 4, 0],
    "dry": [False, False, False, False, False, True],
    "tadpoles": [3.1, 2.4, 1.2, 1.0, 0.8, 0.6],
})
problems = []
problems += [f"{w}: negative turbidity" for w in df.loc[df.turb_ntu < 0, "wetland"]]
problems += [f"{w}: calling index outside 0 to 3" for w in df.loc[~df.call_index.between(0, 3), "wetland"]]
problems += [f"{w}: tadpoles recorded at a dry wetland" for w in df.loc[df.dry & (df.tadpoles > 0), "wetland"]]
print(len(problems), "problems found")
for p in problems:
print(" -", p)3 problems found - G02: negative turbidity - F03: calling index outside 0 to 3 - G03: tadpoles recorded at a dry wetland
Each problem the checks find is resolved by going back to the original data sheet or notebook, never by guessing. Corrections are made in the cleaning script with a comment explaining the source, for example: G02 turbidity entered as minus 3.0, sheet shows 3.0; minus sign was a transcription error.
Version control and backups
Version control software, most commonly Git, records every change to a set of files, with the date, the author and a message explaining the change, and allows any earlier version to be recovered. Many researchers keep their scripts and documentation in a Git repository, often hosted on a service such as GitHub or GitLab, sometimes kept private until publication. Priya's lab used a private repository for each project. Large raw data files, such as audio, are usually kept outside Git, on institutional storage.
Backups follow the 3-2-1 rule: at least three copies of the data, on at least two kinds of storage, with at least one copy off site. Priya's raw data were on the university's backed-up research storage, on an external drive kept at the station and in the station's cloud archive. Laptops are lost, drives fail and coffee is spilled; data that exist in one place are not safe. Her field sheets, photographed each evening, were a fourth copy of the most irreplaceable data.
Sharing and preserving data
The FAIR principles state that research data should be findable, accessible, interoperable and reusable. In practice, this means depositing data in a recognized repository with a persistent identifier, such as a DOI, rich metadata, open formats such as CSV rather than proprietary ones, and a clear licence. Canadian researchers often use Borealis, the Canadian Dataverse repository, or the Federated Research Data Repository, as well as international and subject repositories. Common licences for data include CC0, which waives all rights, and CC BY, which requires attribution.
Not all data should be fully open. Precise locations of rare species can attract collectors or disturbance, data about private land may be restricted by agreements, and data about Indigenous communities may be governed by principles such as OCAP or CARE, introduced in lesson 6. Priya's deposited data gave wetland locations only to the nearest 10 kilometres and noted that precise coordinates were available from the station on request, consistent with the station's agreement with the ranch. Her two northern leopard frog records were reported to the provincial or state conservation data centre rather than published with coordinates.
Recording software and versions
Results can change when software changes. A new version of a statistics package may use a different default method, a random number generator may produce different streams, or a function may be renamed. Priya recorded the version of Python and of each package she used in a plain-text requirements file in the scripts folder, set a random seed at the top of every script that used random numbers, and reported the versions in her methods section. Some labs go further and package the whole computing environment, for example in a container, so that an analysis can be rerun years later exactly as it was. For an honours project, a list of versions and fixed seeds is usually enough, and it costs only a few minutes.
She also kept a short changelog at the top of the README: one line per significant change to the data or scripts, with the date. When Dr. Szabo asked in March why a figure in her draft differed slightly from the version she had shown him in December, the changelog showed that she had corrected two dip-net counts in January, and he could see exactly what had changed and why.
Worked problem
Applying the 3-2-1 rule
Tomás keeps his Daphnia data in a spreadsheet on his laptop and copies it weekly to a USB stick that he keeps in the same backpack. Does this meet the 3-2-1 rule, and what should he change?
Show solution
- Count copies: the laptop and the USB stick give two copies, not three.
- Count storage types: a laptop drive and a USB stick are two kinds, which meets that part.
- Off-site copy: both are in the same backpack, so one theft or accident loses everything.
- A fix is to keep the working copy on the university's backed-up network storage or institutional cloud, keep the laptop copy, and store the USB stick at home, updating all three regularly.
Answer: His plan fails the rule: only two copies, both in one place. Adding institutional storage and keeping the USB copy at home gives three copies, on two or more media, with one off site.
Common mistakes
MistakeIt is fine to correct errors directly in the raw data file.
InsteadKeep raw data unchanged; make corrections in a script with a note of the source, so the record is preserved.
MistakeDocumentation can be written at the end of the project.
InsteadWrite the data dictionary and README as data are collected, when details are fresh.
MistakeOne backup on an external drive is enough.
InsteadFollow the 3-2-1 rule: three copies, two media, one off site.
MistakeOpen data means publishing everything, including exact rare species locations.
InsteadShare data as openly as possible but as restricted as necessary, protecting sensitive locations, private land agreements and community data rights.
Summary and key terms
- Data management keeps data findable, understandable, correct and safe; a data management plan sets out how.
- Use a fixed folder structure, read-only raw data, consistent file names and outputs generated by scripts.
- Tidy data have one variable per column and one observation per row, making the design's levels explicit.
- Data dictionaries, metadata and README files make data usable by others and by you later.
- Scripted analyses and automated quality checks are reproducible; version control and the 3-2-1 backup rule protect work.
- Share data in repositories following FAIR principles, with appropriate protection for sensitive information.
- Data management plan
- A document describing how a project's data will be collected, organized, documented, stored, shared and preserved.
- Tidy data
- A data layout in which each variable is a column, each observation a row and each type of unit a table.
- Data dictionary
- A description of every variable in a data set, including units, allowed values and missing-value codes.
- Reproducible analysis
- An analysis that others can rerun from the raw data to obtain the same results.
- Version control
- Software that records changes to files over time so that any earlier version can be recovered.
- FAIR principles
- Guidelines that data should be findable, accessible, interoperable and reusable.
Practice problems
Work each problem on paper first, then reveal the answer to check.
Write a file name for chorus frog calling scores from wetland G04 recorded on 9 May 2025.
Show answer
For example: G04_2025-05-09_calling.csv, with the date in year-month-day order and no spaces.
A sheet has columns wetland, visit and sweep1 to sweep10. How many rows will a tidy table have for 24 wetlands and 2 visits?
Show answer
24 times 2 times 10, which is 480 rows, one per sweep.
Why should raw data never be edited directly?
Show answer
So the original record is preserved and every correction is documented and repeatable.
Give two reasons to restrict some data from open sharing.
Show answer
Protecting rare species locations, respecting private land agreements, protecting personal information or respecting Indigenous data governance.
Lesson quiz · 5 questions
Score 60% or more to complete this lesson.
Create a free account to save your progress, take quizzes and earn a certificate.