
BIOL-460 · Lesson 4 of 12 · 18 min
Nutrients, primary production and trophic state
▶ Video coming soon A video version of this lesson is on the way.
Kestrel Lake and Mallard Lake are a few kilometres apart and share the same climate, yet one is clear and the other green. The class's water chemistry gives the reason in two numbers: total phosphorus in Kestrel Lake averages about 6 micrograms per litre, and in Mallard Lake about 58. This lesson is about why phosphorus, and sometimes nitrogen, controls how productive a lake is, how that productivity is measured, and how limnologists classify and predict the trophic state of lakes. It is the scientific core of the water quality management in Lessons 11 and 12.
Which nutrient limits growth?
Algae and aquatic plants need many elements, but most are plentiful relative to need. Carbon, hydrogen and oxygen come from water and dissolved carbon dioxide. The elements most often in short supply are nitrogen and phosphorus, and sometimes silicon for diatoms, iron or trace metals. Liebig's law of the minimum, which BIOL-208 introduced, says growth is controlled by the resource in shortest supply relative to need. For algae, a useful yardstick is the Redfield ratio: phytoplankton contain carbon, nitrogen and phosphorus in roughly the atomic proportions 106 to 16 to 1. Water with much more than 16 atoms of available nitrogen per atom of phosphorus tends to be phosphorus-limited; water with much less tends to be nitrogen-limited.
In most north temperate lakes, phosphorus is the nutrient that limits algae over the long term. The decisive evidence came from whole-lake experiments at the Experimental Lakes Area in northwestern Ontario. From 1969, Lake 227 was fertilized with phosphorus and nitrogen and turned green with algae within weeks. In 1973 Lake 226 was divided into two basins by a plastic curtain. One basin received carbon, nitrogen and phosphorus, the other only carbon and nitrogen. The basin with phosphorus developed dense blooms of blue-green algae; the other did not. An aerial photograph of the two halves, one green and one clear, became one of the most famous images in ecology and helped persuade governments to limit phosphorus in detergents and sewage.
Why phosphorus rather than nitrogen? Nitrogen gas is abundant in the air, and some cyanobacteria, the blue-green algae, can fix it into ammonium using specialized cells called heterocysts, so a nitrogen shortage can be made up over time by nitrogen fixers. There is no gaseous source of phosphorus; it comes from weathering rock, soils, wastes and sediments. When Lake 227's nitrogen additions were later stopped while phosphorus continued, nitrogen-fixing cyanobacteria took over and the lake stayed productive. Experiments and syntheses since then have shown that nitrogen limitation, or co-limitation by both nutrients, is common for short periods and in some lakes, especially very productive ones, so many managers now consider both nutrients, but phosphorus control remains the cornerstone of lake protection.
Phosphorus is measured in several forms. Total phosphorus includes dissolved and particulate forms, including phosphorus inside algae, and is the best single predictor of a lake's productivity. Soluble reactive phosphorus is mainly dissolved orthophosphate, the form algae take up directly; in summer it is often near the limit of detection because algae remove it as fast as it appears. Nitrogen is measured as nitrate, ammonium and total nitrogen.
Where nutrients come from
Nutrient sources are usually divided into point sources, which enter at an identifiable pipe, such as sewage treatment plants and industrial outfalls, and nonpoint sources, which come diffusely from the landscape, such as runoff from fields, pastures, lawns and streets, septic systems and atmospheric deposition. Point sources were the main problem in the mid-twentieth century and have been greatly reduced by sewage treatment and detergent rules. Nonpoint sources are now the larger problem in most watersheds, and they are harder to control because they come from thousands of properties and are driven by storms.
Lake Erie shows both phases. By the 1960s it was famous as the dead lake, with algal mats on beaches and an anoxic central basin. Canada limited phosphorus in laundry detergents under the Canada Water Act in the early 1970s, and the Great Lakes Water Quality Agreement of 1972 between Canada and the United States set phosphorus targets and funded sewage treatment upgrades. Loads fell by more than half and the lake recovered through the 1980s. From the early 2000s, however, blooms returned to the western basin. The main driver is dissolved phosphorus washing from farm fields in the Maumee River and other tributaries during spring storms, with help from warmer water and invasive mussels that change how nutrients cycle. In 2016, under the 2012 version of the agreement, the two countries adopted new targets: cut the total phosphorus entering the western and central basins by two fifths from 2008 levels, which means an annual load of about 6,000 tonnes to the central basin, with matching cuts in spring loads from the Maumee River and other priority tributaries.
Nutrients also change through the seasons. At spring turnover, phosphorus, nitrate and silica that accumulated over winter are mixed through the whole lake, and the first algal growth of the year, often dominated by diatoms, draws them down. Diatoms build their cell walls from silica, so as silica is used up they give way to green algae and, later in summer, to cyanobacteria, which tolerate low nitrogen and warm, calm water. Through the summer the epilimnion is resupplied mainly by inflows, rain, the excretion of zooplankton and fish, and occasional mixing events, while nutrients accumulate in the hypolimnion until fall turnover brings them back up. Lena Fournier's samples from Kestrel Lake show this cycle clearly: soluble silica falls by more than half between ice-out and late June, just as the spring diatom peak collapses.
Primary production
Primary production is the rate at which autotrophs fix carbon. Gross primary production is the total fixed by photosynthesis; net primary production is what remains after the autotrophs' own respiration, and it is the energy available to the rest of the food web. In lakes, production is shared among phytoplankton, attached algae called periphyton, and rooted and floating plants called macrophytes; in deep lakes phytoplankton dominate, while in shallow lakes and wetlands macrophytes and periphyton can contribute most.
Limnologists measure phytoplankton production in three main ways. The light-and-dark bottle method suspends paired bottles of lake water at several depths: oxygen rises in the clear bottle from net photosynthesis and falls in the dark bottle from respiration, and the difference gives gross production. The carbon-14 method adds a radioactive tracer of bicarbonate and measures how much the algae take up in a few hours; it is very sensitive and was the standard for decades. Today many lakes are studied by the free-water method, which uses the daily rise and fall of oxygen recorded by sensors on a buoy to estimate whole-lake gross production, respiration and net ecosystem production. Phytoplankton biomass is usually estimated from the concentration of chlorophyll a, the main photosynthetic pigment.
Photosynthesis responds to light in a characteristic curve. At low light, production rises almost linearly with light; at higher light it saturates; and at very high light, near the surface on bright days, it may decline through photoinhibition. Integrated over the euphotic zone, production per square metre depends on light, nutrients and temperature, and on how deep the algae are mixed.
Trophic state
The word trophic refers to nourishment, and trophic state describes how productive a lake is. Lakes are classed as oligotrophic, with few nutrients, low algal biomass, clear water and oxygenated depths; mesotrophic, intermediate; eutrophic, with abundant nutrients, high algal biomass, low clarity and oxygen-depleted depths; and hypereutrophic, extremely productive and prone to dense blooms. Brown-water lakes stained by humic substances are sometimes called dystrophic. Commonly used boundaries for total phosphorus are below about 10 micrograms per litre for oligotrophic lakes, about 10 to 20 or 30 for mesotrophic, up to about 100 for eutrophic and above that for hypereutrophic, though agencies use somewhat different cut-offs.
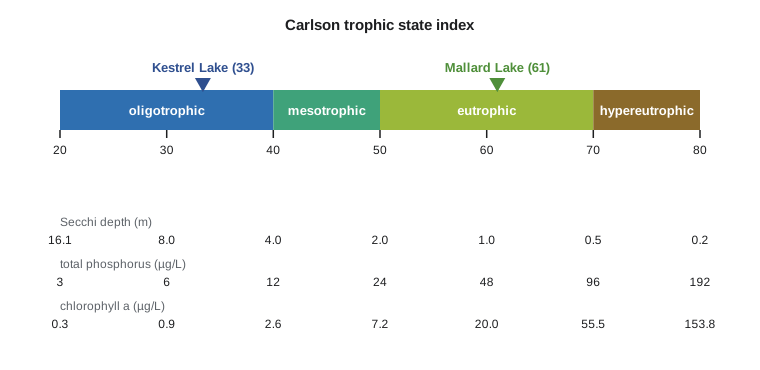
Because the categories have fuzzy edges, the American limnologist Robert Carlson proposed in 1977 a continuous trophic state index. It converts Secchi depth, total phosphorus and chlorophyll a onto a common scale from about 0 to 100, on which each increase of 10 units corresponds to a halving of Secchi depth. The three versions are
with Secchi depth in metres and total phosphorus and chlorophyll in micrograms per litre. Values below about 40 are oligotrophic, 40 to 50 mesotrophic, 50 to 70 eutrophic and above 70 hypereutrophic. When the three indices disagree, the pattern is itself informative: a Secchi index much higher than the chlorophyll index, for example, suggests that something other than algae, such as clay or brown colour, is reducing clarity.
import math
def tsi_sd(sd):   return 60 - 14.41 * math.log(sd)
def tsi_tp(tp):   return 14.42 * math.log(tp) + 4.15
def tsi_chl(chl): return 9.81 * math.log(chl) + 30.6
def label(t):
    return 'oligotrophic' if t < 40 else 'mesotrophic' if t < 50 else 'eutrophic' if t < 70 else 'hypereutrophic'
# Summer means (synthetic): Secchi (m), total phosphorus and chlorophyll a (micrograms per L)
for name, sd, tp, chl in (('Kestrel', 6.2, 6, 1.8), ('Mallard', 1.1, 58, 24)):
    t = [tsi_sd(sd), tsi_tp(tp), tsi_chl(chl)]
print(f"{name:8s} TSI(SD) {t[0]:4.1f} TSI(TP) {t[1]:4.1f} TSI(CHL) {t[2]:4.1f} mean {sum(t)/3:4.1f} -> {label(sum(t)/3)}")Kestrel TSI(SD) 33.7 TSI(TP) 30.0 TSI(CHL) 36.4 mean 33.4 -> oligotrophic Mallard TSI(SD) 58.6 TSI(TP) 62.7 TSI(CHL) 61.8 mean 61.0 -> eutrophic
Predicting algae from phosphorus
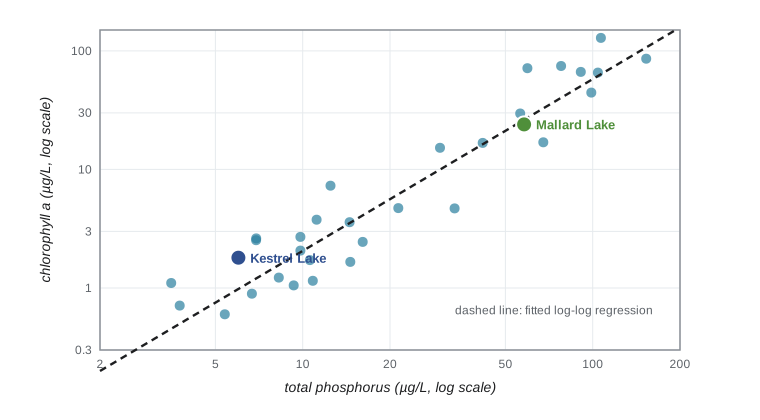
Across many lakes, summer chlorophyll rises with total phosphorus. In 1974 Peter Dillon and Frank Rigler fitted a now-classic regression for lakes in Ontario and elsewhere, relating mean summer chlorophyll to spring total phosphorus on logarithmic scales. Its general form is a straight line on a log-log graph with a slope a little above 1, meaning that chlorophyll rises somewhat faster than phosphorus. Such relationships have wide scatter, because grazing, light, flushing and the kinds of algae all modify the response, but they let managers estimate how clear a lake would become if its phosphorus fell.
The next step is to predict a lake's phosphorus from its inputs. The Swiss limnologist Richard Vollenweider developed a family of mass-balance models in the 1960s and 1970s that became the basis of the international eutrophication studies of the Organisation for Economic Co-operation and Development. One widely used version estimates the average lake concentration from the areal phosphorus load, the hydraulic load and the water residence time:
where \(L\) is the annual phosphorus load per square metre of lake surface, \(q_s\) is the areal hydraulic load (mean depth divided by residence time, in metres per year) and \(\tau_w\) is the residence time in years. The denominator accounts for phosphorus lost to the sediments, which is greater in lakes that hold their water longer.
Worked problem
How much must Mallard Lake's load fall?
Mallard Lake (synthetic data) has a mean depth of 3.2 metres and a residence time of 0.36 years. Its external phosphorus load is about 0.21 grams per square metre per year. Predict its phosphorus concentration, and find the load that would bring it to 25 micrograms per litre.
Show solution
- The areal hydraulic load is \(q_s = 3.2 / 0.36 \approx 8.9\) metres per year, and \(\sqrt{0.36} = 0.6\).
- \[P = \frac{0.21 / 8.9}{1.6}\ \text{g m}^{-3} \approx 0.0148\ \text{g m}^{-3} \approx 15\ \mu\text{g L}^{-1}\]
- The prediction, about 15 micrograms per litre, is well below the measured 58. The gap is a strong sign that much of Mallard Lake's phosphorus comes from internal loading by its sediments, which the model does not include.
- For the external load alone, \(L = 25 \times 10^{-3} \times 8.9 \times 1.6 \approx 0.36\) grams per square metre per year would give 25 micrograms per litre, so external load is not the only problem; the sediments must be managed too.
Answer: The model predicts about 15 micrograms per litre from external loading; the measured value of 58 points to large internal loading.
That mismatch is exactly the kind of finding that changes a management plan. The class will return to Mallard Lake's sediments and the options for treating them in Lessons 11 and 12.
Common mistakes
MistakeNitrogen never matters in lakes because phosphorus is always limiting.
InsteadPhosphorus usually limits over the long term, but nitrogen limitation and co-limitation are common in some lakes and seasons.
MistakeLow soluble reactive phosphorus means a lake has little phosphorus.
InsteadIn summer algae strip dissolved phosphate quickly; total phosphorus is a better measure of what the lake holds.
MistakeA trophic state index value is a measurement.
InsteadIt is a scale for comparing lakes, calculated from measurements; disagreement between its versions is diagnostic.
Summary and key terms
- Phosphorus usually limits algae in north temperate lakes, as the Experimental Lakes Area experiments showed.
- Nitrogen-fixing cyanobacteria can make up nitrogen shortages but not phosphorus shortages.
- Point sources have been largely controlled; nonpoint runoff and internal loading now dominate many lakes.
- Trophic state runs from oligotrophic to hypereutrophic, and the Carlson index puts Secchi depth, phosphorus and chlorophyll on one scale.
- Mass-balance models such as Vollenweider's predict lake phosphorus from loads, depth and residence time.
- Limiting nutrient
- The nutrient whose supply most restricts growth relative to need.
- Redfield ratio
- The typical atomic ratio of carbon, nitrogen and phosphorus in phytoplankton, about 106 to 16 to 1.
- Total phosphorus
- All phosphorus in a water sample, dissolved and particulate.
- Nonpoint source
- Pollution from diffuse sources across the landscape, such as farm and urban runoff.
- Trophic state
- The productivity of a water body, from oligotrophic to hypereutrophic.
- Net primary production
- Carbon fixed by photosynthesis minus the autotrophs' own respiration.
Practice problems
Work each problem on paper first, then reveal the answer to check.
A lake has a Secchi depth of 4 metres. What is its Secchi trophic state index?
Show answer
About 40, since 60 minus 14.41 times the natural log of 4 is about 40.
Water has 40 atoms of available nitrogen per atom of phosphorus. Which nutrient is likely to limit algae?
Show answer
Phosphorus, because the ratio is well above the Redfield value of 16.
Why does a lake with a long residence time keep more of its phosphorus load?
Show answer
Water stays longer, so more phosphorus settles to the sediments, and the lake responds slowly to changes.
Lesson quiz · 5 questions
Score 60% or more to complete this lesson.
Create a free account to save your progress, take quizzes and earn a certificate.