
BIOL-440 · Lesson 11 of 12 · 24 min
Climate change in the North
Earlier lessons kept returning to warming: deeper thaw, larger fires, shrinking sea ice, shifting insects and declining caribou. This lesson pulls those threads together. It looks at how the northern climate is changing, the permafrost carbon feedback, whether the boreal forest is moving north or browning, how disturbance regimes are shifting, how species and seasons are responding, and what the changes mean for northern people, from ice roads to wildfire smoke. The capstone lesson then applies these ideas to managing an invented boreal region.
A rapidly warming North
Lesson 8 showed that the Arctic has warmed nearly four times faster than the global average since 1979. The boreal zone has also warmed faster than the global mean, especially in winter: northwestern Canada and interior Alaska have warmed by roughly 2 to 3 °C since the mid-twentieth century, with winter warming of 4 °C or more in some records. Canada's national climate assessment, Canada's Changing Climate Report of 2019, found that the country as a whole had warmed about twice as fast as the global average and northern Canada about three times as fast. Precipitation has generally increased, but higher temperatures raise evaporation and lengthen the snow-free season, so summer drought stress has often increased. Snow cover duration has declined, lake and river ice forms later and breaks up earlier, and glaciers in the Yukon, Alaska and the Canadian Arctic Archipelago are losing mass rapidly.
The permafrost carbon feedback
Lesson 2 described the enormous carbon stored in permafrost soils, roughly 1,400 to 1,600 billion tonnes. As permafrost thaws, microbes decompose the newly thawed organic matter, releasing carbon dioxide and, in waterlogged soils, methane. This adds greenhouse gases to the atmosphere, causing more warming and more thaw, a positive feedback. Its size depends on how much permafrost thaws, how fast thawed carbon decomposes, whether the soil is wet or dry, and how much new plant growth offsets the losses. Gradual thaw deepens the active layer slowly, while abrupt thaw, through thermokarst, slumps and collapse of ice-rich ground, can expose deep carbon in years rather than decades.
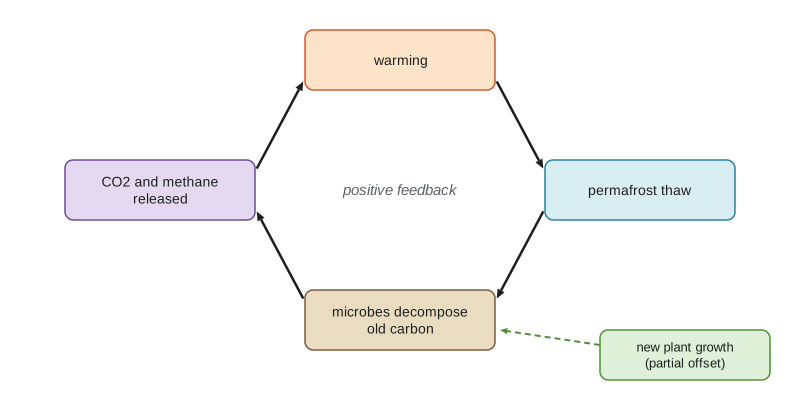
Model projections summarized by the Intergovernmental Panel on Climate Change suggest that permafrost thaw could release on the order of tens to a hundred or more billion tonnes of carbon by 2100, depending on the emissions pathway, comparable to several years of current human emissions. That is a large but not runaway feedback in most assessments: it makes the remaining carbon budget for limiting warming smaller, and it continues for centuries once started. Abrupt thaw and methane may add substantially to gradual-thaw estimates. A simple calculation shows how the pieces combine.
# A toy permafrost carbon feedback: thawed carbon decomposes and adds warming (illustrative values only).
import numpy as np
C_perm = 1400.0              # Gt C in northern permafrost soils (approximate)
years = np.arange(2025, 2101)
def run(warming_rate, frac_thaw_per_C, k_decomp, ch4_share):
    T = 1.5 + warming_rate * (years - 2025)               # Arctic-relevant warming above preindustrial, C
    thawed = np.minimum(C_perm * frac_thaw_per_C * T, C_perm)
    released = np.zeros(years.size); pool = 0.0; prev = thawed[0]
    for i in range(years.size):
        pool += thawed[i] - prev; prev = thawed[i]
        out = pool * k_decomp; pool -= out
        released[i] = (released[i - 1] if i else 0) + out
    return released[-1], released[-1] * ch4_share
for name, rate in (('lower emissions', 0.02), ('higher emissions', 0.06)):
    gtc, ch4 = run(rate, 0.04, 0.02, 0.02)
    print(f"{name:>16}: about {gtc:4.0f} Gt C released by 2100, of which about {ch4:.1f} Gt C as methane")
print(f"current fossil emissions: about 10 Gt C per year, so the higher case equals roughly {run(0.06, 0.04, 0.02, 0.02)[0] / 10:.0f} years of them")lower emissions: about 41 Gt C released by 2100, of which about 0.8 Gt C as methane higher emissions: about 124 Gt C released by 2100, of which about 2.5 Gt C as methane current fossil emissions: about 10 Gt C per year, so the higher case equals roughly 12 years of them
The numbers from this toy model, roughly 40 to 120 billion tonnes of carbon by 2100, fall within the published range. The small methane share matters more than its mass suggests, because each tonne of methane traps far more heat than a tonne of carbon dioxide over the first decades. But the model's structure is crude: a single carbon pool, a linear thaw response and no new plant growth. Real models represent soil layers, ice content, hydrology and vegetation. The essential lessons hold: the feedback grows with warming, continues long after 2100, and is one reason why reducing emissions sooner matters more than later.
Is the boreal forest moving north?
With warming, one might expect the boreal forest simply to shift north, advancing into tundra at its northern edge and giving way to temperate forest or grassland at its southern edge. The reality is more complicated and slower. At the northern edge, treeline advance is patchy: trees need seed, suitable seedbeds, protection from browsing and wind, and soils that are not too cold or wet, and many treelines have hardly moved, while others have thickened with more trees rather than advancing. Shrubs have expanded much faster than trees, as lesson 8 described.
At the southern and western edges, warming combined with drought is stressing trees. Studies of tree rings and satellite records have found declining growth, or browning, in parts of the interior boreal forest of Alaska and western Canada, where hotter summers increase moisture stress, and some models project that parts of the southern boreal forest could become too dry for closed conifer forest, shifting toward aspen parkland, grassland or open woodland, a process sometimes called boreal biome shift. In the east, where moisture is more plentiful, warming may instead increase growth for a time. Disturbance, not gradual migration, is likely to be the main agent of change: after large fires, insect outbreaks or drought die-off, a different forest, or none, may regrow, as the short-interval reburns of lesson 3 illustrate.
Canadian research networks track these changes across the boreal forest, from the long-term plots of the Canadian Forest Service and provincial growth-and-yield programs to the Boreal Ecosystem Research and Monitoring Sites and studies of aspen dieback in the Prairie provinces after the drought of 2001 and 2002, which killed or damaged aspen over large areas of Alberta and Saskatchewan. In the Northwest Territories, studies near Scotty Creek have documented the rapid conversion of permafrost peat plateaus with black spruce into treeless wetlands as permafrost thaws, a forest loss driven from below.
Changing disturbance regimes
Fire is the clearest example of a changing disturbance regime. Longer fire seasons, hotter and drier weather, and more lightning in northern latitudes have increased area burned in parts of Alaska and western Canada, and Canada's 2023 season was the largest on record. Studies project that annual area burned in the North American boreal forest could increase by 50 to 200 per cent or more by the end of the century under higher emissions. More frequent, severe fires favour deciduous trees and shrubs, consume more organic soil, release more carbon, thaw more permafrost and reduce caribou winter range. Insect regimes are also shifting, with mild winters letting species such as the mountain pine beetle and spruce beetle expand. Wind, drought and ice storms add further stress.
Species and seasons
Species are moving north and upslope. White-tailed deer, coyotes, red foxes and moose have expanded into regions where they were rare a century ago, while Arctic foxes face competition from red foxes and caribou face new parasites and predators. Southern birds such as American robins have appeared in Inuit communities that had no word for them. In the sea, Pacific and Atlantic species are moving into the Arctic: killer whales are seen more often in Hudson Bay, and capelin and sand lance are replacing Arctic cod in some seabird diets.
Phenology, the timing of seasonal events, is shifting. Snowmelt, leaf-out, flowering and insect emergence have advanced in many northern records, and migratory birds arrive earlier, but not always by the same amount, creating mismatches. Geese breeding in the Arctic may hatch their goslings after the peak in plant nutritional quality; shorebird chicks may hatch after the peak of insect abundance. Detecting such trends requires long records and careful statistics, since year-to-year variation is large.
# Trend in spring green-up date from a synthetic 40-year satellite record, with a breakpoint test.
import numpy as np
from scipy import stats
rng = np.random.default_rng(1111)
yrs = np.arange(1985, 2025)
greenup = 152 - 0.30 * (yrs - 1985) + rng.normal(0, 5, yrs.size)   # day of year
fit = stats.linregress(yrs, greenup)
print(f"trend: {10 * fit.slope:+.1f} days per decade (95% CI {10 * (fit.slope - 1.96 * fit.stderr):+.1f} to {10 * (fit.slope + 1.96 * fit.stderr):+.1f}), p = {fit.pvalue:.4f}")
print(f"total change over the record: {fit.slope * (yrs[-1] - yrs[0]):+.0f} days")
first, last = greenup[yrs < 1995].mean(), greenup[yrs >= 2015].mean()
print(f"mean green-up 1985-1994: day {first:.0f}; 2015-2024: day {last:.0f}")
short = stats.linregress(yrs[-10:], greenup[-10:])
print(f"trend over only the last 10 years: {10 * short.slope:+.1f} days per decade, p = {short.pvalue:.2f} (too short to be reliable)")trend: -2.6 days per decade (95% CI -3.8 to -1.5), p = 0.0001 total change over the record: -10 days mean green-up 1985-1994: day 153; 2015-2024: day 145 trend over only the last 10 years: -1.6 days per decade, p = 0.60 (too short to be reliable)
People and the changing North
Climate change is already reshaping northern lives. Winter roads, built on frozen lakes and muskeg to supply remote communities and mines, have shorter and less reliable seasons; the Tibbitt to Contwoyto winter road that supplies diamond mines in the Northwest Territories and the winter roads to First Nations in northern Manitoba and Ontario have opened late and closed early in warm years, raising costs and forcing more air transport. Thawing permafrost damages buildings, roads, airstrips and water systems. Coastal erosion threatens communities, and several Alaska Native villages, among them Newtok and Shishmaref, have pursued relocation. Unreliable sea ice makes hunting and travel more dangerous.
Wildfire smoke has become a major health issue, not only in the North but across the continent. Fine particulate matter from smoke aggravates asthma, heart and lung disease, and studies link smoke exposure to increased hospital visits and deaths. Evacuations disrupt communities, often Indigenous communities with limited road access, repeatedly: some First Nations have been evacuated several times in recent years. Food security is affected as caribou decline, fish move and ice becomes unsafe, while new opportunities, such as longer growing seasons for northern gardens and new fisheries, emerge unevenly.
| Change | Ecological consequence | Human consequence |
|---|---|---|
| Permafrost thaw | Thermokarst, wetland expansion, carbon release | Damaged infrastructure, changed travel routes |
| Larger, more frequent fires | Younger, more deciduous forest; caribou range loss | Evacuations, smoke exposure, timber loss |
| Sea ice loss | Habitat loss for polar bears, seals and walrus | Unsafe ice travel, coastal erosion |
| Species range shifts | New competitors, parasites and predators | Changes in harvested species |
| Earlier spring | Phenological mismatches | Changed timing of harvesting seasons |
| Shorter winter roads | Less disturbance on frozen ground in some areas | Higher costs and isolation for remote communities |
Worked problem
Is a phenology trend real?
Ama compares mean caribou calving dates, as an index of spring timing, between two 10-year periods: days 158 and 154, with standard deviations of 6 days each. Is a 4-day difference convincing? What would make the conclusion stronger?
Show solution
- Standard error of each 10-year mean = 6 / sqrt(10) = 1.9 days.
- Standard error of the difference = sqrt(1.9^2 + 1.9^2) = 2.7 days.
- The difference of 4 days is about 1.5 standard errors, so p is about 0.14, not convincing on its own.
- A regression over the full continuous record, a longer record, or corroborating trends in snowmelt and green-up would strengthen the case.
Answer: Not convincing alone (about 1.5 standard errors); a longer, continuous record and independent corroborating evidence would strengthen it.
Common mistakes
MistakeExpecting the boreal forest to shift north smoothly.
InsteadTreeline advance is slow and patchy; disturbance-driven change at the southern edge may be faster.
MistakeCalling the permafrost carbon feedback a runaway tipping point.
InsteadMost assessments find a large, long-lasting but not runaway feedback that reduces the carbon budget.
MistakeDrawing conclusions from short phenology records.
InsteadYear-to-year variation is large; decades of data are needed to detect trends reliably.
MistakeTreating northern climate impacts as only ecological.
InsteadInfrastructure, health, food security and travel safety are all affected.
MistakeAssuming more precipitation means less drought stress.
InsteadHigher temperatures and longer snow-free seasons raise evaporation, often increasing summer stress.
Summary and key terms
- The North has warmed two to four times faster than the global average, with less snow, ice and sea ice.
- Permafrost thaw releases carbon dioxide and methane in a positive feedback that grows with warming and lasts centuries.
- Treeline advance is slow and patchy; drought and disturbance may change the southern boreal forest faster.
- Fire and insect regimes are intensifying, favouring younger, more deciduous forest.
- Species are moving north, and phenology is advancing unevenly, creating mismatches.
- Northern people face shorter winter roads, damaged infrastructure, coastal erosion, smoke and food insecurity.
- permafrost carbon feedback
- Additional warming caused by greenhouse gases released from thawing permafrost.
- abrupt thaw
- Rapid thaw of ice-rich permafrost through thermokarst, slumps and collapse.
- boreal biome shift
- Projected transformation of boreal forest toward other vegetation types as climate changes.
- browning
- A decline in vegetation greenness or growth, often from drought or disturbance.
- phenology
- The timing of recurring biological events such as leaf-out and migration.
- phenological mismatch
- A loss of synchrony between a species and the resources it depends on.
- range shift
- A change in the geographic distribution of a species.
- winter road
- A seasonal road built over frozen lakes and ground to supply remote communities.
- carbon budget
- The cumulative emissions consistent with limiting warming to a given level.
- fine particulate matter
- Tiny airborne particles, such as those in smoke, that harm human health.
Practice problems
Work each problem on paper first, then reveal the answer to check.
Why is the permafrost carbon feedback called positive?
Show answer
Warming causes thaw, which releases greenhouse gases that cause more warming.
Name two factors that limit treeline advance.
Show answer
For example seed supply, seedbed conditions, browsing, wind, cold or wet soils.
What is boreal browning?
Show answer
Declining growth or greenness of boreal forest, often from heat and drought stress.
How could more fire change boreal forest composition?
Show answer
It favours deciduous trees and shrubs over black spruce, especially with short-interval reburns.
Give one example of a phenological mismatch in the Arctic.
Show answer
Goslings hatching after the peak in plant quality, or shorebird chicks after the insect peak.
Why are 10-year records poor for detecting trends?
Show answer
Year-to-year variation is large relative to the trend, so estimates are imprecise.
Name two ways climate change affects remote northern communities.
Show answer
For example shorter winter road seasons, permafrost damage, coastal erosion, smoke or unsafe ice.
What did Canada's Changing Climate Report find about warming in northern Canada?
Show answer
Northern Canada has warmed about three times as fast as the global average.
Lesson quiz · 5 questions
Score 60% or more to complete this lesson.
Create a free account to save your progress, take quizzes and earn a certificate.