
BIOL-410 · Lesson 10 of 12 · 28 min
Comparative genomics and phylogenomics
Comparing genomes is one of the most powerful ways to understand them. Sequences that are conserved across hundreds of millions of years of evolution are almost certainly functional; genes present in one lineage and absent in its relatives point to its distinctive biology; and rearrangements, duplications and transfers between species record the history of genome evolution. This lesson covers how whole genomes are aligned and compared, how orthologous genes are identified, how gene families and whole genomes duplicate, how selection is measured across species, and how hundreds of genes are combined to infer the tree of life. BIOL-321 covered distance, parsimony, likelihood and Bayesian tree building and the bootstrap; here those methods are applied at genome scale.
Aligning whole genomes
Aligning two whole genomes differs from aligning two genes. Genomes are rearranged by inversions, translocations, duplications and deletions, so a single collinear alignment does not exist. Whole-genome aligners such as MUMmer, LASTZ and minimap2 find anchors, exact or near-exact matches, chain collinear anchors into blocks, and align within the blocks. The result is often displayed as a dot plot, with one genome on each axis and a point wherever they match: a diagonal line shows a collinear block, a line running the other way shows an inversion, and off-diagonal segments show translocations or duplications.
Blocks of conserved gene order between species are called syntenic blocks (strictly, synteny means only being on the same chromosome, but the word is commonly used for conserved order, also called collinearity). Human and mouse genomes, separated by about 80 to 90 million years, can be divided into a few hundred syntenic blocks, reflecting a few hundred rearrangements since their common ancestor. Gene order decays faster in some lineages than others; it is remarkably conserved among birds and highly scrambled among some insects. In bacteria, inversions are often symmetric around the origin of replication, producing a characteristic X-shaped dot plot.
# Find syntenic blocks between two invented genomes, the second carrying an inversion and a translocation.
import random
random.seed(10)
rand = lambda n: ''.join(random.choice('ACGT') for _ in range(n))
comp = str.maketrans('ACGT', 'TGCA')
rc = lambda s: s.translate(comp)[::-1]
A, B, C, D, E = (rand(1500) for _ in range(5))
genome1 = A + B + C + D + E
genome2 = A + rc(C) + B + E + D                       # C inverted and moved; D and E swapped
k = 20
index = {}
for i in range(len(genome1) - k + 1):
    index.setdefault(genome1[i:i + k], []).append(i)
hits = []
for j in range(0, len(genome2) - k + 1, 10):
    w = genome2[j:j + k]
    for i in index.get(w, []): hits.append((j, i, '+'))
    for i in index.get(rc(w), []): hits.append((j, i, '-'))
blocks, cur = [], None
for j, i, s in sorted(hits):
    if cur and s == cur['s'] and j - cur['j1'] <= 30 and abs((i - cur['i1']) - (j - cur['j1']) * (1 if s == '+' else -1)) <= 30:
        cur['j1'], cur['i1'] = j, i
    else:
        cur = {'j0': j, 'i0': i, 'j1': j, 'i1': i, 's': s}
        blocks.append(cur)
for b in blocks:
    if b['j1'] - b['j0'] > 500:
        g1 = sorted((b['i0'], b['i1']))
print(f"genome2 {b['j0']:5d}-{b['j1'] + k:5d} <-> genome1 {g1[0]:5d}-{g1[1] + k:5d} strand {b['s']}")genome2 0- 1500 <-> genome1 0- 1500 strand + genome2 1500- 3000 <-> genome1 3000- 4500 strand - genome2 3000- 4500 <-> genome1 1500- 3000 strand + genome2 4500- 6000 <-> genome1 6000- 7500 strand + genome2 6000- 7500 <-> genome1 4500- 6000 strand +
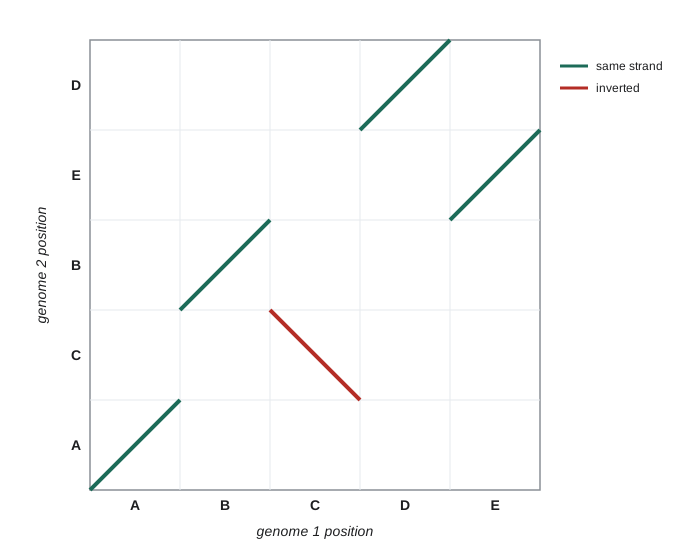
The block list recovers the history built into the invented genomes: segment A is collinear, segment C matches on the opposite strand and has moved (an inversion combined with a transposition), B has shifted to follow it, and D and E have swapped places. A real comparison would also find small blocks from repeats and would need to distinguish true rearrangements from assembly errors, which produce similar patterns.
For bacteria and archaea, whole-genome similarity also defines species in practice. The average nucleotide identity (ANI) of the shared parts of two genomes is above about 95 per cent for strains of the same species, a threshold that corresponds roughly to the older laboratory criterion of 70 per cent DNA–DNA hybridization. ANI is computed from alignments or estimated quickly from k-mer sketches (lesson 3), and the Genome Taxonomy Database now classifies hundreds of thousands of bacterial and archaeal genomes largely on genome-based criteria.
Orthologues, paralogues and gene families
Homologous genes (lesson 5) are orthologues if they diverged by speciation and paralogues if they diverged by duplication. The distinction, made by Walter Fitch in 1970, matters because orthologues usually retain the ancestral function, whereas paralogues often diverge: after duplication, one copy may keep the original role while the other specializes (subfunctionalization) or gains a new function (neofunctionalization), or is lost. Function prediction, comparative analyses and species trees all rely on correct orthologue identification.
The simplest method is reciprocal best hits: gene \(a\) in genome 1 and gene \(b\) in genome 2 are predicted orthologues if each is the other's best match. It is quick but breaks down when duplications have occurred in one lineage after the split, because several in-paralogues all correspond to one gene in the other species. Tree-based methods such as OrthoFinder cluster all genes into orthogroups, the set of genes descended from a single gene in the last common ancestor of the species considered, build a gene tree for each orthogroup, and reconcile it with the species tree to label each node as a speciation or duplication.
# Reciprocal best hits between two invented gene sets, where one lineage duplicated a gene.
import random
random.seed(12)
def mutate(s, rate):
    return ''.join(random.choice('ACGT'.replace(b, '')) if random.random() < rate else b for b in s)
ancestral = {f'g{i}': ''.join(random.choice('ACGT') for _ in range(600)) for i in range(1, 6)}
sp1 = {f'sp1_{g}': mutate(s, 0.10) for g, s in ancestral.items()}
sp2 = {f'sp2_{g}': mutate(s, 0.10) for g, s in ancestral.items()}
sp2['sp2_g3b'] = mutate(ancestral['g3'], 0.18)        # a duplicate copy in species 2, diverging faster
identity = lambda a, b: sum(x == y for x, y in zip(a, b)) / len(a)
best12 = {a: max(sp2, key=lambda b: identity(sa, sp2[b])) for a, sa in sp1.items()}
best21 = {b: max(sp1, key=lambda a: identity(sp1[a], sb)) for b, sb in sp2.items()}
for a, b in best12.items():
    print(f"{a} -> {b} ({identity(sp1[a], sp2[b]):.2f})  reciprocal: {best21[b] == a}")
for b in sp2:
    if best12.get(best21[b]) != b:
print(f"{b} has best hit {best21[b]} ({identity(sp1[best21[b]], sp2[b]):.2f}) but is not reciprocal: an in-paralogue")sp1_g1 -> sp2_g1 (0.79) reciprocal: True sp1_g2 -> sp2_g2 (0.81) reciprocal: True sp1_g3 -> sp2_g3 (0.84) reciprocal: True sp1_g4 -> sp2_g4 (0.81) reciprocal: True sp1_g5 -> sp2_g5 (0.81) reciprocal: True sp2_g3b has best hit sp1_g3 (0.75) but is not reciprocal: an in-paralogue
Gene families expand and contract over evolutionary time. Olfactory receptor genes number about 400 functional genes in humans but more than a thousand in mice and about 2,000 in African elephants; the venom gene families of snakes and the immune gene families of many lineages have expanded repeatedly. Statistical birth–death models of gene gain and loss, applied across a species tree, identify families whose size changed faster than expected, pointing to lineage-specific adaptation.
Whole-genome duplication
Sometimes the entire genome duplicates. Most duplicated genes are then lost over millions of years, but some pairs survive, and the signature of the event remains in large paired syntenic regions within one genome. Two rounds of whole-genome duplication early in vertebrate history (the 2R hypothesis, proposed by Susumu Ohno in 1970) explain why humans have four Hox clusters where many invertebrates have one; teleost fish underwent a third round, and salmonids a fourth. Flowering plants are full of polyploidy: every lineage studied shows ancient duplications, and many crops, including wheat (hexaploid), canola, potato and strawberry, are recent polyploids.
Duplications are dated with the synonymous substitution rate, Ks, the number of synonymous differences per synonymous site between duplicate pairs. Because synonymous changes are mostly neutral and accumulate roughly with time, a whole-genome duplication produces many duplicate pairs of similar age, appearing as a peak in the distribution of Ks values, while continuous small-scale duplication produces an exponentially declining distribution.
Measuring selection across species
Comparing coding sequences between species also reveals selection. Each codon change is synonymous (no change of amino acid) or nonsynonymous. If \(d_N\) is the number of nonsynonymous substitutions per nonsynonymous site and \(d_S\) the number of synonymous substitutions per synonymous site, their ratio \(\omega = d_N/d_S\) measures selection on the protein: \(\omega < 1\) indicates purifying selection removing amino acid changes, which is typical of most genes; \(\omega \approx 1\) suggests neutral evolution, as in pseudogenes; and \(\omega > 1\) suggests positive selection favouring change, as seen at antigen-binding sites of MHC molecules and in some viral surface proteins. Counting methods estimate sites and differences codon by codon; codon substitution models in software such as PAML and HyPhy fit \(\omega\) by maximum likelihood along branches and at individual sites. BIOL-322 described population genetic tests for selection within species, such as the McDonald–Kreitman test, which compares this ratio within and between species.
# Count synonymous and nonsynonymous sites and differences (Nei-Gojobori style) for two invented coding sequences.
import math
bases = 'TCAG'
aa = 'FFLLSSSSYY**CC*WLLLLPPPPHHQQRRRRIIIMTTTTNNKKSSRRVVVVAAAADDEEGGGG'
code = {a + b + c: aa[16 * i + 4 * j + k] for i, a in enumerate(bases) for j, b in enumerate(bases) for k, c in enumerate(bases)}
def sites(codon):
    s = 0.0
    for pos in range(3):
        for b in 'ACGT':
            if b != codon[pos]:
                mut = codon[:pos] + b + codon[pos + 1:]
                if code[mut] != '*' and code[mut] == code[codon]:
                    s += 1 / 3
    return s, 3 - s
def diffs(c1, c2):
    d = [p for p in range(3) if c1[p] != c2[p]]
    if not d: return 0.0, 0.0
    if len(d) == 1:
        return (1.0, 0.0) if code[c1] == code[c2] else (0.0, 1.0)
    syn = 0 if code[c1] != code[c2] else len(d)       # simplification for multiple-hit codons
    return float(syn), float(len(d) - syn)
seq1 = 'ATGGCTAAAGGTCTGCCAGAATTCGGCACCGTGCTGAAAGATCGTTGGCAGTTTATG'
seq2 = 'ATGGCCAGAGGCCTGCCGGAATTTGGCACCGTCCTGAAAAATCGTTGGCATTTTATG'
S = N = Sd = Nd = 0.0
for i in range(0, len(seq1), 3):
    c1, c2 = seq1[i:i + 3], seq2[i:i + 3]
    s1, n1 = sites(c1); s2, n2 = sites(c2)
    S += (s1 + s2) / 2; N += (n1 + n2) / 2
    sd, nd = diffs(c1, c2); Sd += sd; Nd += nd
pS, pN = Sd / S, Nd / N
jc = lambda p: -0.75 * math.log(1 - 4 * p / 3)               # Jukes-Cantor correction
print(f"protein 1: {''.join(code[seq1[i:i+3]] for i in range(0, len(seq1), 3))}")
print(f"protein 2: {''.join(code[seq2[i:i+3]] for i in range(0, len(seq2), 3))}")
print(f"synonymous sites {S:.1f}, nonsynonymous sites {N:.1f}; differences Sd={Sd:.0f}, Nd={Nd:.0f}")
print(f"dS = {jc(pS):.3f}, dN = {jc(pN):.3f}, omega = dN/dS = {jc(pN) / jc(pS):.2f}")protein 1: MAKGLPEFGTVLKDRWQFM protein 2: MARGLPEFGTVLKNRWHFM synonymous sites 12.2, nonsynonymous sites 44.8; differences Sd=5, Nd=3 dS = 0.595, dN = 0.070, omega = dN/dS = 0.12
The two invented sequences differ at eight codons, five of them synonymous and three changing an amino acid. Because there are almost four times as many nonsynonymous as synonymous sites, the per-site rates differ much more than the raw counts: ω is about 0.12, indicating purifying selection. With only 19 codons the estimates are very uncertain, and the simplified handling of codons with more than one difference would matter in more divergent sequences; real analyses use whole genes and likelihood models.
Conservation of noncoding sequence is equally informative. Comparisons of many mammals reveal that roughly 5 to 10 per cent of the human genome has been under purifying selection, far more than the 1 to 2 per cent that codes for protein. The Zoonomia Project, which aligned the genomes of 240 placental mammal species and published its main analyses in 2023, estimated that at least 10 per cent of the human genome is evolutionarily constrained, and identified millions of constrained bases outside genes, many in regulatory elements. Ultraconserved elements, stretches of 200 bases or more identical between human, mouse and rat, are among the most constrained sequences known, although deleting some of them in mice produced surprisingly mild effects.
Phylogenomics
Phylogenomics infers species relationships from hundreds or thousands of genes. Two broad strategies exist. Concatenation joins the alignments of many genes into a supermatrix and infers one tree by maximum likelihood, assuming all genes share the same history. Coalescent-based methods (BIOL-322 introduced the coalescent) recognize that individual gene trees can legitimately differ from the species tree, because of incomplete lineage sorting: when speciation events follow each other quickly, ancestral polymorphisms persist through them, and a gene's lineages may coalesce in an order that differs from the order of speciation. Methods such as ASTRAL infer gene trees separately and find the species tree that agrees with the most quartets of taxa across them. Gene tree discordance can also arise from hybridization and introgression, from horizontal gene transfer and, spuriously, from errors in orthology or alignment.
Large phylogenomic studies have resolved many long-standing questions while revealing that some radiations, such as the early diversification of placental mammals and of modern birds, occurred so rapidly that gene trees conflict extensively and the true branching order is hard to recover. The molecular clock calibrated with fossils (BIOL-321) dates the branches, with uncertainty that depends heavily on the calibrations used.
Prokaryotic pangenomes and horizontal gene transfer
Bacterial species are defined less by a fixed genome than by a pangenome: the core genome of genes present in all strains, and an accessory genome of genes present in some. In Escherichia coli, any single genome has about 4,500 to 5,500 genes, but the species pangenome contains tens of thousands of gene families, and each newly sequenced strain adds new ones, an open pangenome. Much of the accessory genome arrives by horizontal gene transfer through plasmids, phages and transposons (BIOL-330), including antibiotic resistance and virulence genes. Transferred genes are detected by phylogenetic incongruence, a gene tree that conflicts with the species tree; by patchy distribution among relatives; and by atypical composition, such as GC content or codon usage unlike the rest of the genome (lesson 1's suspicious contig).
| Question | Comparative approach | Typical tools |
|---|---|---|
| Are two bacterial isolates the same species? | Average nucleotide identity of shared regions | FastANI, Mash, GTDB-Tk |
| Which genes are orthologous across species? | Orthogroups and gene tree reconciliation | OrthoFinder, reciprocal best hits |
| How have genomes been rearranged? | Whole-genome alignment, dot plots, synteny blocks | MUMmer, minimap2, MCScanX |
| Was there a whole-genome duplication? | Paired syntenic blocks, Ks peak | MCScanX, wgd |
| Is a gene under positive selection? | dN/dS by codon models | PAML, HyPhy |
| What is the species tree? | Concatenation or coalescent summary of gene trees | IQ-TREE, RAxML, ASTRAL |
Worked problem
A duplicated gene in a crop
In an invented allotetraploid oilseed crop, a gene for a fatty acid desaturase has two copies, A and B, one inherited from each diploid parent species. Copy A has ω = 0.12 compared with its orthologue in a parent species; copy B has ω = 0.95 and is not expressed in seeds. What do these values suggest?
Show solution
- An ω of 0.12 indicates strong purifying selection: amino acid changes in copy A have mostly been removed, consistent with a conserved, functional protein.
- An ω near 1 for copy B suggests relaxed constraint, with amino acid changes accumulating at about the neutral rate.
- Together with loss of seed expression, copy B may be on the way to becoming a pseudogene, or may function elsewhere if expressed in other tissues.
- Check for premature stop codons or frameshifts in B, and test expression in other tissues before concluding.
- This is a common fate of duplicates after polyploidy: one copy retains function, the other decays or specializes.
Answer: Copy A is under purifying selection and probably carries the function; copy B appears to be under relaxed constraint and may be degenerating.
Common mistakes
MistakeCalling every homologue an orthologue.
InsteadDistinguish orthologues (speciation) from paralogues (duplication), using gene trees when duplications are present.
MistakeRelying on reciprocal best hits when lineage-specific duplications exist.
InsteadUse orthogroup and tree-based methods that handle one-to-many relationships.
MistakeAssuming all gene trees should match the species tree.
InsteadIncomplete lineage sorting, introgression and horizontal transfer cause genuine discordance.
MistakeInterpreting ω > 1 averaged over a whole gene as the only sign of positive selection.
InsteadPositive selection often affects a few sites or branches; use site and branch models.
MistakeDescribing a bacterial species by one reference genome.
InsteadBacterial species have pangenomes with large accessory gene sets.
Summary and key terms
- Whole-genome alignment chains anchors into blocks; dot plots reveal collinearity, inversions and translocations.
- ANI above about 95 per cent indicates the same prokaryotic species; synteny blocks record rearrangement history.
- Orthologues arise by speciation and paralogues by duplication; reciprocal best hits and orthogroup methods identify them.
- Gene families expand and contract; whole-genome duplications leave paired syntenic regions and Ks peaks.
- ω = dN/dS measures selection on proteins; noncoding constraint shows that much more than coding sequence is functional.
- Phylogenomics uses concatenation or coalescent methods; incomplete lineage sorting and gene transfer cause gene tree discordance, and prokaryotes have open pangenomes.
- synteny
- Conservation of gene order or chromosomal location between genomes.
- dot plot
- A plot of matches between two sequences that reveals collinearity and rearrangements.
- average nucleotide identity
- The mean identity of aligned regions shared by two genomes.
- orthologue
- A homologue that diverged by speciation.
- paralogue
- A homologue that diverged by gene duplication.
- orthogroup
- The set of genes descended from one gene in the last common ancestor of the species studied.
- whole-genome duplication
- Duplication of an entire genome, as in polyploidy.
- dN/dS
- The ratio of nonsynonymous to synonymous substitution rates, measuring selection on proteins.
- incomplete lineage sorting
- Persistence of ancestral polymorphism through speciation, causing gene trees to differ from the species tree.
- pangenome (prokaryotic)
- The full set of genes found across strains of a species, divided into core and accessory genes.
Practice problems
Work each problem on paper first, then reveal the answer to check.
In a dot plot, what does a line running from upper left to lower right indicate?
Show answer
An inversion: the sequences match in reverse-complement orientation.
Two bacterial genomes have ANI of 91 per cent. Are they the same species by the usual criterion?
Show answer
No; the species threshold is about 95 per cent.
Why do reciprocal best hits fail after a lineage-specific duplication?
Show answer
Several in-paralogues correspond to one gene in the other species, but only one can be a reciprocal best hit.
What feature of a Ks distribution indicates an ancient whole-genome duplication?
Show answer
A peak of many duplicate pairs with similar Ks.
A gene has dN = 0.02 and dS = 0.20. What is ω and what does it suggest?
Show answer
ω = 0.1, strong purifying selection.
Why can gene trees differ from the species tree even without errors?
Show answer
Incomplete lineage sorting, hybridization or horizontal gene transfer.
What did the Zoonomia Project estimate about constraint in the human genome?
Show answer
At least 10 per cent of the genome is evolutionarily constrained.
Name two signals of horizontal gene transfer in a bacterial genome.
Show answer
Phylogenetic incongruence and atypical GC content or codon usage (or patchy distribution among relatives).
Lesson quiz · 5 questions
Score 60% or more to complete this lesson.
Create a free account to save your progress, take quizzes and earn a certificate.