
BAS-310 · Lesson 11 of 12 · 22 min
Network troubleshooting with protocol analyzers
▶ Video coming soon A video version of this lesson is on the way.
At the end of the November 3 evening, Prakash opened the capture he had taken on Ninefield's seventh-floor trunk on September 21, the day the duplicate address and the third terminator were found. He had clipped a small USB adapter onto the trunk at the floor router, recorded ten minutes of traffic, and saved it as a file the same analyzer software used for IP networks could read. "A meter tells you about the wire," he said. "The router's diagnostics tell you what the router thinks. A capture tells you what actually happened, frame by frame. Most of the time you won't need one. When you do, nothing else will do."
Start with the layers
Network faults can be sorted by layer, from the wire up to the data, and checking them in that order saves time. A protocol analyzer is the tool for the middle and upper layers; it is wasted on a broken wire.
| Layer | What can go wrong | First tools |
|---|---|---|
| Physical | Open or shorted pair, missing or extra terminators, reversed polarity, stubs, broken shield, noise | Visual inspection, multimeter, resistance across the pair (BAS-210) |
| Data link | Duplicate MAC address, wrong baud rate, Max_Master set too low, two BBMDs on a subnet | Router and controller diagnostics, MS/TP or IP capture |
| Network | Duplicate network numbers, missing routes, broadcasts not crossing subnets | Router tables, BDT and foreign device table, capture |
| Application | Duplicate device instances, unsupported services, wrong object or property, segmentation mismatch, write refused | BACnet discovery tool, generic browser, capture |
On September 21, the physical layer gave the first clue: 41 ohms across the pair instead of the expected 60 or so. Two 120 ohm terminators in parallel give 60 ohms; three give 40. But a third terminator alone does not usually make a trunk fail, and Prakash wanted to see why the floor dropped in and out, so he captured.
Worked problem
Reading termination from a resistance measurement
With power off and the pair disconnected from any bias network, what resistance should be measured across an MS/TP trunk with (a) correct termination of 120 ohms at each end, (b) one terminator missing, (c) three terminators? What did Ninefield's 41 ohms indicate?
Show solution
- (a) Two in parallel: 120 × 120 ÷ (120 + 120) = 60 ohms.
- (b) One: 120 ohms.
- (c) Three in parallel: 120 ÷ 3 = 40 ohms.
Answer: 41 ohms is three terminators, allowing for cable resistance. After VAV-7-14's terminator was switched off, the meter read 61 ohms, two terminators, as BAS-210 recorded.
Capturing MS/TP traffic
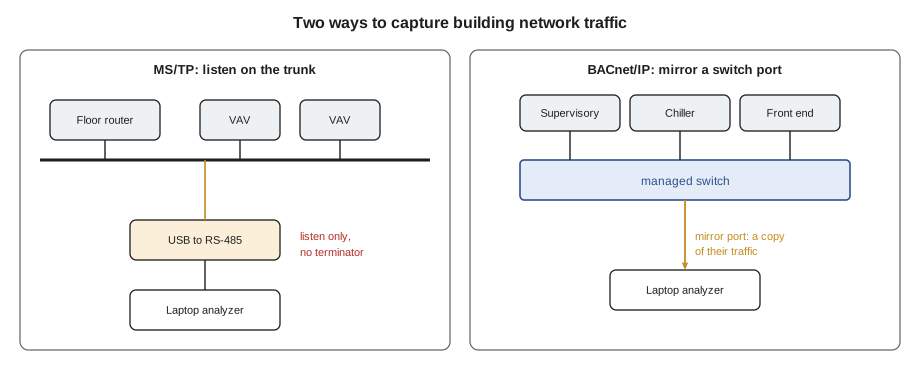
A PC cannot listen to an MS/TP trunk through an ordinary network port. MS/TP capture uses a USB-to-RS-485 adapter connected to the trunk like another device but configured never to transmit, and a small capture program that records every frame it hears with a time stamp, in a file format the analyzer can open. The analyzer then decodes each frame: token, poll for master, data frames and their BACnet contents. The adapter must not add a terminator or bias of its own, and it should be connected at a point where the signal is good, usually at the router.
Sample decode, Ninefield floor 7 trunk, 21 September (times in seconds)
  No.  Time      Src  Dst  Frame type                          Notes
  412  3.0105    2    3    Token
  413  3.0129    3    4    Token                               from VAV-7-03
  414  3.0130    3    4    Token  [bad header check]           second device at MAC 3 transmitting at once
  415  3.5131    -    -    (silence 500 ms)
  416  3.5148    0    1    Token                               router regenerates the token
  417  3.5171    1    2    Token
  ...
  437  3.5602    3    0    BACnet Data Not Expecting Reply     I-Am, device 1
  438  3.5603    3    0    BACnet Data Not Expecting Reply     [bad data check]
The pattern repeated every few seconds. Each time the token reached MAC 3, two devices answered, the frames collided and were corrupted, nobody received a valid token, and the trunk fell silent for the 500 ms the standard requires before the lowest master, the router at MAC 0, regenerated it. Devices above MAC 3 got the token only now and then, and their replies to the front end often timed out. The same capture showed an I-Am from "device 1" at MAC 3, which was the clue to the duplicate device instance described in lesson 6.
Capturing BACnet/IP traffic
On an IP network, the analyzer can capture from the PC's own network port, but a modern Ethernet switch only sends a port the traffic addressed to it and the broadcasts. To see conversations between other devices, the capture must be taken from a mirror port, which a managed switch can be set to copy chosen traffic to, or through a network tap inserted in a cable. On a client's IT network, setting up a mirror port is IT's job, and capturing without their permission is never acceptable.
The analyzer recognizes BACnet/IP by its UDP port and decodes each layer: the virtual link header from lesson 5, the network layer with any network numbers and the application layer with the service, the objects and the values. Display filters show only what matters, such as only BACnet application traffic, only one device's address, or only errors and rejects.
| What to look for in a capture | What it suggests |
|---|---|
| The same confirmed request repeated with the same invoke ID | Answers are not arriving: the server is slow, overloaded or unreachable |
| Reject, abort or error replies | An unsupported service, a segmentation mismatch, an unknown object or a refused write |
| Two I-Am replies for the same device instance | Duplicate device instance |
| Each broadcast appearing twice on a subnet | Two BBMDs on the subnet, or a BDT error |
| Bursts of hundreds of I-Am replies | A Who-Is with no range, perhaps repeated by a misconfigured tool |
| Token frames with bad checks, or regular 500 ms silences on MS/TP | Collisions, noise, a duplicate MAC or bad wiring |
Measuring rather than guessing
A capture also lets a technician measure a network instead of describing it. The analyzer's statistics show how many requests were made, how many were retried, how long answers took and how busy the network was. Those numbers turn a complaint like "the front end is slow" into a finding that can be fixed and later checked.
Worked problem
Retry rate and answer time from a capture
A ten-minute capture of one floor's trunk, before the fix, contained 1,240 confirmed requests from the router, of which 186 were retries of earlier requests. Answers that did arrive took an average of 420 ms. After the fix, a second ten-minute capture showed 1,105 requests with 3 retries and an average answer time of 95 ms. What were the retry rates, and how much faster were answers?
Show solution
- Before: 186 ÷ 1,240 = 0.150, so 15 retries in every 100 requests.
- After: 3 ÷ 1,105 = 0.0027, about 0.3 in every 100.
- Answer time: 420 ÷ 95 = 4.4 times faster.
Answer: Retries fell from 15 in 100 to under 1 in 100, and answers came back more than four times faster. The total number of requests also fell, because the router no longer had to repeat itself. Prakash put both sets of numbers in the work order: a fix that can be measured can also be proven.
Other tools
A generic BACnet discovery and browsing tool, like the one in lesson 2, is often the fastest way to answer application questions: which devices answer, which instances are duplicated, which objects and properties a device really has, and whether a write is accepted. Router and supervisory controller diagnostics show per-trunk statistics, such as token losses and retries, without any capture at all. Analyzer software also decodes Modbus TCP on port 502, and serial Modbus RTU can be captured with the same kind of listen-only adapter used for MS/TP and a suitable capture program.
Some faults are timing faults that only an oscilloscope shows: a trunk whose signal is so distorted by a long stub or a bad terminator that devices misread bits. Quillon kept a small handheld oscilloscope for those cases and rarely needed it; nearly every trunk problem Callie would meet could be found with a meter, the router's diagnostics and, now and then, a capture.
Handling captures responsibly
A capture is a record of a building's operation: device names, addresses, schedules, setpoints and sometimes passwords sent in clear text by older devices. Quillon treated capture files as client confidential: stored only on company laptops, named with the site and date, deleted when the job was closed, and never posted to public forums when asking for help. Captures on networks shared with IT were taken only with IT's written permission, a rule that BAS-430's security lessons explain in more detail.
Callie scrolled through the after-fix capture: token, token, token, a read, an answer, token. "It's boring," she said. "That's the idea," said Prakash.
Reading a capture step by step
A capture of a few minutes on a busy network holds thousands of messages, and the skill is in narrowing them down. Analyzers can filter by device address, service or message type, and the most useful first filters are usually simple: one device's traffic, or only the error, reject and abort messages. The listing below is a short extract of the kind Callie learned to read, from a BACnet/IP capture filtered to one controller.
time      source          destination     message
0.000     front end       10.40.12.10     ReadPropertyMultiple   invoke-id 17
3.002     front end       10.40.12.10     ReadPropertyMultiple   invoke-id 17   (retry)
6.004     front end       10.40.12.10     ReadPropertyMultiple   invoke-id 17   (retry)
6.410     10.40.12.10     front end       Abort  segmentation-not-supported   invoke-id 17
6.420     front end       10.40.12.10     ReadPropertyMultiple   invoke-id 18   (fewer properties)
6.470     10.40.12.10     front end       ComplexACK                             invoke-id 18
The extract tells a story in six lines. The front end asked for a large group of properties, heard nothing for three seconds, and retried twice. The controller finally answered that it could not segment the reply, and the front end asked for fewer properties, which worked at once. The fault is not in the wiring or the addresses but in the size of the request, and the fix is in the front end's settings for that device. Without the capture, the symptom was only that some values on one graphic updated slowly.
A fault-finding sequence
Quillon's technicians follow the same order for most network faults, starting at the bottom of the layers and moving up only when a layer is proven good.
| Step | Question | Tool |
|---|---|---|
| 1 | Is the wiring sound: continuity, termination, shield, polarity? | Meter with power off |
| 2 | Are the signal levels and bias right? | Meter or oscilloscope with power on |
| 3 | Is every device present, with a unique address? | Discovery sweep and the addressing register |
| 4 | Is the token or traffic flowing without retries and errors? | Capture and analyzer |
| 5 | Are the right requests being made, at a sensible rate and size? | Capture filtered by device and service |
| 6 | Is the application configured correctly? | Front end, controller and gateway settings |
Skipping steps is tempting, especially when a laptop is already connected, but it costs time more often than it saves. A capture of a trunk with a missing terminator is full of errors that point everywhere at once; ten minutes with a meter would have found the cause.
Writing up the findings
A network fault is not finished when it is fixed. The work order should record what was found, how it was proven, what was changed and how the change was tested, with any capture saved in the job file. The next technician to visit the building, and the owner, then have a record of what the network looked like when it worked, which is the most useful thing to compare against when it stops working again.
A good write-up is short. For the Ninefield seventh-floor trunk, it would read: VAV-7-14 at factory MAC 3, duplicating VAV-7-03, with its terminator on mid-trunk, and a 12 m (40 ft) stub to a new box; resistance 41 ohms before and 61 ohms after; addresses corrected and wiring made good; token loop clean in a five-minute capture; register updated. Anyone reading it a year later can see what happened and check that it has not happened again.
Common mistakes
MistakeReaching for an analyzer before checking the wiring.
InsteadCheck the physical layer first: inspection, resistance and polarity.
MistakeConnecting a capture adapter with its own terminator switched on.
InsteadSet the adapter to listen only, with no termination or bias.
MistakeCapturing on a client's IT network without permission.
InsteadAsk IT to set up a mirror port, and get written permission.
MistakeDescribing a slow network without measuring it.
InsteadRecord retry rates and answer times before and after a fix.
MistakePosting capture files online to ask for help.
InsteadTreat captures as client confidential and share only with permission.
Summary and key terms
- Troubleshoot by layer: physical, data link, network, application.
- Correct MS/TP termination measures about 60 ohms; one terminator about 120, three about 40.
- MS/TP capture uses a listen-only USB-to-RS-485 adapter and decodes every frame with time stamps.
- BACnet/IP capture needs a switch mirror port or a tap to see other devices' traffic.
- Repeated invoke IDs, rejects, duplicate I-Ams and regular silences are common warning signs.
- Analyzer statistics turn complaints into measurements that prove a fix.
- Captures contain confidential building data and need permission and care.
- Protocol analyzer
- Software that captures network traffic and decodes each message.
- Capture
- A recorded file of network traffic with time stamps.
- Listen-only adapter
- A capture interface that receives on a trunk but never transmits.
- Mirror port
- A switch port set to copy traffic from other ports for capture.
- Network tap
- A device inserted in a cable to copy its traffic for capture.
- Display filter
- An analyzer setting that shows only chosen traffic.
- Retry rate
- The fraction of requests that had to be sent again.
Practice problems
Work each problem on paper first, then reveal the answer to check.
A trunk measures 118 ohms with power off. What is likely wrong?
Show answer
Only one terminator is fitted.
A capture shows 240 retries in 2,000 requests. What is the retry rate?
Show answer
240 ÷ 2,000 = 0.12, 12 in every 100.
Every Who-Is appears twice on Tilden's subnet. What do you check?
Show answer
Whether there are two BBMDs on that subnet, and the BDTs.
Why will a capture from your laptop's own network port miss most traffic between controllers?
Show answer
The switch only sends your port traffic addressed to it, plus broadcasts.
A capture shows regular 500 ms silences on an MS/TP trunk. What is happening?
Show answer
The token is being lost and regenerated.
Lesson quiz · 5 questions
Score 60% or more to complete this lesson.
Create a free account to save your progress, take quizzes and earn a certificate.