
BAS-110 · Lesson 11 of 12 · 24 min
Reading mechanical drawings and schedules
▶ Video coming soon A video version of this lesson is on the way.
On Thursday, November 5, Declan Kilbride called Callie into Quillon's meeting room, where the drawings for Tilden Hall's AHU-2 replacement were spread across the table. Harcastle's engineers had designed a new air handler for the lecture wing, to be installed in the summer of 2027, and Quillon was pricing the controls. The set included the original 1988 mechanical drawings, the engineer's new design drawings, the equipment schedules and a written sequence of operations. "Before you can wire or program anything, you have to be able to read this," Declan said. "Prakash says you are ready. Find me every point we will need on AHU-2, and tell me anything that looks wrong."
This lesson explains how to read the drawings and documents a controls technician uses: mechanical floor plans, schematics and flow diagrams, equipment schedules, controls drawings, point lists and the sequence of operations. It covers symbols, abbreviations, scales and the habits that keep a technician from missing what matters.
The drawing set
A building project produces a set of drawings for each discipline, numbered by a letter: A for architectural, S for structural, M for mechanical, P for plumbing, E for electrical, FP or F for fire protection, and often C or BAS for controls. The mechanical drawings show the heating, ventilating and air conditioning systems. A typical mechanical set starts with a legend sheet of symbols and abbreviations, then floor plans for ductwork and piping, larger-scale plans of mechanical rooms, sections, details, schematics of the plants and air systems, and schedules of equipment. The controls drawings, prepared by the controls contractor as shop drawings and approved by the engineer, show each system's control diagram, wiring details, panel layouts and a point list.
Drawings are issued in stages, and the stage matters. Design development and tender drawings may change; drawings issued for construction are the ones to build from; addenda and change notices modify them; and as-built or record drawings show what was actually installed. On an existing building like Tilden Hall, the original drawings are often the only record, and they are often wrong where the building was changed later. Declan's first rule for Callie was to check the title block of every sheet for its revision and date, and to treat old drawings as a starting point, not as the truth.
Scales and dimensions
Drawings are drawn to scale. Canadian drawings use metric scales, such as 1:100 for floor plans and 1:50 or 1:20 for mechanical rooms and details, although many older drawings, and many from American engineering firms, use imperial scales such as 1/8 inch to the foot. At 1:100, one millimetre on the paper is 100 millimetres in the building. A scale rule, or the scale in a PDF viewer, gives distances; but the dimension written on the drawing always takes priority over a measurement taken from it, because prints can be enlarged or shrunk.
Worked problem
Measuring a duct run from a plan
On the 1:100 floor plan of the lecture wing, the supply duct from AHU-2 to the first branch measures 45 mm on the drawing. How long is it in the building?
Show solution
- At 1:100, 1 mm on the drawing is 100 mm in the building.
- 45 × 100 = 4,500 mm = 4.5 m.
Answer: About 4.5 m, if the print is at its true scale. Check against a written dimension before ordering cable or conduit.
Symbols and abbreviations
Every mechanical set has a legend, and symbols vary between engineers, so read the legend before anything else. Most sets use similar conventions. Ducts are drawn as double lines with their size written beside them, such as 600 × 400 for a rectangular duct, width first, or a diameter with a circle symbol for round duct. Supply, return and exhaust ducts are often distinguished by symbols across the duct or by labels. Pipes are drawn as single lines with letters showing what they carry: HWS and HWR for hot water supply and return, CHWS and CHWR for chilled water, CWS and CWR for condenser water, LPS for low-pressure steam, LPC or PC for pumped condensate, and so on. Valves, dampers, pumps, coils and instruments each have a symbol.
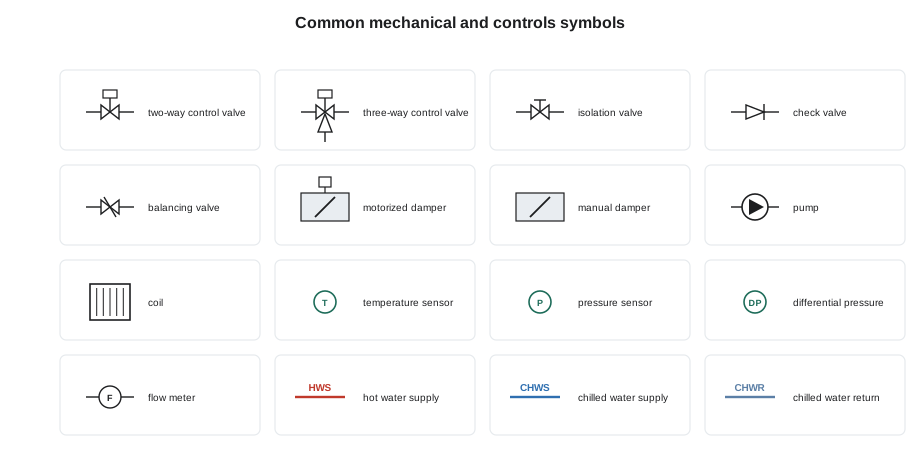
Instruments and control devices are often tagged with codes based on the ISA instrumentation standard, in which the first letter is the measured variable and the following letters are the function. TT is a temperature transmitter, PT a pressure transmitter, DPT a differential pressure transmitter, FT a flow transmitter, TS a temperature switch, TV or TCV a temperature control valve, and so on. Building controls drawings often use simpler labels, such as SAT for supply air temperature or MAT for mixed air temperature, matching the point names. Abbreviations that a technician meets constantly include AHU, RTU, FCU, VAV, EF (exhaust fan), RF (return fan), OA, RA, SA, EA and MA for outdoor, return, supply, exhaust and mixed air, and NC and NO for normally closed and normally open.
| Abbreviation | Meaning | Abbreviation | Meaning |
|---|---|---|---|
| AHU | Air handling unit | HWS / HWR | Hot water supply / return |
| VAV | Variable air volume terminal | CHWS / CHWR | Chilled water supply / return |
| FCU | Fan coil unit | LPS / LPC | Low-pressure steam / condensate |
| EF / RF | Exhaust fan / return fan | DPT | Differential pressure transmitter |
| OA / RA / SA / EA | Outdoor, return, supply, exhaust air | NC / NO | Normally closed / normally open |
| MAT / SAT | Mixed / supply air temperature | VFD | Variable frequency drive |
Schematics and flow diagrams
Floor plans show where things are; schematics show how they connect. A plant schematic or flow diagram shows a boiler or chiller plant as a diagram of pipes, pumps, valves and equipment, without regard to their physical positions, so that the flow paths are clear. An air system schematic shows an air handler's sections, dampers, coils and fans in order, with every sensor and control device marked. These are the drawings a controls technician uses most, because they show exactly what the controls must measure and move. The controls shop drawings usually redraw each system as a control schematic with every point tagged and listed.
Reading a schematic is a matter of following the flow. Start at one point, such as the outdoor air intake of an AHU or the supply of a pump, and follow the arrows through each device to the end, asking at each one what it does, what controls it and what tells the controls it is working. Then do the same for each other path. Callie traced AHU-2's new schematic this way and listed every device in order: outdoor air damper with actuator and an airflow measuring station, return and relief dampers, a MERV 8 prefilter and MERV 13 final filter each with a differential pressure sensor, a hot water preheat coil with a two-way valve and a freeze stat, a chilled water coil with a two-way valve, a supply fan array on a drive, and sensors for outdoor, mixed, discharge and supply air temperature, duct static pressure and return carbon dioxide.
Equipment schedules
Schedules are tables on the drawings that give the details of each piece of equipment: its tag, its location and service, its capacity, its electrical characteristics and any special requirements. An air handler schedule lists airflows, minimum outdoor air, fan static pressure and motor power, coil capacities and entering and leaving conditions. A pump schedule lists flow, head, motor power and speed. A VAV schedule lists each box's size, maximum and minimum airflows and reheat capacity. For a controls technician, schedules give the setpoints, ranges and limits the controls must work with, and they are the first place to check whether a sensor's range or a valve's size makes sense.
| Item | Value |
|---|---|
| Tag | AHU-2 |
| Service | Lecture wing, Tilden Hall |
| Supply airflow | 5,000 L/s |
| Minimum outdoor air | 1,500 L/s |
| Supply fan | Fan array: 4 fans, total 15 kW, VFD |
| Cooling coil, entering / leaving air | 26 °C / 13 °C |
| Cooling coil, sensible capacity | 78 kW |
| Chilled water, entering / leaving | 7 °C / 12.5 °C |
| Preheat coil | Hot water, two-way valve |
| Filters | MERV 8 prefilter, MERV 13 final |
| Electrical | 600 V, 3 phase, 60 Hz |
Worked problem
Checking a schedule
The AHU-2 schedule lists a supply airflow of 5,000 L/s, a minimum outdoor air of 1,500 L/s and a cooling coil sensible capacity of 78 kW, with air entering at 26 °C and leaving at 13 °C. Do the numbers agree?
Show solution
- Minimum outdoor air fraction: 1,500 ÷ 5,000 = 0.30.
- Sensible capacity: 1.2 × 5,000 × (26 − 13) ÷ 1,000 = 78 kW.
- Both agree with the schedule.
Answer: They agree. A quick check like this catches typing errors in schedules before they become wrong setpoints, wrong sensor ranges or wrong valves.
Callie found one thing that did not agree. The sequence of operations said the supply fan would hold a duct static pressure setpoint of 375 Pa, but the schedule gave the fan array's total external static pressure as only 350 Pa, which would leave nothing for the ductwork beyond the sensor location. She marked it as a question for the engineer. Declan said it was probably a typing error in one of the two documents, but that it was exactly the kind of thing to ask about now, before the controls were built.
Controls drawings, point lists and the sequence
The controls shop drawings tie everything together. Each system has a control diagram showing every device and point, a point list or input/output summary giving each point's name, type, range, controller and terminal, wiring diagrams showing how each device connects, and the sequence of operations, often written into the drawings. A point list for an air handler like AHU-2 might have forty physical points and a hundred software points. Every point on the list should correspond to a device on the schematic, a sentence in the sequence and a line in the program.
Many projects now include the sequence written in the form recommended by ASHRAE Guideline 36, with standard point names and logic. Some also include a points list in a standard format such as Project Haystack or Brick tags, which describe what each point measures so that analytics software can find and use it. BAS-230 and BAS-330 return to these. For now, the important habit is to check the documents against each other: schematic against schedule, schedule against sequence, sequence against point list.
| Point name | Type | Description | Range or states |
|---|---|---|---|
| TH-AHU2-OAT | AI | Outdoor air temperature | −40 to 50 °C |
| TH-AHU2-MAT | AI | Mixed air temperature (averaging) | −20 to 40 °C |
| TH-AHU2-SAT | AI | Supply air temperature | 0 to 50 °C |
| TH-AHU2-DSP | AI | Duct static pressure | 0 to 1,250 Pa |
| TH-AHU2-OAF | AI | Outdoor airflow | 0 to 2,500 L/s |
| TH-AHU2-SF-C | BO | Supply fan start/stop | Off / On |
| TH-AHU2-SF-SPD | AO | Supply fan speed command | 0 to 100 in 100 |
| TH-AHU2-SF-S | BI | Supply fan status | Off / On |
| TH-AHU2-PHV | AO | Preheat valve | 0 to 100 in 100 open |
| TH-AHU2-FRZ | BI | Freeze stat (hard-wired safety) | Normal / Alarm |
Field verification
On an existing building, drawings are checked against reality before they are trusted. A technician walking a system with the drawings marks every difference: a valve that is not where the drawing shows it, a coil that was replaced with a different size, a damper that was removed, a duct that was rerouted. Those red-line mark-ups become the record of the building as it is, and they feed the as-built drawings at the end of a project. Callie and Prakash spent the following week walking AHU-2 with the 1988 drawings and found three differences, including a 1990s steam humidifier that appeared on no drawing at all and would have to be removed or controlled.
Drawings also have a safety purpose. They show where isolation valves and electrical disconnects are, which circuits feed which equipment, and where hazards such as steam lines and high-voltage equipment are. A technician planning a lockout uses them, but still verifies on site that the right valve or disconnect has been isolated, because drawings are not always right.
Riser diagrams and controls network drawings
Two more kinds of drawing matter to a controls technician. Riser diagrams show how pipes, ducts or cables run vertically through a building, floor by floor, and are the quickest way to see which floors a hot water riser or a supply duct serves. Controls network drawings, or network riser diagrams, show every controller on each network trunk, its address, the order in which the trunk visits each one and where the trunk ends. When a whole floor of VAV boxes goes offline, the network drawing shows which controller is first on the trunk beyond the break. Callie found that the 1988 set for Tilden Hall had no network drawing at all, because the original controls were pneumatic. Quillon's own drawing from the 2004 DDC upgrade existed only as a PDF on the service laptop, and two VAV controllers added in 2016 were missing from it. Declan added updating it to the AHU-2 project scope, because the new air handler's controller would join the same trunk.
Keeping these drawings current is part of every job. A network drawing that is wrong costs hours the next time a trunk fails.
Common mistakes
MistakeMeasuring from a print and ignoring written dimensions.
InsteadUse written dimensions first; prints are often not to scale.
MistakeSkipping the legend.
InsteadRead the legend first; symbols differ between engineers.
MistakeBuilding from superseded drawings.
InsteadCheck every sheet's revision and use the current issue.
MistakeTrusting old drawings of an existing building.
InsteadWalk the system, mark the differences and treat drawings as a starting point.
MistakeReading the sequence alone.
InsteadCheck it against the schematic, schedules and point list.
MistakeAssuming an obvious error will be fixed by someone else.
InsteadAsk the engineer in writing before the controls are built.
Summary and key terms
- Drawing sets are organized by discipline; controls drawings show diagrams, wiring and point lists.
- Check each sheet's revision; use current issues and treat old drawings of existing buildings as starting points.
- Drawings are to scale, but written dimensions take priority.
- Read the legend; learn common symbols and abbreviations such as HWS, CHWR, OA, SAT and NC.
- Schematics show how systems connect; follow each flow path device by device.
- Schedules give capacities, airflows, setpoints and electrical data; check them with quick calculations.
- Point lists, schematics, schedules and the sequence must agree with one another.
- Field-verify existing systems and mark up differences for the record drawings.
- Drawing set
- The full collection of drawings for a project, organized by discipline.
- Legend
- The sheet or panel that defines the symbols and abbreviations used.
- Scale
- The ratio between a distance on a drawing and the real distance.
- Schematic
- A diagram showing how parts of a system connect, without regard to physical position.
- Equipment schedule
- A table giving the capacities and characteristics of each piece of equipment.
- Point list
- A list of every input and output point, with its type, range and location.
- Shop drawings
- Drawings prepared by a contractor showing how they will build their part of the work.
- As-built drawings
- Drawings updated to show what was actually installed.
Practice problems
Work each problem on paper first, then reveal the answer to check.
A pipe measures 32 mm on a 1:50 drawing. How long is it?
Show answer
32 × 50 = 1,600 mm = 1.6 m.
What do CHWS and LPS stand for?
Show answer
Chilled water supply and low-pressure steam.
Why check a schedule against a quick calculation?
Show answer
To catch errors before they become wrong setpoints, ranges or devices.
What should you do with a difference between the drawing and the building?
Show answer
Mark it up and report it so the record drawings can be corrected.
Which four documents should agree for each system?
Show answer
The schematic, the schedules, the sequence of operations and the point list.
Lesson quiz · 5 questions
Score 60% or more to complete this lesson.
Create a free account to save your progress, take quizzes and earn a certificate.