
AWS-121 · Lesson 5 of 12 · 20 min
Measuring return on AI investment
▶ Video coming soon A video version of this lesson is on the way.
Before the business case went to the board, Lorraine added one condition to the draft resolution: "Results to be measured against a baseline recorded before launch, using measures agreed in advance." At the next session Andre asked Noor why that condition mattered so much. "Because once the pilot starts, everyone will want it to work," she said. "If you haven't written down what 'working' means and what things looked like before, you'll find the evidence you're hoping for."
This lesson covers the second task of Domain 2: measuring and demonstrating AI business value. It brings together key performance indicators, baselines, ROI frameworks and leading indicators, and shows how to tell an AI system's real effect from everything else that changes at the same time.
Key performance indicators
A key performance indicator (KPI) is a measure that shows whether an initiative is achieving its objective. Good KPIs are specific, measurable, owned by someone, and tied to the value tree from lesson 1. The exam guide distinguishes tangible benefits, which can be expressed in money or hard counts, such as cost reduction and revenue growth, from intangible benefits, such as customer satisfaction and employee productivity, which are real but harder to put a price on.
| KPI type | Examples for the no-show initiative | Examples for the call-note summarizer |
|---|---|---|
| Tangible: revenue or margin | No-shows per 100 appointments; recovered appointments; margin from recovered slots | Overtime hours per month at the emergency hospital |
| Tangible: cost or time | Reception minutes spent on reminder calls per week | Minutes per call note |
| Intangible: customer | Time to next available appointment; complaints about reminders | Client callbacks missed or delayed |
| Intangible: employee | Reception staff survey scores on workload | Technician survey scores on administrative burden; turnover |
| Guardrail (must not get worse) | No-show recall by clinic, especially rural clinics; any complaint about access to care | Clinically important details missed in an audit sample |
The last row is easy to forget. A guardrail metric is a measure that must not get worse while the target metrics improve. The call-note summarizer could cut minutes per note dramatically by leaving things out, which would be a disaster. Measuring the audit sample alongside the speed protects against improving one number at the cost of something more important.
Baselines before launch
A baseline is the value of each KPI before the AI solution is introduced, measured the same way it will be measured afterwards. Without one, any number after launch is just a number. The exam guide emphasizes establishing baselines before implementation so the effect of AI adoption can be measured accurately.
Three practical points make baselines trustworthy:
- Measure over a long enough period. No-show rates vary by season, so a single week tells you little. Cascade Ridge used the same twelve weeks of the previous year plus the six weeks just before launch.
- Use the same definitions. If "no-show" before launch meant "not arrived within 15 minutes and not called", it must mean the same afterwards.
- Record how the work is done now. For time savings, observe or sample the current process. Dr. Kaur's team timed a sample of call notes and found an average of about 6 minutes each.
Separating the AI effect from everything else
The pilot is planned to run at four clinics for twelve weeks from February 2027. To show Andre how its results would be judged, Noor worked through an illustrative outcome: suppose the pilot clinics' no-show rate falls from 7.2 to 5.9 per 100 appointments. It would be tempting to credit the whole drop of 1.3 to the model. But other things change over twelve weeks: the season, a local event, a new reception lead, a price change. That is why Noor insisted on a comparison group of four similar clinics that will not use the model.
Worked problem
Estimating the effect with a comparison group
In Noor's illustrative outcome, the pilot clinics go from 7.2 to 5.9 no-shows per 100 appointments and the comparison clinics go from 6.9 to 6.7 over the same weeks. The pilot clinics have about 10,400 appointments in the twelve weeks. Estimate the effect of the initiative.
Show solution
- Change at pilot clinics: 5.9 − 7.2 = −1.3 per 100.
- Change at comparison clinics: 6.7 − 6.9 = −0.2 per 100. This is the change that would probably have happened anyway.
- Estimated effect of the initiative: −1.3 − (−0.2) = −1.1 per 100.
- \[\text{effect} = (P_{after} - P_{before}) - (C_{after} - C_{before}) = (-1.3) - (-0.2) = -1.1\]
- No-shows avoided in the pilot: 10,400 × 1.1 ÷ 100 ≈ 114.
- Without the comparison group, the claim would have been 10,400 × 1.3 ÷ 100 ≈ 135, an overstatement of about a fifth.
Answer: About 114 no-shows avoided in twelve weeks at the pilot clinics, a reduction of about 1.1 per 100 appointments. The comparison group stops the pilot from claiming credit for a change that was happening everywhere.
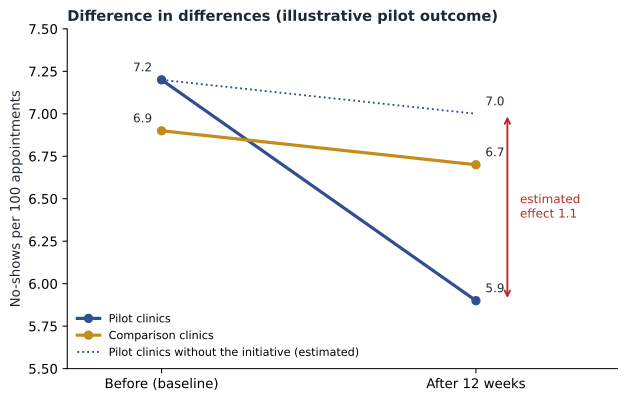
This method is called difference in differences. It is not perfect; it assumes the two groups would have moved in parallel without the initiative. Choosing comparison clinics with similar size, client mix and history makes that assumption more reasonable. Where possible, a randomized test is even better: for example, sending the extra reminder to a random half of flagged bookings at every clinic and comparing the two halves. Noor considered this for the next phase.
ROI frameworks
The exam guide lists the components of a comprehensive ROI framework: time savings, cost reduction, revenue growth and productivity gains. Each needs to be converted to value with care, and each has its own trap.
| Component | How to value it | The trap to avoid |
|---|---|---|
| Time savings | Hours saved × loaded hourly cost, but only for hours that are redeployed or remove paid time | Counting every minute saved as money when the time is not captured |
| Cost reduction | Direct savings in purchases, overtime, rework or penalties, compared with the baseline | Ignoring the new costs of running the AI system |
| Revenue growth | Extra margin (not revenue) attributable to the initiative | Claiming credit for growth that would have happened anyway |
| Productivity gains | More output for the same input, such as more appointments handled per receptionist hour | Measuring activity, such as messages sent, instead of results |
Worked problem
Valuing time savings honestly
The call-note summarizer target is to cut writing time from about 6 to about 2.5 minutes per note. The emergency hospital handles about 14,600 calls a year. A technician's loaded cost is about 45 dollars an hour. What is the time saving, and how much of it is realized value?
Show solution
- Minutes saved per note: 6 − 2.5 = 3.5.
- Minutes saved a year: 14,600 × 3.5 = 51,100, which is about 852 hours.
- Potential value: 852 × 45 ≈ 38,300 dollars a year.
- Realized value depends on what happens to the time. Dr. Kaur plans to use it to cut overnight overtime, which averaged about 40 hours a month.
- If overtime falls by 25 hours a month at an overtime cost of about 65 dollars an hour, the realized saving is 25 × 12 × 65 = 19,500 dollars a year.
Answer: The potential value is about 38,300 dollars a year; the realized cash saving from reduced overtime is about 19,500 dollars. The rest of the time goes into patient care and callbacks, which is valuable but shows up in intangible KPIs rather than the accounts.
Presenting both numbers, potential and realized, is more convincing to a CFO than presenting the larger one. Lorraine said so directly: "The first time I catch a business case inflating its savings, I stop trusting all of them."
Calculating ROI
Once benefits and costs are valued, ROI is simple arithmetic. The common form is:
Results are often written as a ratio, such as 1.32, meaning each dollar of cost returned itself plus 1.32 dollars of net benefit. The period matters: first-year ROI is often low or negative because one-time costs fall early, while three-year ROI shows the fuller picture. Always state the period and whether figures are discounted.
Noor showed Andre how the business case would be updated after the pilot. If the illustrative effect of 1.1 fewer no-shows per 100 appointments held across all clinics, it would suggest about 136,700 × 1.1 ÷ 100 ≈ 1,500 recovered appointments a year, close to the expected case of 1,480. Checking the business case's assumptions against real results like this, and saying openly whether they held up, is what builds a board's confidence in the next proposal.
Leading indicators
Financial results arrive slowly. A strategist also needs leading indicators: early measures that predict whether an initiative will deliver its value. The exam guide asks you to identify leading indicators of AI project success. They are different from lagging indicators, such as yearly margin, which confirm success only after the fact.
| Leading indicator | What it predicts | What Noor will look for in the first four weeks |
|---|---|---|
| Adoption: share of flagged bookings actually followed up | Whether the process around the model is working | At least 80 out of every 100 flagged bookings followed up |
| User trust and feedback | Whether staff will keep using the tool | Reception leads rate the flags useful in a short weekly check-in |
| Model performance in production | Whether predictions are as good as in testing | Recall and precision close to the test results of 0.62 and 0.41 |
| Data pipeline health | Whether scores arrive on time and complete | Daily list delivered by 7:30 a.m. on almost every day |
| Early outcome signal | Direction of the main KPI | No-shows at pilot clinics trending down, though too early to confirm |
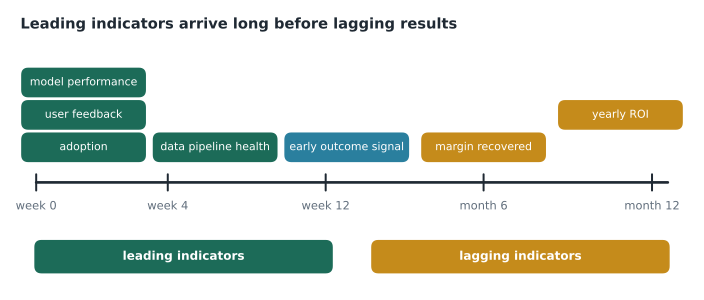
Adoption is often the most telling leading indicator of all. Many AI initiatives fail not because the model is poor but because people do not use it, or use it inconsistently. If only half the flagged bookings were being followed up, no amount of model improvement would deliver the business case. Measuring adoption early lets a team fix training, workflow or tool design while there is still time.
Reporting value over time
A value report is not a one-off. Cascade Ridge is setting up a simple monthly report for each initiative, with the KPIs, their baselines and targets, the leading indicators, the guardrail metrics and a short commentary. Lesson 10 covers how to communicate these results to different audiences. Here the main point is consistency: the same measures, the same definitions and the same comparison, month after month, so trends mean something.
Vanity metrics
A vanity metric is a number that looks impressive but does not show whether value is being created. AI projects attract them easily: the number of predictions made, messages sent, documents processed, users logged in, or questions answered by an assistant. These are activity measures. They can be useful for operations, such as checking that a pipeline runs, but they do not show whether no-shows fell, whether staff time was saved, or whether clients were better served.
Noor's test for any proposed KPI was to ask what decision it would change. If the number of reminder texts sent went up, would anyone decide anything differently? Probably not. If no-shows per 100 appointments failed to fall after twelve weeks, the board would decide whether to stop the initiative. The second measure is a KPI; the first is a vanity metric. On the exam, answers that measure activity rather than outcomes are common distractors.
Finally, every measure needs an owner who looks at it and acts on it. A KPI that nobody reviews is decoration. At Cascade Ridge, each KPI on the monthly report carried a name: Andre for no-shows and adoption, Noor for model performance, Hannah for complaints about access, and the reception leads for follow-up rates at their own clinics.
Common mistakes
MistakeLaunching first and measuring the baseline later.
InsteadRecord baselines before launch, using the same definitions and a long enough period.
MistakeCrediting the AI with every improvement after launch.
InsteadUse a comparison group or randomized test to separate the initiative's effect from general trends.
MistakeCounting all time saved as cash.
InsteadDistinguish potential value from realized value and show both.
MistakeWaiting for yearly financial results to judge a pilot.
InsteadTrack leading indicators such as adoption, user trust, model performance and pipeline health from the first weeks.
Summary and key terms
- KPIs measure whether an initiative meets its objective; they include tangible benefits such as cost and revenue, intangible benefits such as satisfaction and productivity, and guardrail metrics that must not get worse.
- Baselines recorded before launch, with consistent definitions, make measurement possible.
- A comparison group or randomized test separates the AI effect from other changes, for example by difference in differences.
- ROI frameworks combine time savings, cost reduction, revenue growth and productivity, valued honestly with realized and potential value shown separately.
- Leading indicators such as adoption, user trust and production model performance predict success long before lagging financial results arrive.
- KPI
- A measure showing whether an initiative is achieving its objective.
- Guardrail metric
- A measure that must not get worse while target measures improve.
- Baseline
- The value of a measure before a change, recorded the same way as afterwards.
- Comparison group
- A similar group that does not receive the change, used to estimate what would have happened anyway.
- Difference in differences
- The change in the treated group minus the change in the comparison group.
- Leading indicator
- An early measure that predicts later success, such as adoption.
Practice problems
Work each problem on paper first, then reveal the answer to check.
Pilot sites improve from 12 to 9 errors per 1,000 forms; comparison sites from 12 to 11. What is the estimated effect?
Show answer
(9 − 12) − (11 − 12) = −3 − (−1) = −2 errors per 1,000 forms.
Name the four ROI framework components from the exam guide.
Show answer
Time savings, cost reduction, revenue growth and productivity gains.
Why is adoption a strong leading indicator?
Show answer
An initiative cannot deliver value if people do not use it; low adoption can be fixed early if it is measured.
Lesson quiz · 5 questions
Score 60% or more to complete this lesson.
Create a free account to save your progress, take quizzes and earn a certificate.