
ARCH-200 · Lesson 1 of 12 · 24 min
Site analysis
The second-year studio at the Elmhurst School of Architecture opens in September with a bus ride rather than a lecture. Professor Leila Haddad, who ran a practice designing schools and libraries for fifteen years before she started teaching, takes Wren, Callum, Ingrid and Joon-ho and the rest of the class to a corner of Burrows Avenue and Marlow Street in Winnipeg's North End. The lot is empty except for a cracked concrete slab, a chain-link fence, a bus shelter at the corner and one enormous bur oak near the back. 'Last year you designed a house for one person,' Haddad says. 'This term you will design a building for a whole neighbourhood: a library branch, a gym and hall, a community kitchen and a daycare, all under one roof. Before any of that, you are going to spend three weeks learning everything this piece of ground can tell you.'
The project is a real-feeling one. The city has bought the lot, the site of a bus garage demolished several years ago, and has promised the neighbourhood a community hub. The neighbourhood association, chaired by a retired machinist named Ernest Kowalchuk, has collected more than six hundred signatures asking for it. The branch librarian, Sam Okafor, and the director of a daycare that has outgrown a church basement, Rita Moreau, will act as clients alongside the city. The students will meet all three in the coming weeks. First they meet the site.
Why site analysis comes first
In Design Studio I and II the students worked on a park terrace with few neighbours and few rules. A city lot is different. It sits inside a web of streets, utilities, zoning rules, neighbours' expectations and existing patterns of use, and the building will change all of them. Site analysis is the systematic gathering and drawing of these conditions, so that the design responds to the place rather than being dropped onto it. It is also a form of respect: a neighbourhood that has waited years for a building deserves an architect who has looked carefully at what is already there.
Haddad describes three kinds of information. The first is measurable and fixed: the lot lines, the slope of the ground, the soil, the utilities, the sun angles. The second is measurable but changing: traffic at rush hour, noise from the bus route, the shadow of the school across the street at different times of year, the wind in January. The third is human and harder to measure: who walks across the lot as a shortcut, where children wait for the bus, what the old bus garage meant to the people who worked there, which corners feel safe after dark. A good analysis records all three, and the third kind is often the one that shapes the best ideas.
The layers of a site
A standard site analysis is drawn as a series of layers on a common base plan, each showing one kind of information. Layers can be drawn by hand on tracing paper over a printed survey, or on separate layers in a digital model. Overlaying them reveals relationships that no single drawing shows: the path that children already take may cross the best spot for the playground; the quietest corner may also be the darkest in winter.
- Legal: lot lines, setbacks, easements, height limits, coverage limits and permitted uses.
- Physical: topography, drainage, soil, the existing slab and buried services.
- Climatic: sun path, shadows from neighbours, prevailing winds by season, snow drifting.
- Living: trees and vegetation, with species, size and condition.
- Movement: streets, the bus stop, sidewalks, the greenway path, the back lane, desire lines.
- Sensory: noise, views out, views in, smells, light at night.
- Social and historical: what the site was, who uses it now, the character of the neighbouring buildings.
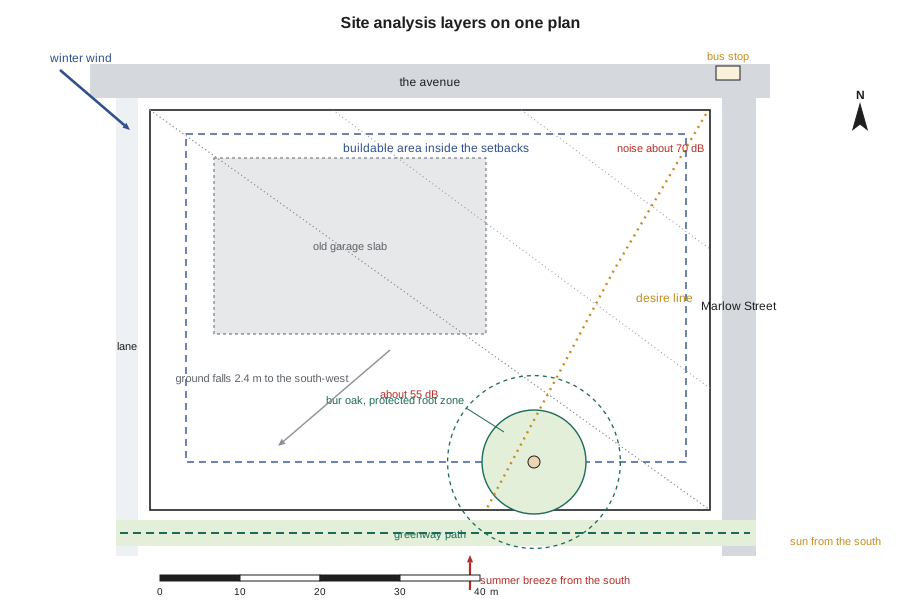
The lot and its rules
The lot is a rectangle 70 m along the avenue and 50 m deep, an area of 3,500 m². The city's zoning for this kind of community site sets a front setback of 3 m from the avenue, 3 m from Marlow Street, 4.5 m from the west lot line, where houses back onto the lane, and 6 m from the greenway at the rear. Buildings may be up to 12 m high, and no more than 60 out of every 100 units of lot area may be covered by buildings. A setback is the minimum distance between a building and a lot line; the area left inside all the setbacks is the buildable area, sometimes called the building envelope in a zoning sense.
Two other numbers describe how much building a lot can hold. Site coverage is the building footprint divided by the lot area. Floor area ratio, often written FAR, is the total gross floor area of all storeys divided by the lot area. A one-storey building covering half the lot has a FAR of 0.5; a two-storey building on the same footprint has a FAR of 1.0. Many zoning codes cap one or both. On this site, the coverage limit matters more than the FAR, because a community hub with a gym is a low, spread-out building.
# Buildable area, coverage and floor area ratio for the corner lot
lot_w, lot_d = 70, 50                 # along the avenue, depth to the greenway (m)
front, side_st, west, rear = 3, 3, 4.5, 6
lot = lot_w * lot_d
build_w = lot_w - side_st - west
build_d = lot_d - front - rear
buildable = build_w * build_d
max_cover = 0.60 * lot
print(f"Lot area:        {lot:9,.0f} m2")
print(f"Buildable box:   {build_w:.1f} x {build_d:.1f} = {buildable:,.0f} m2")
print(f"Coverage limit:  {max_cover:9,.0f} m2")
gross = 2480                         # estimated gross floor area of the hub
for floors in (1, 2):
    footprint = gross / floors
    ok = "fits" if footprint <= min(buildable, max_cover) else "too big"
print(f"{floors} storey(s): footprint {footprint:,.0f} m2, coverage {footprint / lot:.2f}, FAR {gross / lot:.2f} -> {ok}")Lot area: 3,500 m2 Buildable box: 62.5 x 41.0 = 2,562 m2 Coverage limit: 2,100 m2 1 storey(s): footprint 2,480 m2, coverage 0.71, FAR 0.71 -> too big 2 storey(s): footprint 1,240 m2, coverage 0.35, FAR 0.71 -> fits
The calculation settles the first big question before any drawing. If the hub were a single storey, its footprint would exceed the coverage limit, and it would leave almost no room for the daycare's outdoor play area. At least part of the building must be two storeys. The students also notice that the buildable area is long and fairly shallow, which suggests a building that stretches along the avenue and leaves the south side of the lot open.
Measuring and walking the site
Haddad insists that the students walk the site at least four times before the analysis is due: on a weekday morning when children are going to school, at midday, in the late afternoon at rush hour, and after dark. Each visit has a purpose. In the morning, Joon-ho counts thirty-one people crossing the lot diagonally from the bus stop toward the greenway path, through a gap in the fence that has been cut and re-cut for years. At midday, Ingrid notices that the shadow of the three-storey school across the avenue does not reach the lot at all, because the school is to the north. In the late afternoon, Callum records traffic noise of about 70 decibels at the corner but only about 55 near the oak, because the distance and the slope of the ground protect the back of the lot. After dark, Wren finds that the corner by the bus shelter is well lit and busy, while the greenway is dark and empty.
Measurements are simple but important. A long tape, a hand level or a phone inclinometer, a sound-level app, a compass and a camera are enough for a first analysis. The city's survey gives the lot lines and spot elevations; the students check them on the ground and find that the survey is right about the lot but wrong about the oak, which is about 2 m further east than drawn. Small errors of this kind are common, and they are one reason architects visit sites in person.
A desire line is a path worn by people choosing the most direct route, regardless of the official paths. Planners and landscape architects take them seriously because they show real patterns of movement. The diagonal from the bus stop to the greenway is the strongest piece of evidence on the site about how the neighbourhood actually moves, and the students will have to decide whether their building blocks it, redirects it, or makes it part of the design.
Trees, soil and what is underground
The bur oak is the most valuable thing on the site. A city arborist estimates it at about a hundred and twenty years old, with a trunk about 90 cm in diameter at chest height and a crown about 20 m across. Bur oaks are long-lived, tolerate the region's cold and drought and are protected under many municipal tree bylaws. Protecting a large tree during construction means protecting its roots, which spread far beyond the trunk, mostly in the top 600 mm of soil. A common rule of thumb sets a tree protection zone with a radius of about 12 times the trunk diameter, measured from the trunk. Inside that zone, no digging, paving, storage of materials or driving of machinery is allowed.
# Tree protection zone for the bur oak (rule of thumb: radius = 12 x trunk diameter)
import math
dbh = 90                      # trunk diameter at chest height (cm)
radius = 12 * dbh / 100       # in m
area = math.pi * radius ** 2
print(f"Protection radius: {radius:.1f} m")
print(f"Protected area:    {area:,.0f} m2")
print(f"Share of the lot: {area / 3500:.2f}")Protection radius: 10.8 m Protected area: 366 m2 Share of the lot: 0.10
The protected zone covers more than a tenth of the lot. Since the oak stands near the rear setback, most of the zone falls within land that would be open space anyway, but it rules out a building or a parking area at the south-west corner. Haddad points out that the tree also gives the best shade on the site in summer and is the obvious anchor for the daycare's play yard.
Below ground, the students request the geotechnical report the city commissioned. It describes about 1 m of fill left from the bus garage, over a deep layer of stiff clay typical of the region's old lake bed. Clays of this kind swell when wet and shrink when dry, which affects foundations; the report recommends piles rather than shallow footings for a building of this size. It also notes that the old garage slab contains oil staining near its north-east corner, which will have to be removed and disposed of before construction. The city's utility maps show water and sewer mains in the avenue, a gas line in Marlow Street and overhead power along the back lane.
Neighbours, context and character
A community building belongs to its neighbourhood, so the analysis must look beyond the lot lines. To the north, across the avenue, is the elementary school, a brick building from the 1950s with a busy drop-off loop. To the east, across Marlow Street, are a corner store, a Ukrainian Catholic church with onion-shaped domes and a row of small stores with apartments above. To the west, behind the lane, are one- and one-and-a-half-storey houses with deep backyards, many with vegetable gardens. To the south, the greenway runs along the old rail line toward the river and Kestrel Point, the park where the students built their first-year pavilions.
The students draw a figure-ground plan of four blocks around the site, with buildings in black and open space in white, and an elevation of each street frontage. The drawings show that the avenue has a mix of heights and setbacks, that the side streets are low and residential, and that there is no public building with a strong presence on the avenue between the school and the church. Ingrid writes in her notes that the hub can be the third civic building in a small cluster, and that the corner by the bus stop is where it should announce itself.
Talking to the people who know the site
Site analysis is not only observation. Haddad arranges a walk with Ernest Kowalchuk, who worked at the bus garage for twenty-two years. He tells them where the garage doors were, that the site flooded every spring before the city regraded the lane, that children have always used the gap in the fence, and that people at the bus stop have nowhere to wait out of the wind in January. Rita Moreau, the daycare director, walks the back of the lot and says the oak is the reason she wants to move here. Sam Okafor, the librarian, asks that the library be visible from the bus stop, because people who see a library are more likely to come in.
These conversations are recorded alongside the drawn analysis. They often contain the most important insights, and they also begin a relationship of trust between the designers and the community that will continue through the project.
Worked problem
From observation to opportunity
The students have recorded three facts: 31 people an hour cross the lot diagonally in the morning; people waiting for the bus have no shelter from the north-west wind; and the corner is the best-lit, busiest point on the site. What design opportunities follow?
Show solution
- The diagonal shows a strong demand for a route from the bus stop to the greenway. A public path through or beside the building could keep that route, give the hub constant passing traffic and make the library visible to people walking past.
- The waiting bus passengers suggest a covered, wind-sheltered entrance at the corner, where the building's mass blocks the north-west wind and its overhang shelters the stop.
- The busy, well-lit corner is the natural place for the main entrance and for activities used in the evening, such as the hall, which will be lit after dark and keep the corner lively.
- Combining the three suggests an entrance at the corner and a public route running south-west from it to the greenway, with the most public parts of the building along that route.
Answer: Three observations produce one organizing idea: a sheltered corner entrance and a public route through the site that follows the existing desire line.
Exercise 1: the site analysis
This exercise takes about three weeks and is done in groups of four, with each student responsible for at least two layers.
- Visit the site at least four times, at different times of day, and keep a dated log of observations, sketches, photographs and measurements.
- Draw a base site plan at 1:200 from the survey and check its key dimensions on site.
- Draw at least seven analysis layers on the base: legal, physical, climatic, living, movement, sensory and social.
- Calculate the buildable area, the coverage limit and a range of footprints for one- and two-storey schemes.
- Draw a figure-ground plan of the surrounding four blocks and elevations of the street frontages.
- Interview at least two people who know the site and record what they say.
- Finish with a single synthesis drawing that shows the five most important conditions and the opportunities they suggest.
Self-critique checklist
- Have I recorded conditions that change, such as noise and light, as well as fixed ones?
- Does every layer use the same base and scale, so they can be overlaid?
- Have I checked the survey against what I saw on site?
- Does my synthesis drawing make choices, rather than repeating every layer?
- Have I included what the neighbours told me, not only what I measured?
Common mistakes
MistakeDrawing a site analysis that stops at the lot lines.
InsteadShow the surrounding blocks, streets and buildings; the context shapes the design.
MistakeVisiting only once, on a convenient afternoon.
InsteadVisit at different times of day and, if possible, in different weather.
MistakeTreating the survey as infallible.
InsteadCheck key dimensions and features on site.
MistakeRecording facts without interpreting them.
InsteadEnd with a synthesis that turns conditions into opportunities and constraints.
MistakeIgnoring the people who use the site now.
InsteadTalk to them; desire lines, history and fears are part of the site.
Summary and key terms
- Site analysis records the legal, physical, climatic, living, movement, sensory and social conditions of a site, drawn as layers on a common base.
- Setbacks define the buildable area; site coverage and floor area ratio describe how much building a lot can hold.
- Trees need a protected root zone during construction, often about 12 times the trunk diameter in radius.
- Desire lines, noise, light and conversations with neighbours reveal how a site is really used.
- A synthesis drawing turns the analysis into design opportunities.
- Setback
- The minimum required distance between a building and a lot line.
- Buildable area
- The part of a lot left inside all the required setbacks.
- Site coverage
- Building footprint divided by lot area.
- Floor area ratio
- Total gross floor area divided by lot area.
- Desire line
- A path worn by people taking the most direct route.
- Figure-ground plan
- A plan showing buildings in black and open space in white.
Practice problems
Work each problem on paper first, then reveal the answer to check.
A lot is 60 by 40 m. Setbacks are 3 m on all sides. What is the buildable area?
Show answer
54 × 34 = 1,836 m².
A building has a footprint of 1,200 m² and two storeys on a lot of 3,000 m². What are its coverage and FAR?
Show answer
Coverage 0.40; FAR 0.80.
Why should the site be visited after dark?
Show answer
Lighting, safety and night-time use change the character of a site and affect where entrances and evening uses should go.
What does a desire line tell a designer?
Show answer
Where people actually want to walk, which may differ from the official paths.
Why is the bur oak's protected zone larger than its trunk?
Show answer
Most of a tree's roots spread widely and shallowly, well beyond the trunk, and damaging them can kill the tree.
Lesson quiz · 5 questions
Score 60% or more to complete this lesson.
Create a free account to save your progress, take quizzes and earn a certificate.