
ACCT-240 · Lesson 2 of 12 · 26 min
Documenting business processes: flowcharts, data flow diagrams and BPMN
Before anyone can evaluate, improve or audit a system, they need to know how it actually works. Interviews and policy manuals help, but people describe how a process is supposed to work, and the real process often differs. Documentation turns that knowledge into a shared picture that can be checked, discussed and kept up to date. Accountants document processes for many reasons: to understand where errors and fraud could occur, to design controls, to train staff, to prepare for an ERP implementation, to meet regulatory requirements for internal control documentation, and to give auditors evidence of how transactions flow from initiation to the financial statements.
This lesson covers the three documentation tools you are most likely to meet: narratives, flowcharts and data flow diagrams (DFDs), plus the Business Process Model and Notation (BPMN) standard that many ERP projects use. Each tool answers a slightly different question. A narrative tells the story in words. A document or system flowchart shows who does what, with which documents and systems, in what order. A data flow diagram shows where data comes from, how it is transformed and where it is stored, without saying who does the work or with what technology. BPMN shows the sequence of activities, decisions and handoffs between participants in a way that business people and software tools can both read.
Narratives and walkthroughs
A narrative is a written description of a process, usually a few paragraphs per process. It is easy to write and read, and it captures detail that diagrams struggle with, such as the reason a step exists or an exception that happens twice a year. Its weakness is that long narratives hide the structure: it is hard to see from five paragraphs whether the person who approves a credit memo can also record cash receipts. Most organizations combine a short narrative with a diagram. Auditors confirm documentation with a walkthrough, following one real transaction from start to finish, asking each person what they do and inspecting the documents and screens they use. A walkthrough often reveals that the documented process has drifted: a step was dropped when someone left, or a workaround became the normal way of working.
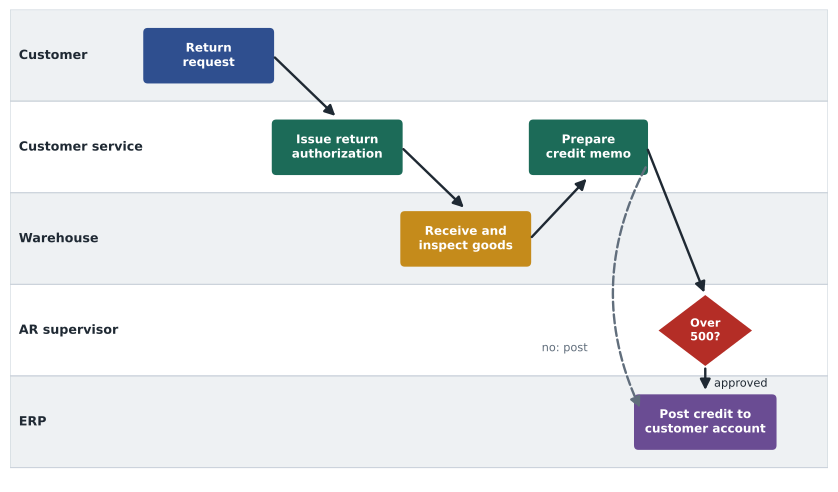
At Ridgeback, the controller documents the sales return process in a narrative: a retailer requests a return through the customer portal; the customer service clerk checks the original invoice and issues a return authorization number; the warehouse receives the goods, inspects them and records the condition in the ERP; the clerk prepares a credit memo for goods accepted; the accounts receivable supervisor approves credit memos above $500; the ERP posts the credit to the customer account and returns undamaged goods to inventory. Even this short narrative raises questions an auditor would ask. Who can create a return authorization without a matching invoice? What happens to damaged goods? Can the clerk who prepares credit memos also approve them below $500?
Flowcharts
A flowchart uses standard symbols to show the flow of documents, data and processing steps. Document flowcharts emphasize paper or electronic documents moving between departments. System flowcharts emphasize inputs, processing by programs and outputs such as files and reports. Program flowcharts show the logic inside a single program and are mostly used by programmers. Accountants usually draw document and system flowcharts with swimlanes, columns or rows that each represent a department or role, so that a reader can see at a glance which role performs which step and where work changes hands.
| Symbol | Meaning | Example at Ridgeback |
|---|---|---|
| Rectangle | Manual or computer processing step | Clerk enters return authorization |
| Document shape | A paper or electronic document | Credit memo |
| Diamond | Decision | Credit memo over $500? |
| Cylinder or disk | Stored data or database | ERP customer master and open items |
| Parallelogram | Input or output | Return request from customer portal |
| Arrow | Direction of flow | Goods from receiving to inspection |
| Off-page connector | Flow continues on another page | To the general ledger posting process |
Good flowcharts follow a few conventions. Flow goes from top to bottom and left to right. Every document has a clear origin and destination, so none appear from nowhere or vanish. Each decision diamond has labelled exits. Swimlanes are arranged so that the most frequent handoffs are between adjacent lanes. A flowchart should be detailed enough to show the controls, such as approvals, reconciliations and system checks, but not so detailed that it becomes unreadable. When a process is complex, draw a high-level diagram first and separate detailed diagrams for each part.
Data flow diagrams
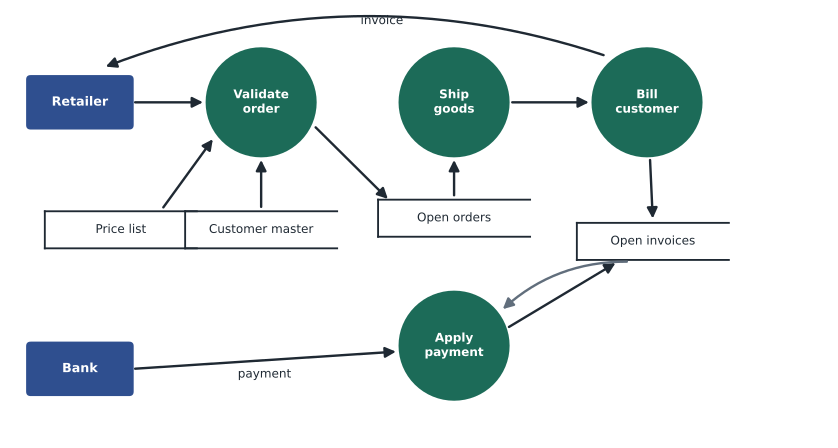
A data flow diagram looks only at data: where it comes from, how it is changed and where it goes. It uses four symbols. External entities (squares) are people or organizations outside the system that send or receive data, such as customers, suppliers or the tax authority. Processes (circles or rounded rectangles) transform data, such as "validate order" or "calculate commission". Data stores (open rectangles) hold data at rest, such as the customer master file or the open orders table. Data flows (arrows) show data moving between the other three. DFDs deliberately leave out who does the work and what technology is used, so they stay valid when the people or software change.
DFDs are drawn at levels. The context diagram (level 0) shows the whole system as one process with its external entities. A level 1 diagram breaks that process into its main subprocesses, and level 2 diagrams break each of those down further. Each lower level must balance with the level above: the data flows entering and leaving a process on one level must match the flows on the diagram that decomposes it. DFDs also follow simple rules that help catch design errors. Data cannot flow directly between two external entities or between two data stores; it must pass through a process. Every data store must be written by at least one process and read by at least one process, or it is either useless or a black hole.
# Checking simple data flow diagram rules for Ridgeback's order process (illustrative)
entities = {"Retailer", "Bank"}
processes = {"Validate order", "Ship goods", "Bill customer", "Apply payment"}
stores = {"Customer master", "Open orders", "Open invoices", "Price list"}
flows = [("Retailer", "Validate order"), ("Customer master", "Validate order"),
         ("Price list", "Validate order"), ("Validate order", "Open orders"),
         ("Open orders", "Ship goods"), ("Ship goods", "Bill customer"),
         ("Bill customer", "Open invoices"), ("Bill customer", "Retailer"),
         ("Bank", "Apply payment"), ("Apply payment", "Open invoices"),
         ("Open invoices", "Apply payment")]

problems = []
for a, b in flows:
    if a in entities and b in entities: problems.append(f"entity to entity: {a} -> {b}")
    if a in stores and b in stores: problems.append(f"store to store: {a} -> {b}")
for s in sorted(stores):
    written = any(b == s and a in processes for a, b in flows)
    read = any(a == s and b in processes for a, b in flows)
    if not written: problems.append(f"{s} is never written by a process")
    if not read: problems.append(f"{s} is never read by a process")
print("\n".join(problems) if problems else "No rule violations")Customer master is never written by a process Price list is never written by a process
The check flags the customer master and price list as stores that are read but never written in this diagram. That is not necessarily an error: those stores are maintained by other processes (customer setup and price maintenance) that belong on another diagram. But it is exactly the kind of question a reviewer should ask, because master data maintenance is where many control weaknesses hide. Who can change prices? Who can create a new customer and set its credit limit? A DFD that shows only the transaction flow can make master data look as though it maintains itself.
BPMN
Business Process Model and Notation is an international standard (ISO/IEC 19510) maintained by the Object Management Group. It was designed to be understood by business users while being precise enough for software to execute or simulate. Its core elements are events (circles: start, intermediate and end), activities (rounded rectangles), gateways (diamonds that split and merge flows, such as exclusive or parallel gateways), sequence flows (solid arrows), message flows (dashed arrows between participants) and pools and lanes for participants. Many ERP vendors and implementation consultants document processes in BPMN, and some workflow tools can run a BPMN model directly, so understanding the basics helps accountants review the processes that will be built into a new system.
BPMN is especially good at showing timing and exceptions. A timer event can show that an unapproved purchase requisition escalates to the manager's manager after three days. A boundary event can show what happens if a payment is rejected by the bank. Parallel gateways show steps that happen at the same time, such as picking goods while the credit check runs. For control documentation, the key questions are the same as for a flowchart: where are the approvals, who performs them, what happens when a check fails, and can one person complete the whole process alone?
| Tool | Best for | Shows who does the work? | Typical user |
|---|---|---|---|
| Narrative | Detail, reasons and exceptions | Yes, in words | Everyone; auditors' working papers |
| Document or system flowchart | Documents, systems and handoffs between departments | Yes, with swimlanes | Accountants and auditors |
| Data flow diagram | Data sources, transformations and stores | No | Systems analysts and designers |
| BPMN | Sequence, timing, decisions and exceptions | Yes, with pools and lanes | ERP projects and process improvement teams |
Worked problem
Finding a control gap from documentation
Ridgeback's flowchart of the sales return process shows that the customer service clerk issues return authorizations, prepares credit memos and has access to post credit memos below $500 without approval. The warehouse records goods received but does not see the credit memo. Identify the risk and suggest a control.
Show solution
- The clerk could issue a credit memo for goods that were never returned, for example to a retailer who is a friend, or to cover the theft of a customer payment.
- Because credit memos below $500 need no approval and the warehouse never sees them, nothing links a credit to an actual receipt of goods.
- A preventive control is to have the ERP require a matching warehouse receipt record before any credit memo for returned goods can be posted.
- A detective control is a monthly report of all credit memos, by clerk and by customer, reviewed by the AR supervisor, with attention to many small credits to the same customer.
Answer: The gap is the lack of a link between credits and physical returns; requiring a receipt record and reviewing a credit memo report closes it.
Documentation is never finished. Processes change when systems are upgraded, when staff turn over and when the business adds new products or channels. Organizations subject to internal control certification usually review their process documentation every year, and good practice is to update it whenever a significant change goes into production. A version history and an owner for each process document make it clear which picture is current, and they give auditors evidence that the documentation is maintained rather than created once for an audit.
For Canadian reporting issuers, the certification required by National Instrument 52-109 means management must design internal control over financial reporting and be able to support its conclusions, which in practice requires process documentation of the significant transaction flows. Private companies have no such legal requirement, but lenders, auditors and acquirers often expect it.
Common mistakes
MistakeDocumenting the process as written in the policy manual.
InsteadConfirm with a walkthrough of real transactions; the actual process often differs.
MistakeDrawing a DFD that shows which department does each step.
InsteadDFDs show data and transformations only; use a swimlane flowchart or BPMN to show who does the work.
MistakeLetting a data store appear with no process that writes to it.
InsteadEvery store needs a writer and a reader, or the diagram is incomplete; ask who maintains master data.
MistakeDrawing one enormous flowchart of the whole company.
InsteadUse a high-level diagram plus detailed diagrams for each process, with connectors.
MistakeLeaving the decision exits unlabelled.
InsteadEvery diamond or gateway needs labelled outcomes so the exception path is visible.
Summary and key terms
- Documentation creates a shared, checkable picture of how a process really works.
- Narratives give detail; walkthroughs confirm that the documentation matches reality.
- Swimlane flowcharts show documents, systems and who performs each step.
- Data flow diagrams show external entities, processes, data stores and data flows, without people or technology.
- DFD levels must balance, and every data store needs a process that writes and a process that reads it.
- BPMN is an ISO standard notation that shows events, activities, gateways, timing and exceptions.
- Documentation must be owned, versioned and updated when processes or systems change.
- Narrative
- A written description of a business process.
- Walkthrough
- Following one transaction through a process to confirm how it really works.
- Swimlane
- A row or column in a diagram representing one role or department.
- Document flowchart
- A diagram of documents moving between departments and processing steps.
- System flowchart
- A diagram of inputs, computer processing and outputs.
- Data flow diagram
- A diagram of external entities, processes, data stores and data flows.
- Context diagram
- The top-level DFD showing the whole system as one process with its external entities.
- Balancing
- The rule that flows into and out of a process match the flows on its lower-level diagram.
- BPMN
- Business Process Model and Notation, an ISO-standardized notation for process models.
- Gateway
- A BPMN diamond that splits or merges sequence flows.
Practice problems
Work each problem on paper first, then reveal the answer to check.
Why is a walkthrough needed if a process narrative already exists?
Show answer
To confirm that the documented process matches what people actually do.
Name the four DFD symbols.
Show answer
External entity, process, data store and data flow.
Can data flow directly from the customer master to the open orders store?
Show answer
No; data must pass through a process between two stores.
What does a swimlane show that a DFD does not?
Show answer
Which role or department performs each step.
Which BPMN element would show escalation after three days without approval?
Show answer
A timer event (often attached as a boundary event to the approval task).
In the code example, which stores were flagged and why might that be acceptable?
Show answer
Customer master and price list were never written; they are maintained by other processes on other diagrams.
Give one question a reviewer should ask about the price list store.
Show answer
Who can change prices, and is each change approved and logged?
Suggest a preventive control for credit memos at Ridgeback.
Show answer
Require a matching warehouse receipt record before a return credit can post.
What is DFD balancing?
Show answer
Flows entering and leaving a process match those on the diagram that decomposes it.
Why should process documentation have an owner and version history?
Show answer
So readers know which version is current and auditors can see it is maintained.
Lesson quiz · 5 questions
Score 60% or more to complete this lesson.
Create a free account to save your progress, take quizzes and earn a certificate.