
ACCT-102 · Lesson 7 of 12 · 25 min
Activity-based costing: an introduction
Traditional costing systems assign overhead using a volume-based measure such as direct labour hours or machine hours. That works well when overhead is driven mainly by volume and products are similar. It works badly when products differ in complexity, batch size or the support they need, because overhead caused by complexity gets spread according to volume. The result is cost distortion: high-volume, simple products are overcosted and low-volume, complex products are undercosted. Activity-based costing (ABC) addresses the problem by identifying the activities that consume overhead resources and assigning costs to products according to their use of those activities. This lesson introduces the ideas, works through a trial ABC model for Cedar Ridge's whole plant, and discusses when ABC is worth its cost. ACCT-222 develops ABC, time-driven ABC and activity-based management in depth.
Why traditional allocation can mislead
Lesson 5 showed that departmental rates can be more accurate than a plantwide rate. ABC takes the idea further. Consider what happens in Cedar Ridge's plant now that it makes three kinds of product: thousands of Classic chairs in large batches, trestle benches in small batches, and one-off custom pieces. A batch of 200 chairs needs one machine set-up; a batch of 20 benches also needs one set-up; each custom piece needs its own set-up, design drawings and extra inspections. Set-up, design and inspection costs are driven by batches, designs and inspections, not by labour hours. Yet a plantwide labour-hour rate charges them to products in proportion to labour hours, and chairs use most of the labour hours.
Changes in manufacturing made the problem more serious. As automation replaced direct labour, overhead grew as a share of total cost and labour shrank, so the rate per labour hour climbed and small errors in the allocation base produced large errors in product costs. Companies that kept pricing from traditional costs sometimes found themselves winning orders for products that lost money and losing orders for products they thought were marginal but were in fact very profitable.
The cost hierarchy
ABC begins by classifying activities by the level at which their costs are caused. This cost hierarchy is useful even without a full ABC system, because it tells managers which costs change with which decisions.
| Level | Cost driven by | Cedar Ridge examples | Typical driver |
|---|---|---|---|
| Unit-level | Each unit produced | Machine power, router bits, hardwood | Machine hours, units |
| Batch-level | Each batch, regardless of size | Machine set-ups, first-piece inspection, material moves | Number of set-ups or batches |
| Product-sustaining | Supporting a product line or design | Design drawings, CNC programming, jig maintenance | Design hours, number of products |
| Customer-sustaining | Serving a particular customer | Account management, custom packaging | Number of customers or orders |
| Facility-sustaining | Keeping the plant running | Plant manager, building insurance, property tax | Not caused by products; often allocated or left unallocated |
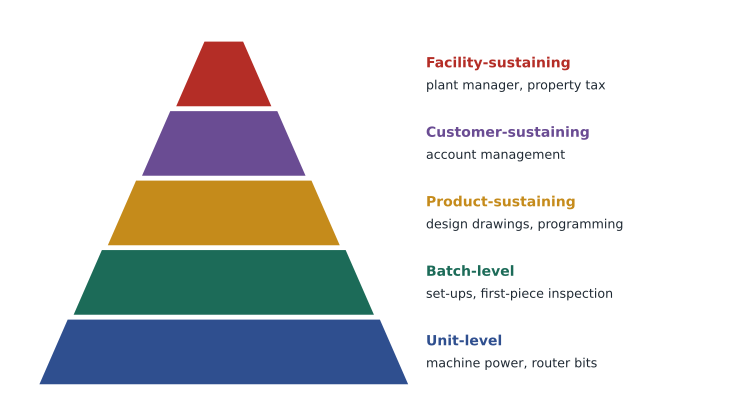
The hierarchy reveals why volume-based allocation fails. Only unit-level costs vary with units. A set-up costs the same whether the batch is 20 benches or 200 chairs, so per unit it is ten times as expensive for benches. A volume-based rate cannot see this.
Designing an ABC system in five steps
An ABC system is built in five steps. First, identify the main activities that consume overhead resources, by interviewing staff and observing operations. Second, assign overhead costs to activity cost pools, using resource drivers such as the time staff spend on each activity or the floor space it occupies. Third, choose an activity cost driver for each pool, a measure of how much of the activity each product uses. Fourth, compute an activity rate for each pool: pool cost divided by total driver quantity. Fifth, assign costs to products by multiplying each activity rate by the product's use of the driver.
Cedar Ridge's controller builds a trial model of next year's total plant overhead of $579,000, covering the chair line, the bench line and the custom shop, which now share one building. Interviews and payroll records split the overhead into five pools.
| Activity pool | Cost | Driver | Chairs | Benches | Custom | Total driver |
|---|---|---|---|---|---|---|
| Machining | $192,000 | Machine hours | 3,500 | 1,400 | 1,500 | 6,400 |
| Set-ups | $112,500 | Number of set-ups | 35 | 70 | 120 | 225 |
| Inspection | $90,000 | Number of inspections | 70 | 140 | 240 | 450 |
| Design support | $135,000 | Design hours | 100 | 150 | 1,250 | 1,500 |
| Facility | $49,500 | Direct labour hours | 10,500 | 2,800 | 6,000 | 19,300 |
# Traditional versus activity-based overhead (illustrative)
pools = {   # pool: (cost, driver use by chairs, benches, custom)
    "Machining":      (192_000, (3_500, 1_400, 1_500)),
    "Set-ups":        (112_500, (35, 70, 120)),
    "Inspection":     (90_000, (70, 140, 240)),
    "Design support": (135_000, (100, 150, 1_250)),
    "Facility":       (49_500, (10_500, 2_800, 6_000)),
}
products = ("Chairs", "Benches", "Custom")
units = (7_000, 1_400, 60)
dlh = (10_500, 2_800, 6_000)

total = sum(c for c, _ in pools.values())
plant_rate = total / sum(dlh)
abc = [0.0, 0.0, 0.0]
for name, (cost, use) in pools.items():
    rate = cost / sum(use)
    print(f"{name:<15} rate ${rate:,.2f}")
    for i, u in enumerate(use):
        abc[i] += rate * u

print(f"Plantwide rate ${plant_rate:.2f} per DL hour")
for i, p in enumerate(products):
    trad = dlh[i] * plant_rate
    print(f"{p:<8} traditional ${trad:>9,.0f} (${trad / units[i]:,.2f}/unit)   "
f"ABC ${abc[i]:>9,.0f} (${abc[i] / units[i]:,.2f}/unit)")Machining rate $30.00 Set-ups rate $500.00 Inspection rate $200.00 Design support rate $90.00 Facility rate $2.56 Plantwide rate $30.00 per DL hour Chairs traditional $ 315,000 ($45.00/unit) ABC $ 172,430 ($24.63/unit) Benches traditional $ 84,000 ($60.00/unit) ABC $ 125,681 ($89.77/unit) Custom traditional $ 180,000 ($3,000.00/unit) ABC $ 280,889 ($4,681.48/unit)
The results are striking. Under the plantwide rate of $30 per direct labour hour, each chair carries $45 of overhead, each bench $60 and each custom piece $3,000. Under ABC, a chair carries about $24.63, a bench about $89.77 and a custom piece about $4,681. Chairs, which run in long batches and need little design work, have been subsidizing benches and custom work. The total overhead is the same $579,000 under both systems; ABC only redistributes it according to cause.
| Overhead per unit | Traditional (labour hours) | ABC | Difference |
|---|---|---|---|
| Classic chair | $45.00 | about $24.63 | overcosted by about $20 |
| Trestle bench | $60.00 | about $89.77 | undercosted by about $30 |
| Custom piece (average) | $3,000 | about $4,681 | undercosted by about $1,681 |
Using ABC information
Better product costs matter because managers use them to price, to choose the product mix and to decide where to cut costs. The trial model suggests three conclusions for Cedar Ridge. First, the Classic chair is more profitable than the traditional system shows, which supports defending its market share, perhaps with a modest price cut to large retailers. Second, the bench's small batches make it costlier than expected; managers might raise its price, run larger batches or simplify its design to reduce set-ups. Third, custom work is expensive to support, especially in design hours, so quotes based on a $25 labour-hour overhead rate (lesson 5) may be too low; the custom shop might charge separately for design or set a minimum order value.
Worked problem
Re-pricing the bench
The bench sells for $300. Its direct materials are $110 and direct labour is 2 hours at $20. Compare its full manufacturing cost and gross margin under each system.
Show solution
- Direct costs = $110 + $40 = $150.
- Traditional full cost = $150 + $60 = $210; gross margin = $300 − $210 = $90, or 30 per cent.
- ABC full cost = $150 + $89.77 ≈ $239.77; gross margin ≈ $60.23, or about 20 per cent.
- A larger batch size would cut set-up cost per bench; doubling batches from 20 to 40 benches halves set-ups from 70 to 35, saving 35 × $500 = $17,500, or $12.50 per bench, if set-up resources can actually be reduced.
Answer: The bench earns about 20 per cent gross margin under ABC rather than 30 per cent; larger batches or a price rise would help.
Activity-based management (ABM) uses activity information to improve operations, not just to cost products. Managers ask which activities add value for customers and which do not. Machining a chair adds value; moving lumber across the plant twice, waiting for set-ups and re-inspecting rework do not. Reducing the number of set-ups (by standardizing parts or using quick-change jigs), the time per set-up and the need for inspection (by building quality into the process) lowers costs directly. These ideas link to the lean operations of BUS-230 lesson 11.
ABC can also cost customers. If one retailer orders chairs in small, frequent orders with special packaging and returns, while another orders full truckloads, the two may have very different profitability even at the same price. Customer profitability analysis assigns order-processing, delivery, packaging and service costs to customers using activity drivers, and sometimes reveals that a small share of customers earns most of the profit while some lose money.
# Customer profitability with activity costs (illustrative)
rates = {"order": 85, "delivery": 240, "custom packaging (per chair)": 3.5, "return processed": 60}
customers = {
    "Northgate Home (big-box)": {"chairs": 2_400, "price": 172, "order": 12, "delivery": 12,
                                 "custom packaging (per chair)": 0, "return processed": 10},
    "Maple & Oak (boutique)":   {"chairs": 300, "price": 180, "order": 40, "delivery": 40,
                                 "custom packaging (per chair)": 300, "return processed": 18},
}
vc_per_chair = 108
for name, c in customers.items():
    cm = c["chairs"] * (c["price"] - vc_per_chair)
    service = sum(rates[k] * c[k] for k in rates)
    print(f"{name:<26} CM ${cm:>8,}  service costs ${service:>7,.0f}  "
f"customer margin ${cm - service:>8,.0f}")Northgate Home (big-box) CM $ 153,600 service costs $ 4,500 customer margin $ 149,100 Maple & Oak (boutique) CM $ 21,600 service costs $ 15,130 customer margin $ 6,470
The boutique pays the full $180 but places 40 small orders, each delivered separately, demands custom packaging and returns more chairs. After its service costs, it earns far less per chair than the big-box retailer that negotiated a lower price. That does not mean the boutique should be dropped; it may value Cedar Ridge's brand or pay for custom work. It means Cedar Ridge might set minimum order sizes, charge for small deliveries or encourage online ordering to reduce order-processing costs.
ABC in service organizations
Service businesses have mostly indirect costs, so ABC is often even more useful there. Banks use it to cost accounts and transactions, hospitals to cost procedures and patient days, and logistics firms to cost shipments of different sizes and destinations. A bank might find that a customer who visits a branch to deposit cheques costs many times more to serve than one who deposits by phone, which helps explain differentiated fees.
Benefits, costs and limitations
ABC is most valuable when overhead is a large share of total cost, products or customers differ greatly in volume, batch size or complexity, competition is intense so that pricing errors are punished, and managers suspect distortion because profits of different products do not make sense. It is less useful when products are similar, overhead is small, or the information will not change decisions.
| Benefits | Costs and limitations |
|---|---|
| More accurate product and customer costs | Expensive to design and maintain; needs data on many drivers |
| Better pricing and product mix decisions | Facility-sustaining costs still need arbitrary allocation or none |
| Visibility of non-value-added activities | Assumes activity costs vary with drivers, which may not hold in the short run |
| Links costs to operational improvements (ABM) | Employees may resist time surveys; models can become outdated |
| Supports customer profitability analysis | Not required for external reporting; may need a separate system |
One limitation deserves emphasis. ABC costs are long-run costs of using resources, not short-run incremental costs. If Cedar Ridge reduces bench set-ups, it saves money only if it actually reduces the resources supplied for set-ups, for example by redeploying a set-up technician or cutting overtime. Otherwise the freed capacity is simply unused. Time-driven ABC, which estimates the time each activity takes and the cost per minute of capacity supplied, makes unused capacity visible and is easier to maintain; ACCT-222 covers it. For financial reporting, ABC can be used to value inventory only if it assigns manufacturing costs consistently with the framework; non-manufacturing activity costs, such as customer service, remain period costs.
Common mistakes
MistakeAssuming ABC changes total overhead.
InsteadABC redistributes the same total; it changes product costs, not the total.
MistakeAllocating batch-level costs on units or labour hours.
InsteadUse batch drivers such as the number of set-ups.
MistakeExpecting savings simply because ABC shows an activity is costly.
InsteadSavings occur only if resources supplied to the activity are actually reduced or redeployed.
MistakeForcing facility-sustaining costs onto products as if they were caused by them.
InsteadRecognize that any allocation of facility costs is arbitrary; some companies leave them unallocated.
MistakeDropping a customer because ABC shows a low margin.
InsteadConsider strategic value and whether service costs can be reduced or charged for first.
Summary and key terms
- Volume-based allocation overcosts high-volume, simple products and undercosts low-volume, complex ones.
- The cost hierarchy classifies costs as unit, batch, product-sustaining, customer-sustaining and facility-sustaining.
- ABC assigns overhead to activity pools and then to products using activity drivers.
- Activity rate = activity pool cost ÷ total driver quantity.
- In the trial model, ABC lowered chair overhead from $45 to about $24.63 and raised bench and custom overhead.
- Activity-based management and customer profitability analysis use activity information to improve operations and relationships.
- ABC is worth its cost when overhead is large, products are diverse and decisions depend on cost accuracy.
- Activity-based costing
- A costing system that assigns overhead to products according to their use of activities.
- Activity
- A task or event that consumes resources, such as a set-up or inspection.
- Activity cost pool
- The accumulated cost of an activity.
- Activity cost driver
- A measure of the amount of an activity used by a cost object.
- Activity rate
- Activity cost pool divided by total driver quantity.
- Cost hierarchy
- A classification of costs by the level of activity that causes them.
- Batch-level cost
- A cost incurred each time a batch is processed, regardless of batch size.
- Product-sustaining cost
- A cost of supporting a product line or design.
- Activity-based management
- Using activity information to improve processes and reduce non-value-added work.
- Customer profitability analysis
- Assigning revenues and activity costs to customers to measure their profitability.
Practice problems
Work each problem on paper first, then reveal the answer to check.
A set-up pool costs $60,000 and there are 150 set-ups. Find the activity rate.
Show answer
$400 per set-up.
A product uses 12 set-ups. How much set-up cost does it receive?
Show answer
12 × $400 = $4,800.
Classify: a quality engineer who maintains the specifications for one product line.
Show answer
Product-sustaining.
Classify: property tax on the plant.
Show answer
Facility-sustaining.
Why does a volume-based rate undercost small-batch products?
Show answer
It ignores batch-level costs, which are spread over few units in small batches.
In the trial model, how much overhead does ABC assign to all chairs?
Show answer
About $172,430.
The bench's batch size rises from 20 to 50. How many set-ups are needed for 1,400 benches?
Show answer
28 set-ups.
Give an example of a non-value-added activity in a furniture plant.
Show answer
Moving materials twice, waiting, rework or re-inspection.
Why might the boutique customer still be worth keeping?
Show answer
Strategic value, brand image, custom work or the possibility of reducing or charging for service costs.
Change the program so the bench needs 35 set-ups. What is its new ABC overhead per bench?
Show answer
The set-up rate becomes 112,500 ÷ 190 ≈ $592.11; bench overhead falls to about $79.58 per bench (all products' costs change because the rate changes).
Lesson quiz · 5 questions
Score 60% or more to complete this lesson.
Create a free account to save your progress, take quizzes and earn a certificate.